
Deep Knowledge
Measuring Ecosystem Condition: EcoIntel's Land Health Score and the State of Nature
Every nature-disclosure framework centres ecosystem condition, none defines the metric. See how EcoIntel's Land Health Score supplies it from satellite.
In the space of two years, the condition of nature has gone from a phrase ecologists used among themselves to a line item written into European law and global accounting standards. The Taskforce on Nature-related Financial Disclosures set the template in 2023. The EU’s Corporate Sustainability Reporting Directive made ecosystem reporting a legal duty through its ESRS E4 standard. The Global Reporting Initiative published GRI 101, its first dedicated biodiversity standard, in force from the start of 2026. The Science Based Targets Network asks companies to set targets against a baseline state of nature. The ISSB, whose IFRS standards are the global baseline for sustainability reporting, has confirmed it is building its nature guidance on the TNFD recommendations.
All of them put the same thing near the centre, in slightly different words: the condition of the ecosystems your business affects and depends on. And all of them stop at the same place. They name condition as something to report. None of them tells you how to measure it.
The box on the form, and nothing to put in it
TNFD is candid about it. In its own guidance on measuring the state of nature it states that it “does not currently specify one metric as there is no single metric that will capture all relevant dimensions of changes to the state of nature and a consensus is still developing” (TNFD, 2026). On its own list of core global metrics, TNFD prints ecosystem condition and species extinction risk as two boxes side by side and prescribes a measure for neither: it marks ecosystem condition a placeholder, and notes there is no single agreed metric for species (TNFD metrics). ESRS E4 and GRI 101 inherit the same silence. The standard names the thing to disclose, the box sits there on the page, and the question of what number goes in it is handed back to you.
That is not a small omission, because condition is the part that matters most. Extent tells you how much habitat you have. Condition tells you whether it works. Leave it out and a nature disclosure is an inventory with no health check: a record of where your land is and how much of it there is, silent on whether any of it is functioning.
This piece is about that missing number. What ecosystem condition actually means, who is asking for it, the science of turning it into a defensible figure, the engine that produces it, how it maps to the frameworks, and what it cannot do. The claim at the centre deserves to be checked, so it is set out in full: that EcoIntel’s Land Health Score is the ecosystem-condition metric the frameworks demand and decline to define.
What ecosystem condition actually means
The word condition is doing precise technical work in these frameworks, and the precision is the point. It is not a vibe or a green badge. It has a definition, and the definition has a pedigree.
The anchor is the United Nations System of Environmental-Economic Accounting, Ecosystem Accounting, known as the SEEA EA. The UN Statistical Commission adopted it as an international statistical standard in March 2021 (UN SEEA, 2021). It is the same family of statistics that gives the world GDP, applied to nature, and it is the reference the disclosure frameworks lean on. The SEEA defines the term plainly: “Ecosystem condition is the quality of an ecosystem measured in terms of its abiotic and biotic characteristics” (UN SEEA EA, 2021). Condition, it adds, is assessed with respect to an ecosystem’s composition, structure and function, which underpin its integrity.
Three features of that definition decide everything that follows.
The first is that condition is paired with, and distinct from, extent. The SEEA treats them as the two halves of an ecosystem’s account: extent is the size of the asset, condition is the quality of it. Counting hectares of woodland is straightforward. Saying whether that woodland is functioning, recovering or quietly failing is the hard part, and it is the part that decides whether the woodland will still be there, and still working, in twenty years.
The second is that condition is always measured against a reference. You do not score an ecosystem’s quality on an absolute scale; you score it relative to what that kind of ecosystem could be. The SEEA is explicit that “for every ecosystem type, a reference level is provided against which values for indicators can be compared over time” (UN SEEA, 2021), and it bounds that scale at both ends: an upper reference such as the natural state, and a lower reference such as ecosystem collapse. Condition runs from collapse at the bottom to natural integrity at the top, and a given site sits somewhere on that line for its own kind of habitat. A hill farm is judged against what that hill could be, not against a lowland meadow.
The third is that the SEEA tells you what to read. Its Ecosystem Condition Typology sorts the measurable qualities of an ecosystem into six classes in three groups (Czúcz et al., 2021): abiotic characteristics, split into physical state (soil structure, water availability) and chemical state (nutrient levels, water quality); biotic characteristics, split into compositional state (the diversity of the living community), structural state (aggregate properties such as biomass and canopy cover, where the typology explicitly names vegetation indices) and functional state (the interactions between compartments, including primary productivity); and landscape characteristics (the pattern of habitats at coarse scales, including connectivity). Read those characteristics well, against a reference, and you have measured condition.
It is worth being clear about condition and two neighbouring words it gets muddled with: integrity and biodiversity. Integrity, in the SEEA’s framing, is what high condition across composition, structure and function amounts to, an ecosystem operating near its natural state. Condition is the measurable thing; integrity is the high end of it. Biodiversity is different again. It is the variety of life, and while a healthy community is part of good condition, the number of species present is not the same as whether the system is functioning. A simplified system can still function for a while; a diverse one can still be in decline. Condition measures the working of the system. Biodiversity counts its parts. That distinction matters enormously for what follows.
Who is asking for it, and in what words
The SEEA is the statistical anchor. The reason condition has become urgent is that the disclosure frameworks built on top of it, almost all at once, and turned a statistical concept into a reporting obligation.
TNFD defines the state of nature as the condition and extent of ecosystems plus species population size and extinction risk, noting that this “builds on the approach of the UN System of Environmental Economic Accounting” (TNFD, 2026). Its core global metric is the level of ecosystem condition by type of ecosystem, which it openly labels a placeholder pending the consensus it admits is still forming. Its assessment method, LEAP (Locate, Evaluate, Assess, Prepare), asks an organisation to find where it touches nature and judge the condition of the ecosystems there (TNFD, 2023).
The EU’s ESRS E4, the biodiversity and ecosystems standard under the CSRD, carries disclosure requirement E4-5, on impact metrics related to biodiversity and ecosystems change (European Commission, 2023). It asks undertakings with material impacts to report on the extent and condition of ecosystems. When the EU simplified its sustainability rules through the Omnibus process in late 2025, the volume of mandatory data points fell, but the substance held: where ecosystem impact is material, extent and condition are what you report, and the metric itself is left open.
GRI 101: Biodiversity 2024, the GRI’s first dedicated biodiversity standard, took effect on 1 January 2026 and asks reporting organisations to describe impacts on the condition of affected ecosystems, again without mandating a single measure. The Science Based Targets Network asks companies to baseline and then set targets against the state of nature (SBTN, 2020). Above all of these sits the policy goal they serve: the Kunming-Montreal Global Biodiversity Framework, agreed in 2022, sets its Goal A around the integrity, connectivity and resilience of all ecosystems (CBD, 2022). Integrity, connectivity, resilience: condition, by another set of words.
And the bodies trying to standardise the measurement are converging on the same shape. The Nature Positive Initiative, a coalition of more than two dozen nature organisations, has settled on four headline state-of-nature indicators, and two of the four are condition: ecosystem extent, ecosystem condition at the site level, ecosystem condition at the landscape level, and species extinction risk (Nature Positive Initiative, 2025).
The pattern is unmistakable. Extent, condition, and species, every time. Condition always scored against a reference between collapse and natural integrity. And the metric for it always left to the preparer to source. That is the gap, and it is a hole at the centre of the entire nature-disclosure stack.
Snapshot and flow: why condition is the foundation
Before the science, a way of seeing it, because the reason condition matters most is not obvious until the frame clicks into place.
Think about how you would judge a football team. You could count the metres they passed in a single match. It would be a real number, precisely measured, and it would tell you almost nothing about whether they are any good. What you actually care about is whether they win, across a season, and why. Land is the same. A soil-carbon stock, a one-off biodiversity count, a single year’s yield are all metres-passed numbers: snapshots of a state at a moment. Each is real, and each is a fragment. What decides whether land thrives is the set of flows running through it, the cycles that move water, energy, minerals and life. Condition is a reading of those flows. It is the season, not the match.
This is why condition sits underneath the things people more often try to measure, in a fairly literal sense. You cannot have the species without a functioning habitat to hold them. You cannot bank the carbon without the water and mineral cycles that build it and keep it there. Get condition right, continuously, and the rest has something to stand on. Leave it unmeasured, and every snapshot floats free of its context.
There is a second reason condition is the foundation, from the practice of ecological monitoring rather than the theory. Because condition measures the working of the system rather than a tally of its parts, it turns before the parts do. Function is a leading indicator; the species list, the carbon stock and the yield are lagging ones. By the time the lagging numbers move, the decision window has often closed. The distinction is built into the field protocols ecologists use, which separate “leading indicators of ecological health, or those indicators that have predictive value about the direction of changes” from the slower lagging indicators that confirm an outcome after the fact (Savory Institute, 2018). Condition, read well, is both the early warning and the early encouragement. The frameworks are right to ask for it. The difficulty has only ever been measuring it.
The four ecosystem flows
EcoIntel reads condition as four ecosystem flows, the processes that between them decide whether a piece of land is alive and working. The four come from Holistic Management, the framework for managing land as a living system, which teaches that the health of any landscape rests on the water cycle, the mineral cycle, energy flow and community dynamics (Savory Institute). They are scored as four indices, each from 0 to 100 for every field. They are functional, not compositional: they are what the SEEA means by function, and they are what a satellite, read carefully, can see.
The water cycle (the Water Cycle Index, WCI) is the movement of water from the atmosphere into the soil and back: whether rain soaks in or runs off, whether the soil surface is covered or capped, whether the land holds moisture or sheds it. It is the first flow because nothing else works without it. From space, EcoIntel reads it through a combination of optical and radar signals: surface moisture, the extent of bare ground, protective vegetation cover, and the way terrain channels water. A high WCI means rain is becoming soil moisture rather than runoff.
Energy flow (the Energy Flow Index, EFI) is the conversion of sunlight, through green growing plants, into the energy that feeds everything else: photosynthesis and the productivity it drives. It is the most directly visible of the four from orbit, because photosynthesising vegetation has a strong optical signature. EcoIntel reads it through vegetation indices that track canopy vigour and the length and strength of the growing season, cross-checked against an independent satellite estimate of gross primary productivity.
The mineral cycle (the Mineral Cycle Index, MCI) is the movement of nutrients from soil to plants and animals and back: decomposition, nutrient availability, the turnover that keeps fertility in circulation. It is the hardest of the four to see directly, because much of it happens below ground. EcoIntel infers it from the surface signals that track with it: litter and residue cover, the balance of bare and vegetated ground, and the spectral signatures associated with nutrient status, combined with soil-property data.
Community dynamics (the Community Dynamics Index, CDI) is the ever-changing web of relationships among living things: the structure and diversity of the plant community, how it changes through the seasons, how resilient and varied it is. This is the flow most often confused with biodiversity, and the distinction matters. EcoIntel reads community dynamics as a structural-diversity proxy, never as a species count. It infers the variety and structure of the living community from how the vegetation signal varies across space and through the seasons: a monoculture and a diverse sward behave differently across a year, and that difference is visible from orbit. What the CDI does not do, ever, is name a species.
The four flows are deliberately not independent. In a functioning landscape they reinforce one another: water enables growth, growth feeds the mineral cycle, a healthy mineral cycle and a varied community sustain growth. In a degrading one they fail together. That is why a single integrated read of all four, against a local reference, is a more honest picture of condition than any one index alone, and why they roll up into one headline number.
The science of ecological health, from theory to a number
Here is the encouraging part. The science of turning the condition of a living system into a defensible number is not new, and it is not soft. It has a forty-year pedigree in the peer-reviewed literature, and a parallel pedigree in the hands of the farmers and ecologists who walk the ground. EcoIntel’s metric sits at the join of the two.
The scientific lineage starts with the recognition that ecosystems under stress show a consistent, measurable syndrome. In 1985, Rapport, Regier and Hutchinson described an ecosystem-level distress syndrome that becomes “manifest through changes in nutrient cycling, productivity, the size of dominant species, species diversity, and a shift in species dominance to opportunistic shorter-lived forms” (Rapport et al., 1985). Degradation is not random. It has a signature, and the signature is functional: cycles falter, productivity drops, the community simplifies. Those are the four flows, described in the language of pathology.
By the late 1990s that insight had hardened into a working definition of ecosystem health. Costanza and Mageau set it out: an ecological system is healthy “if it is stable and sustainable, that is, if it is active and maintains its organization and autonomy over time, and is resilient to stress” (Costanza and Mageau, 1999). Health became something you could decompose and assess, and it was always understood as condition relative to a reference. That reference idea was then made operational: in 2006, Stoddard and colleagues formalised the concept of reference condition for ecological assessment, establishing that you judge a site against the expected state for its type. This is exactly the structure the SEEA would later adopt for its condition accounts. The national accounting standard and the field ecology converge, independently, on the same shape.
One fork is worth naming, because EcoIntel took one road and not the other. Much of the grassland ecosystem-health work, particularly out of China, operationalises Costanza’s framing as vigour, organisation and resilience, the VOR model (Li et al., 2013). EcoIntel’s index does not use VOR. It uses the four ecosystem processes of Holistic Management, because those processes are functional, measurable from the land surface, and already embedded in a working field protocol. The Savory Institute turned those four processes into Ecological Outcome Verification (EOV), which it describes as “a practical and scalable soil and landscape assessment methodology that tracks outcomes in biodiversity, soil health, and ecosystem function (water cycle, mineral cycle, energy flow and community dynamics)” (Savory Institute, 2018). EOV scores visual indicators in the field, benchmarks each site against a local reference area, and is used on farms across six continents.
The two roads, academic and practitioner, meet in a single peer-reviewed paper. In 2019, Xu, Rowntree, Borrelli, Hodbod and Raven published the Ecological Health Index, the EHI, in the journal Environments (Xu et al., 2019). The EHI is a visual assessment method built as fifteen indicators that map onto the four Holistic Management processes, scored as the departure of a site from a reference area, and summed into a single index. It was tested across forty-four farms covering almost four hundred thousand hectares. The EHI is the scientific backbone EcoIntel builds on: a published, field-validated way of turning the four flows, scored against a local reference, into one number for the condition of land. What was missing was a way to run it everywhere, cheaply, and back through time.
From the field to space: the EcoDynamics Diagnostic Engine
Field assessment, for all its rigour, has a ceiling. A skilled assessor walking a farm produces excellent data for the points they walk, on the day they walk them, but the method “cannot be widely applied at a large spatial scale and has difficulty in providing spatially and temporally explicit assessment” (Li, Xu and Guo, 2014). It is expensive, point-in-time, local, and it cannot be run on every parcel of a supply chain, still less on the years already passed. The same review names the alternative: “remote sensing data have potential for assessing and monitoring ecosystem health at different temporal and spatial scales across extensive areas”.
That is what the EcoDynamics Diagnostic Engine does. It reads the four ecosystem flows from satellite and other open data, scores them against each site’s ecoregion reference, and turns the result into a condition number for every parcel. It is, in the engineering sense, a digital twin of the living land: not a model of how the land looks, a model of how it works, a data-driven representation of the flows of water, energy, minerals and life moving across the actual terrain, week by week, back to 2018. The reason this is possible now is the combination of free global satellite archives and modern machine learning. Ecological Intelligence combined with Artificial Intelligence: the ecology defines what to read, the AI makes reading it at planetary scale affordable.
The raw material is public. The European Space Agency’s Copernicus programme flies Sentinel-2, a thirteen-band optical instrument at up to ten-metre resolution with a five-day revisit (Copernicus, 2024), which sees vegetation vigour, bare soil, moisture and the spectral signatures of plant function; and Sentinel-1, a C-band radar that images through cloud and darkness (Copernicus), which reads structure in any weather. All Copernicus Sentinel data are, by EU law, free, full and open (Copernicus and EU, 2013), which is why a continuous condition history can be reconstructed for any field in the coverage at no data cost. The engine fuses those satellites with other open datasets, each chosen to inform one of the flows: ERA5 climate reanalysis for water balance, NASADEM for terrain, ISRIC SoilGrids for soil properties, GEDI lidar and PALSAR-2 radar for canopy structure, and MODIS gross primary productivity for an independent read on photosynthesis. No single sensor sees ecosystem condition. The skill is in the fusion, and in holding all of it together for every ten-metre block across every week for years, which is exactly the kind of work an engine does well and a person cannot do at scale.
Two pieces of engineering turn that fused signal from a clever picture into a trustworthy measurement. The first is weather correction. A wet summer makes almost any field look greener; a drought makes a well-managed field look as though it is failing. An honest condition score separates the effect of the season from the effect of the management, so a high score reflects how the land is being looked after rather than how kind the year was. This is what makes scores comparable across years and places. The second is local referencing. Condition is always condition relative to potential, as the SEEA insists. The engine scores every site against the healthy reference state for its own ecoregion and land type, so a hill farm is judged against what that hill could be, not against a universal ideal it could never reach. There is one more piece of honesty: not all land is grassland, so the engine runs two scoring tracks. Open land is scored by an ensemble of models calibrated against field data; woodland and agroforestry are scored on a separate reference-state track that compares each stand to the expected condition for its own kind of forest. A wood is judged as a wood, not as a degraded field.
From EHI to EDX: turning the science into a score
From the fused, weather-corrected, locally-referenced signal, the engine computes the four ecosystem flows as four indices, each from 0 to 100 for every field. The four combine into the Ecological Health Index, the EHI, scored as the site’s departure from the healthy reference state for its ecoregion. The EHI is the scientifically precise number, and it is not the number a land manager wants to be handed: it runs on a researcher’s scale, not a steward’s. So the engine performs one more transformation, the step that turns a research instrument into something a farmer, a lender or a regulator can use. It normalises the EHI onto a 0 to 100 scale and bands it into the EcoDynamic Index, the EDX: a 1 to 9 scale, ascending, that is the Land Health Score in plain language.
| EDX band | Name | Meaning, in brief |
|---|---|---|
| 9 | Flourishing | Functioning near the natural potential of its type; resilient and improving |
| 8 | Thriving | Strong, self-reinforcing function across all four flows |
| 7 | Healthy | Good function with minor seasonal limitations |
| 6 | Recovering | Cycles mostly working; a recovery trajectory underway but incomplete |
| 5 | Transitional | Some flows holding, others leaking; management decides the direction |
| 4 | Stressed | Function weakening; the last easy point to intervene |
| 3 | Degraded | Cycles faltering; approaching unviability |
| 2 | Depleted | Severe leakage of water, minerals and structure; near collapse |
| 1 | Collapsed | Function broken across the board |
One is Collapsed, nine is Flourishing. It works like a Beaufort scale for land: a readable label for a complicated reality, where everyone can agree what a force-nine gale looks like without reading the wind-speed table underneath. The science is in the EHI. The legibility is in the EDX. And EcoDynamic is the right word, because the index is not a still photograph: the engine runs the digital twin through time, so the Land Health Score arrives with eight years of history and a direction of travel, and the four flow indices sit underneath the headline so that a field reading Transitional can be opened up to show which flow is holding it back. That is the difference between a grade and a diagnosis.
Why the Land Health Score is a measure of ecosystem condition
Now put the two halves side by side, the regulatory definition of condition and the engineering of the Land Health Score, and the case makes itself. Recall what the SEEA, and therefore TNFD and ESRS E4, mean by condition: the quality of an ecosystem, scored against an ecosystem-type-specific reference bounded by collapse and natural integrity, across its abiotic, biotic and landscape characteristics. Set the Land Health Score against the SEEA’s six condition characteristics, class by class.
| SEEA ecosystem condition characteristic | How the Land Health Score reads it |
|---|---|
| Physical state (abiotic) | Water Cycle index and terrain context: infiltration, surface moisture, slope, the movement of water |
| Chemical state (abiotic) | Mineral Cycle index: nutrient availability and cycling, read through vegetation and soil signals |
| Compositional state (biotic) | Community Dynamics index, as a structural-diversity proxy, never a species count |
| Structural state (biotic) | Energy Flow index plus biomass and canopy structure from optical, radar and lidar |
| Functional state (biotic) | All four flows, which are by definition functional readings, plus an independent productivity check |
| Landscape characteristics | Ecoregion context, terrain, and the pattern of fields and habitats across the property |
| Reference level, collapse to integrity | The EDX scale itself: 1 Collapsed to 9 Flourishing, scored against the site’s own ecoregion reference |
The fit is not approximate. The Land Health Score reads, directly, five of the SEEA’s six condition characteristic classes, and reads the sixth, composition, as a structural proxy it is careful never to overstate. More striking is the last row. The SEEA says condition should be scored on a scale from collapse to natural integrity, against a reference for each ecosystem type. The EDX is, in its bones, exactly that. EcoIntel did not reverse-engineer the SEEA; it built, from the ecological science up, an instrument that arrives independently at the same structure the world’s statisticians chose. When two roads built for different reasons meet at the same place, that place is usually worth trusting.
There is one more property the frameworks ask for that a field survey struggles to supply. ESRS E4-5 does not ask only for condition; it asks for the change in condition. TNFD frames its core metric as the change in the state of nature over time. Disclosure is fundamentally about trajectory: are you making things better or worse. Because the engine runs the twin back to 2018 and forward along each site’s path, the Land Health Score is a change metric by construction. It hands a reporting team a dated baseline they never had to collect and a direction of travel they can stand behind, for ground they may only have owned for a year. A field survey can tell you the condition of a site this season; it cannot tell you the condition of that site in 2019, because nobody surveyed it then. The satellite archive can, and did.
Report once, map to many
A single condition score is worth so much because the frameworks overlap far more than their separate names suggest. EcoIntel organises its disclosure support around a curated set of seven frameworks, and one condition assessment, done once, drops into many of them at the same time. A word on language first: everything here is support and structure, not certification. EcoIntel reporting is informed by and structured around these frameworks and helps a team prepare for them. It does not certify, assure or verify, and it does not claim conformity with any standard. Those words belong to auditors and accredited verifiers, not to a satellite.
For the nature frameworks, the Land Health Score supplies the condition half of TNFD’s state-of-nature core metric for every location surfaced by LEAP, and because it is ecoregion-referenced and dated it answers both the what-condition and the which-way-is-it-heading parts. The same score and its four-flow breakdown map onto the extent-and-condition content of ESRS E4-5, with the eight-year history covering the change the standard asks for, where ecosystem impact is material. It supports GRI 101’s requirement to describe impacts on the condition of affected ecosystems, and it gives the Science Based Targets Network the dated, ecoregion-referenced baseline it asks companies to establish. Positioned in the honest sense, a TNFD-aligned condition record is also the right foundation to be ISSB-ready as that guidance lands. The engine also produces a carbon layer, which informs the climate standards, though the carbon figures stay indicative until an accredited verifier signs them off. And geolocation to the parcel plus an eight-year, deforestation-free history speak directly to the EU Deforestation Regulation. You assess the land once, against one science-grounded definition of condition, and answer many askers from the same evidence. That is what it means to fill the box the frameworks left empty: not with a bespoke metric for each, but with one reading of condition the whole stack was, in effect, already asking for.
The honest boundary, and why it is the moat
A piece arguing that the Land Health Score is everything a nature report needs would be a worse piece, and a less trustworthy product. The most important section here is the one that says what condition is not.
Condition is not biodiversity. EcoIntel measures ecosystem function, the capacity of the land to support life, not the life itself. The fourth flow, Community Dynamics, is read as a structural-diversity proxy, never a species count. The engine cannot name the species in a hedgerow, it cannot tell you a rare beetle has arrived or a curlew has gone, and it never claims to. Naming species, and reading the composition of the living community directly, is the job of a field survey or an environmental-DNA (eDNA) sample, and nothing here replaces them. eDNA reads that one compositional facet of condition directly, where the satellite can only proxy it from how the vegetation varies. What the satellite adds, and a sample cannot, is the rest of condition read continuously: the water, energy and mineral flows and the structural and functional state, wall to wall, back to 2018. Held the right way round, the limit is a feature. A species sample, including eDNA, is a snapshot of one spot on one day; condition is the flow, whether the land is functioning, across its full extent, and which way it is heading. The two are complementary, not competing, and a continuous condition layer makes every species sample go further. It tells an ecologist where to sample, by mapping which ground is in what condition, turning blind sampling into targeted, stratified sampling. It frames each result in the habitat’s condition and trajectory. It supplies years of history the sample never had. And it lets an organisation condition-map a whole supply chain cheaply, then survey only the sites that warrant it. eDNA stays the definitive way to name species; condition makes it affordable where it counts.
The same discipline runs through every claim the product makes. EcoIntel is an ADP: a layer of Assessment, Diagnostics and Practical guidance. It is not an MRV (measurement, reporting and verification) platform, it issues no verified credits, and it hands out no pass marks. Everything it reports is indicative decision-support, and none of it is legal or financial advice. To keep that honest at the level of individual claims, EcoIntel uses a deliberate status vocabulary rather than a blanket green tick: a data point is Evidenced when the satellite proves it, Positioned when the approach is aligned but the metric is still maturing, Baseline when it needs the client’s attestation, and Documented when the client has attested it. Gains and losses are shown side by side rather than netted into one flattering figure. There is no nature-positive stamp, because no remote instrument can honestly hand one out.
This is not modesty for its own sake. The frameworks themselves reward exactly this kind of candour: both TNFD and ESRS treat an honest “material, but not yet fully measured, and here is the plan” as a legitimate answer. In a market with a strong pull towards confident green badges, a tool that marks its own boundary is the one that survives the people paid to find the overstatement: the assurance partner, the watchdog, the procurement team working through the evidence line by line. Credibility is the scarce commodity in nature reporting, and the boundary is where you earn it. It is the most valuable thing the product owns. EcoIntel sits within the wider field of nature-from-space work rather than apart from it, and its particular place is specific: a condition metric, not a species tool, built on the four ecosystem flows and a peer-reviewed index rather than imagery alone, weather-corrected and ecoregion-referenced so scores mean the same thing across sites and years, retrospective to 2018, and priced to run on every parcel of a supply chain rather than only on flagship sites. Most satellite work in nature reporting answers extent-and-context questions: how much habitat there is, what the land cover is, how close a site sits to a protected area. That layer matters, and it is not condition. Reading whether the habitat is functioning, from the four flows against a local reference, is the step beyond the extent-and-context map, and it is the step the frameworks leave open.
Does it work, and who pays
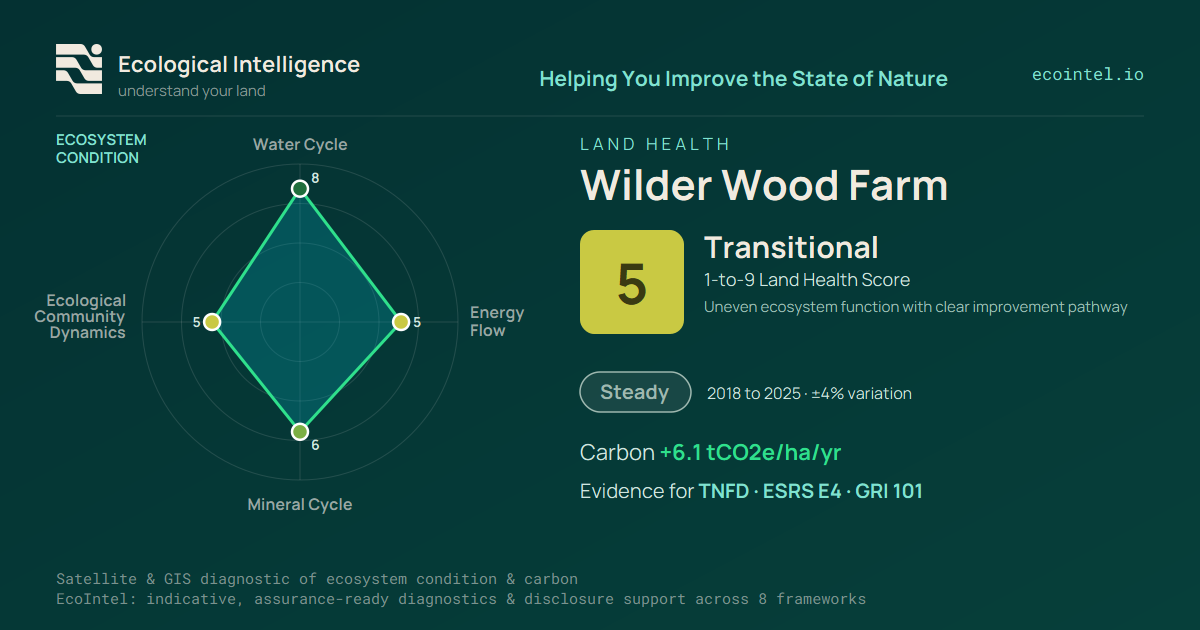
A number is only as good as its validation, and condition assessment has a long history of plausible indices that fell apart against ground truth. EcoIntel calibrates the Land Health Score against EOV field data collected by trained assessors. On the primary calibration farm, tested by leave-one-out cross-validation, the satellite read tracks the field score with a correlation of about 0.79, and the Land Health Score lands within one band of the field assessment about eighty-nine per cent of the time. The harder test is transfer: checked against a second, independent farm the engine had never seen, the rank order held strongly, with a correlation of around 0.87. That is the result that matters most, because it shows the instrument is reading ecological reality rather than echoing a single dataset. The carbon layer, separately, is cross-checked against more than a dozen independent authoritative datasets. None of this makes the Land Health Score a verified instrument in the audit sense, and EcoIntel does not call it one. It makes it a calibrated, cross-validated, honestly-bounded read of ecosystem condition, which is precisely what the frameworks ask for and what has been missing. To see the shape of a real read, the public demonstration site, Wilder Wood Farm, resolves from satellite alone, with no site visit, as 175 hectares across 44 fields, sitting mid-scale at a Land Health Score of 5, Transitional, holding broadly steady across eight years, with Community Dynamics the weakest of its four flows.
A condition layer also settles a question that often goes unasked: who pays for the data, and why the price splits the way it does. The obligation and the data sit at opposite ends of the same chain. The duty is up-chain, with the corporate buyer who carries the mandatory reporting under the CSRD and the ISSB, and who needs aggregation across many suppliers and the machinery of assurance-readiness. The data is down-chain, on the farm, whose own reporting is still voluntary but whose buyer asks for it more insistently every season, and for whom the value is ease: handing over the credential the chain wants alongside an agronomic read worth having regardless. The entry point is deliberately low. The single-site Land Health System is priced at £600 a year standard, or £300 on the founding-member rate, or £55 a month, as advertised in 2026. For around the cost of a single eDNA sample or field visit, a property gets a year of continuous, wall-to-wall, retrospective condition, and the engine’s marginal cost for the next site or year is close to nothing. EcoIntel is live and already in use in the UK and Italy.
The box, and the number
Nature disclosure has assembled itself at remarkable speed. The frameworks are real, the obligations are landing, and they share a clear architecture: report the extent and condition of the ecosystems you affect, against a reference, over time. The piece still missing, in 2026, is an agreed and affordable way to answer the central question they all ask and none defines: is this ecosystem in good condition, and which way is it heading?
The answer is older and better-founded than it might appear. It runs from a forty-year science of ecosystem health, through the four ecosystem processes that decide whether land works, through a peer-reviewed index that scores them against a local reference, to an engine that reads all of it from open satellite data and turns it into a single, weather-corrected, time-aware number. The Ecological Health Index is the science. The EcoDynamic Index is that science made legible: the 1 to 9 Land Health Score, Collapsed to Flourishing, for every parcel, every year, back to 2018, anywhere, without anyone setting foot on the ground. The frameworks supply the box. The science supplies the meaning. EcoIntel supplies the number, and the boundary around it.
Related reading
- Ecosystem Condition: Nature Disclosure’s Missing Metric: the short version of the gap this piece fills in full
- How EcoIntel makes eDNA truly powerful: why a condition layer and species sampling are complementary, not competing
- Why we are not an MRV platform: the diagnostic layer beneath verification, and why an ADP is the honest category
- Leading vs Lagging Indicators: why function turns before the species list and the carbon stock do
- Land Health Score, Ecosystem condition, Nature condition and Nature-condition metric: the definitions behind the argument
References
Frameworks and standards
- United Nations (2021). System of Environmental-Economic Accounting, Ecosystem Accounting (SEEA EA), adopted as an international statistical standard. seea.un.org/ecosystem-accounting; full document here
- Czúcz, B. et al. / UN SEEA (2021). A common typology for ecosystem characteristics and ecosystem condition variables. One Ecosystem. oneecosystem.pensoft.net/article/58218
- TNFD (2026). Discussion paper on the measurement of the state of nature. Link
- TNFD (2023). The LEAP approach (Locate, Evaluate, Assess, Prepare). framework.tnfd.global
- European Commission (2023). Commission Delegated Regulation (EU) 2023/2772, ESRS E4 Biodiversity and Ecosystems (E4-5). eur-lex.europa.eu
- Global Reporting Initiative (2024). GRI 101: Biodiversity 2024 (effective 1 January 2026). globalreporting.org
- Convention on Biological Diversity (2022). Kunming-Montreal Global Biodiversity Framework, Goal A. cbd.int/gbf
- Nature Positive Initiative (2025). State of Nature Metrics: the four indicators. naturepositive.org
- Science Based Targets Network (2020). Science-Based Targets for Nature: Initial Guidance for Business. sciencebasedtargetsnetwork.org
The science of ecosystem health and condition
- Rapport, D.J., Regier, H.A. and Hutchinson, T.C. (1985). Ecosystem behavior under stress. The American Naturalist, 125(5), 617-640. doi.org/10.1086/284368
- Costanza, R. and Mageau, M. (1999). What is a healthy ecosystem? Aquatic Ecology, 33(1), 105-115. doi.org/10.1023/A:1009930313242
- Li, Y. et al. (2013). Vigor, organization, and resilience (VOR) for assessing rangeland health. EcoHealth, 10(4). doi.org/10.1007/s10393-013-0877-8
- Xu, S., Rowntree, J., Borrelli, P., Hodbod, J. and Raven, M.R. (2019). Ecological Health Index. Environments, 6(6), 67. doi.org/10.3390/environments6060067
- Savory Institute (2018). Ecological Outcome Verification (EOV), Version 1.0. savory.global
- Savory Institute. Holistic Management: the four ecosystem processes. savory.global/holistic-management
Remote sensing and the data behind the engine
- Li, Z., Xu, D. and Guo, X. (2014). Remote sensing of ecosystem health. Sensors, 14(11). PMC4279526
- European Space Agency / Copernicus. Sentinel-2 mission. dataspace.copernicus.eu
- European Space Agency / Copernicus. Sentinel-1 mission. dataspace.copernicus.eu
- European Commission / Copernicus (2013). Free, full and open data policy. copernicus.eu
Framework facts are stated as of 2026 and will move as the standards mature. This piece is decision-support and explanation, not legal, financial or compliance advice. EcoIntel is an ADP (Assessment, Diagnostics and Practical guidance), not an MRV platform; the Land Health Score is an indicative measure of ecosystem condition and is not a verified, assured or certified figure, and is not a measure of species or biodiversity.
Frequently asked
What is ecosystem condition?
Ecosystem condition is the quality of an ecosystem measured through its abiotic and biotic characteristics. The definition comes from the UN System of Environmental-Economic Accounting (SEEA), adopted as an international statistical standard in 2021. To turn that quality into a comparable score, the SEEA sets it against a reference level for the ecosystem type, so a site is judged against what its own kind of ecosystem could be. Condition is distinct from extent: extent is how much habitat there is, condition is whether that habitat is functioning. It is scored on a scale running from collapse at the bottom to natural integrity at the top.
How is ecosystem condition measured?
Condition is measured by reading an ecosystem's physical, chemical, compositional, structural and functional characteristics against the reference state for its type. Traditionally this means field assessment by a trained ecologist, which is rich but expensive, point-in-time and impossible to run on every parcel every year. EcoIntel measures it instead from open satellite data: it reads four ecosystem flows (water, energy, minerals and community dynamics), weather-corrects them, scores them against each site's ecoregion reference, and reports the result as a Land Health Score from 1 to 9 for every parcel, every year, back to 2018.
What is the difference between ecosystem condition and ecosystem extent?
Extent is the size of an ecosystem asset, the acreage. Condition is the quality of those acres, whether the system is functioning, recovering or failing. Most nature-disclosure frameworks ask for both, and condition is by far the harder of the two to measure. Counting hectares is straightforward; judging whether those hectares are working, and which way they are heading, is the part that needs a condition metric.
Is ecosystem condition the same as biodiversity?
No. Condition measures the functioning of an ecosystem, its capacity to support life. Biodiversity is the variety of life present, typically a species count. The two are related but not the same: a simplified system can still function for a while, and a diverse one can still be in decline. EcoIntel measures condition, not species. Naming species is the job of a field survey or an environmental-DNA sample, and a continuous condition layer makes that sampling go further.
Does TNFD require ecosystem condition?
TNFD names the level of ecosystem condition by type of ecosystem as a core metric for the state of nature, alongside ecosystem extent and species risk. It deliberately does not specify a single metric, stating that no one measure captures every dimension and that a consensus is still developing. GRI 101 requires condition to be reported and ESRS E4 under the CSRD makes it an optional datapoint, and both leave open which metric to use. EcoIntel's Land Health Score is built to fill that gap.
What is the Land Health Score?
The Land Health Score is EcoIntel's headline measure of ecosystem condition: a scale from 1 (Collapsed) to 9 (Flourishing), scored against the healthy reference state for the land's own ecoregion, and built from four ecosystem flows. It works like a Beaufort scale for land, a readable label for a complex reality. Beneath it sit the Ecological Health Index (the peer-reviewed science) and the EcoDynamic Index (the legible 1 to 9 banding). It is indicative decision-support, not a verified, assured or certified figure.
What is the difference between the EHI and the EDX?
The Ecological Health Index (EHI) is the scientifically precise number: a peer-reviewed index that scores the four ecosystem flows against a reference state, on a wide researcher's scale. The EcoDynamic Index (EDX) is that same science made legible: the EHI normalised and banded onto a 1 to 9 scale, Collapsed to Flourishing. The EHI is the science; the EDX is the Land Health Score in plain language.
What is an ecosystem-condition metric?
An ecosystem-condition metric is a defensible number for the condition, the functional quality, of an ecosystem, scored against a reference and tracked over time. It is the figure the nature-disclosure frameworks ask preparers to report as part of the state of nature, and decline to define. EcoIntel supplies one: a satellite-derived, weather-corrected, ecoregion-referenced Land Health Score, with an eight-year history and a direction of travel for every parcel.