Product
The Land Health System
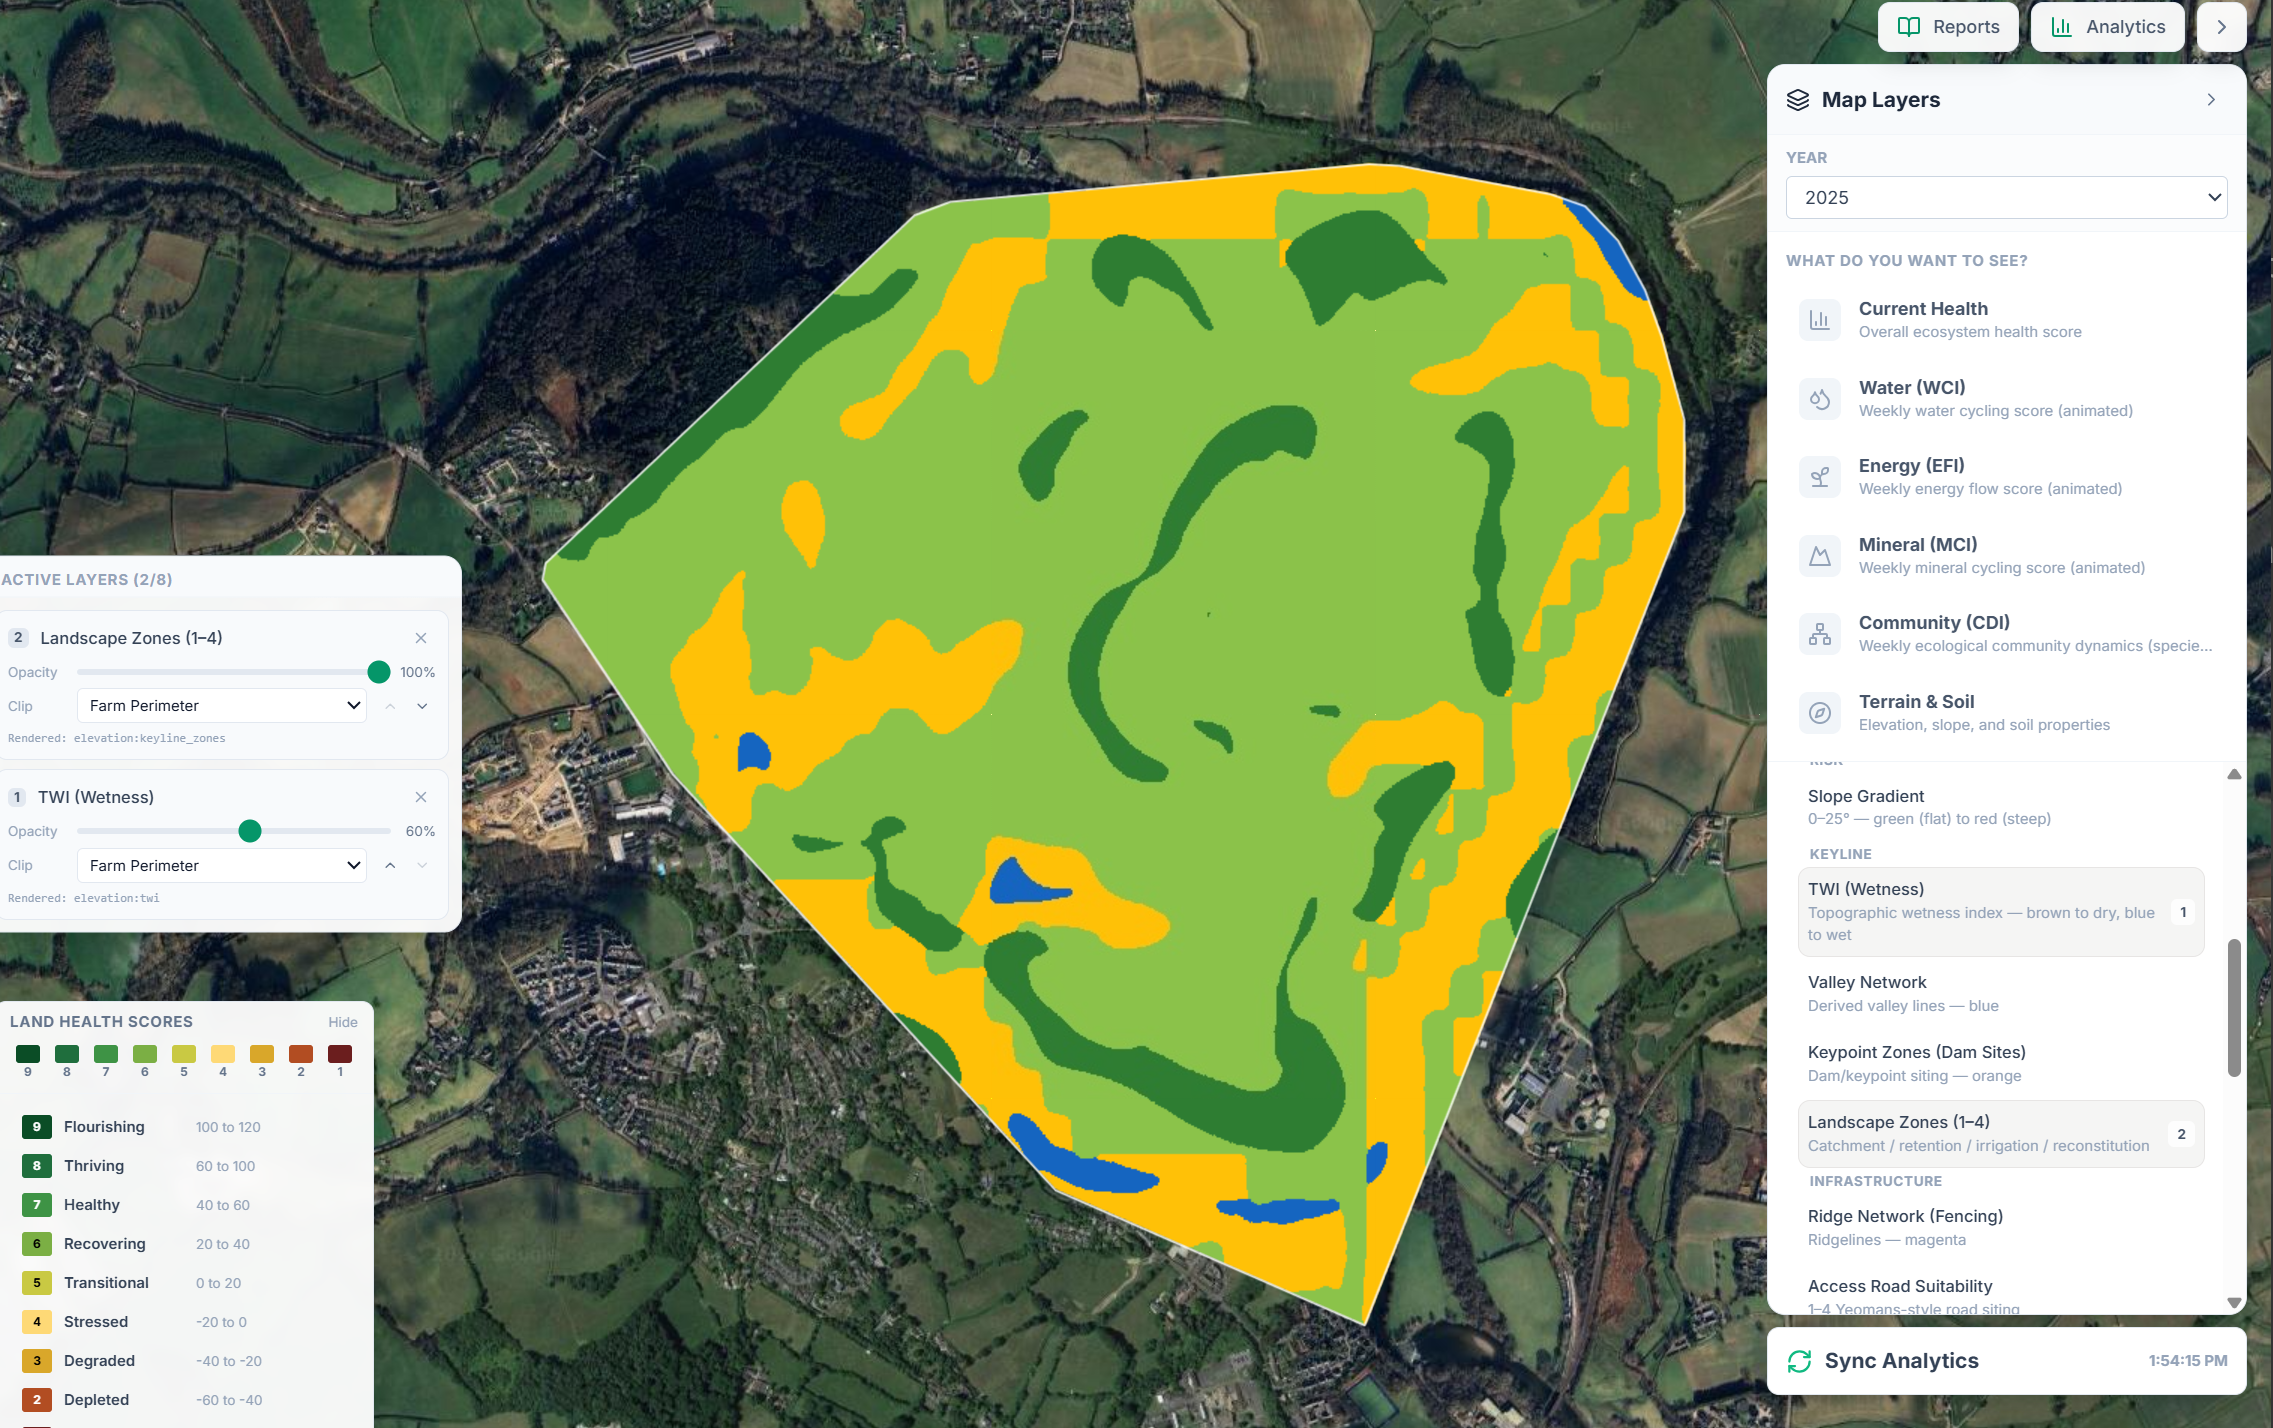
Structured, continuous ecological intelligence: field → farm → landscape.
Earth-observation and other data, translated by our EcoDynamics Engine into a process-based ecosystem performance management system.
The four pillars
-
Continuous monitoring
Assess
Ecological performance scored on the Land Health Score: a nine-level scale, field-by-field, with historical data back to 2018.
-
Decision support
Diagnose
Process-based diagnosis across the four primary ecosystem processes (energy, water, mineral, community) that underpin all life on earth.
-
Practical guidance
Act
Goal-dependent decision support, agnostic to management approach. Quick wins, strategic investments, ecosystem-service indicators, risk and opportunity.
-
Framework-aligned
Report
One analysis aligned with multiple disclosure frameworks. TNFD LEAP, CSRD/ESRS E4 & E1, GHG Protocol, ISO 14064-2.
What the system delivers
Three headline elements sit behind the four pillars: what makes the Land Health System useful in practice, on this land, in this place, this season.
1. An objective, independent assessment of the land's ecological performance, scored in a continuous time-series, field-by-field, in every season. What the land has actually done, not what anyone has claimed about it. The historical record reaches back to 2018, so every parcel arrives with a multi-year scored history attached.
2. A credible, easily understandable diagnosis of why the land is performing the way it is. Four diagnostic layers build the picture: context (physics, topography, ecoregion, climate), water cycle (where and how water flows), living systems (biology and functional diversity across weeks and seasons), and carbon & productivity (the carbon-based cashflow statement of the land-based economy).
3. Practical, actionable insights and advice for better outcomes: matched to the on-the-ground reality of each field and to the scale of ambition for the land, whether the destination is regeneration, recovery or restoration.
All three sit on top of a structured report suite: two packages, six possible deliverables. See the full report suite →
The Land Health Score
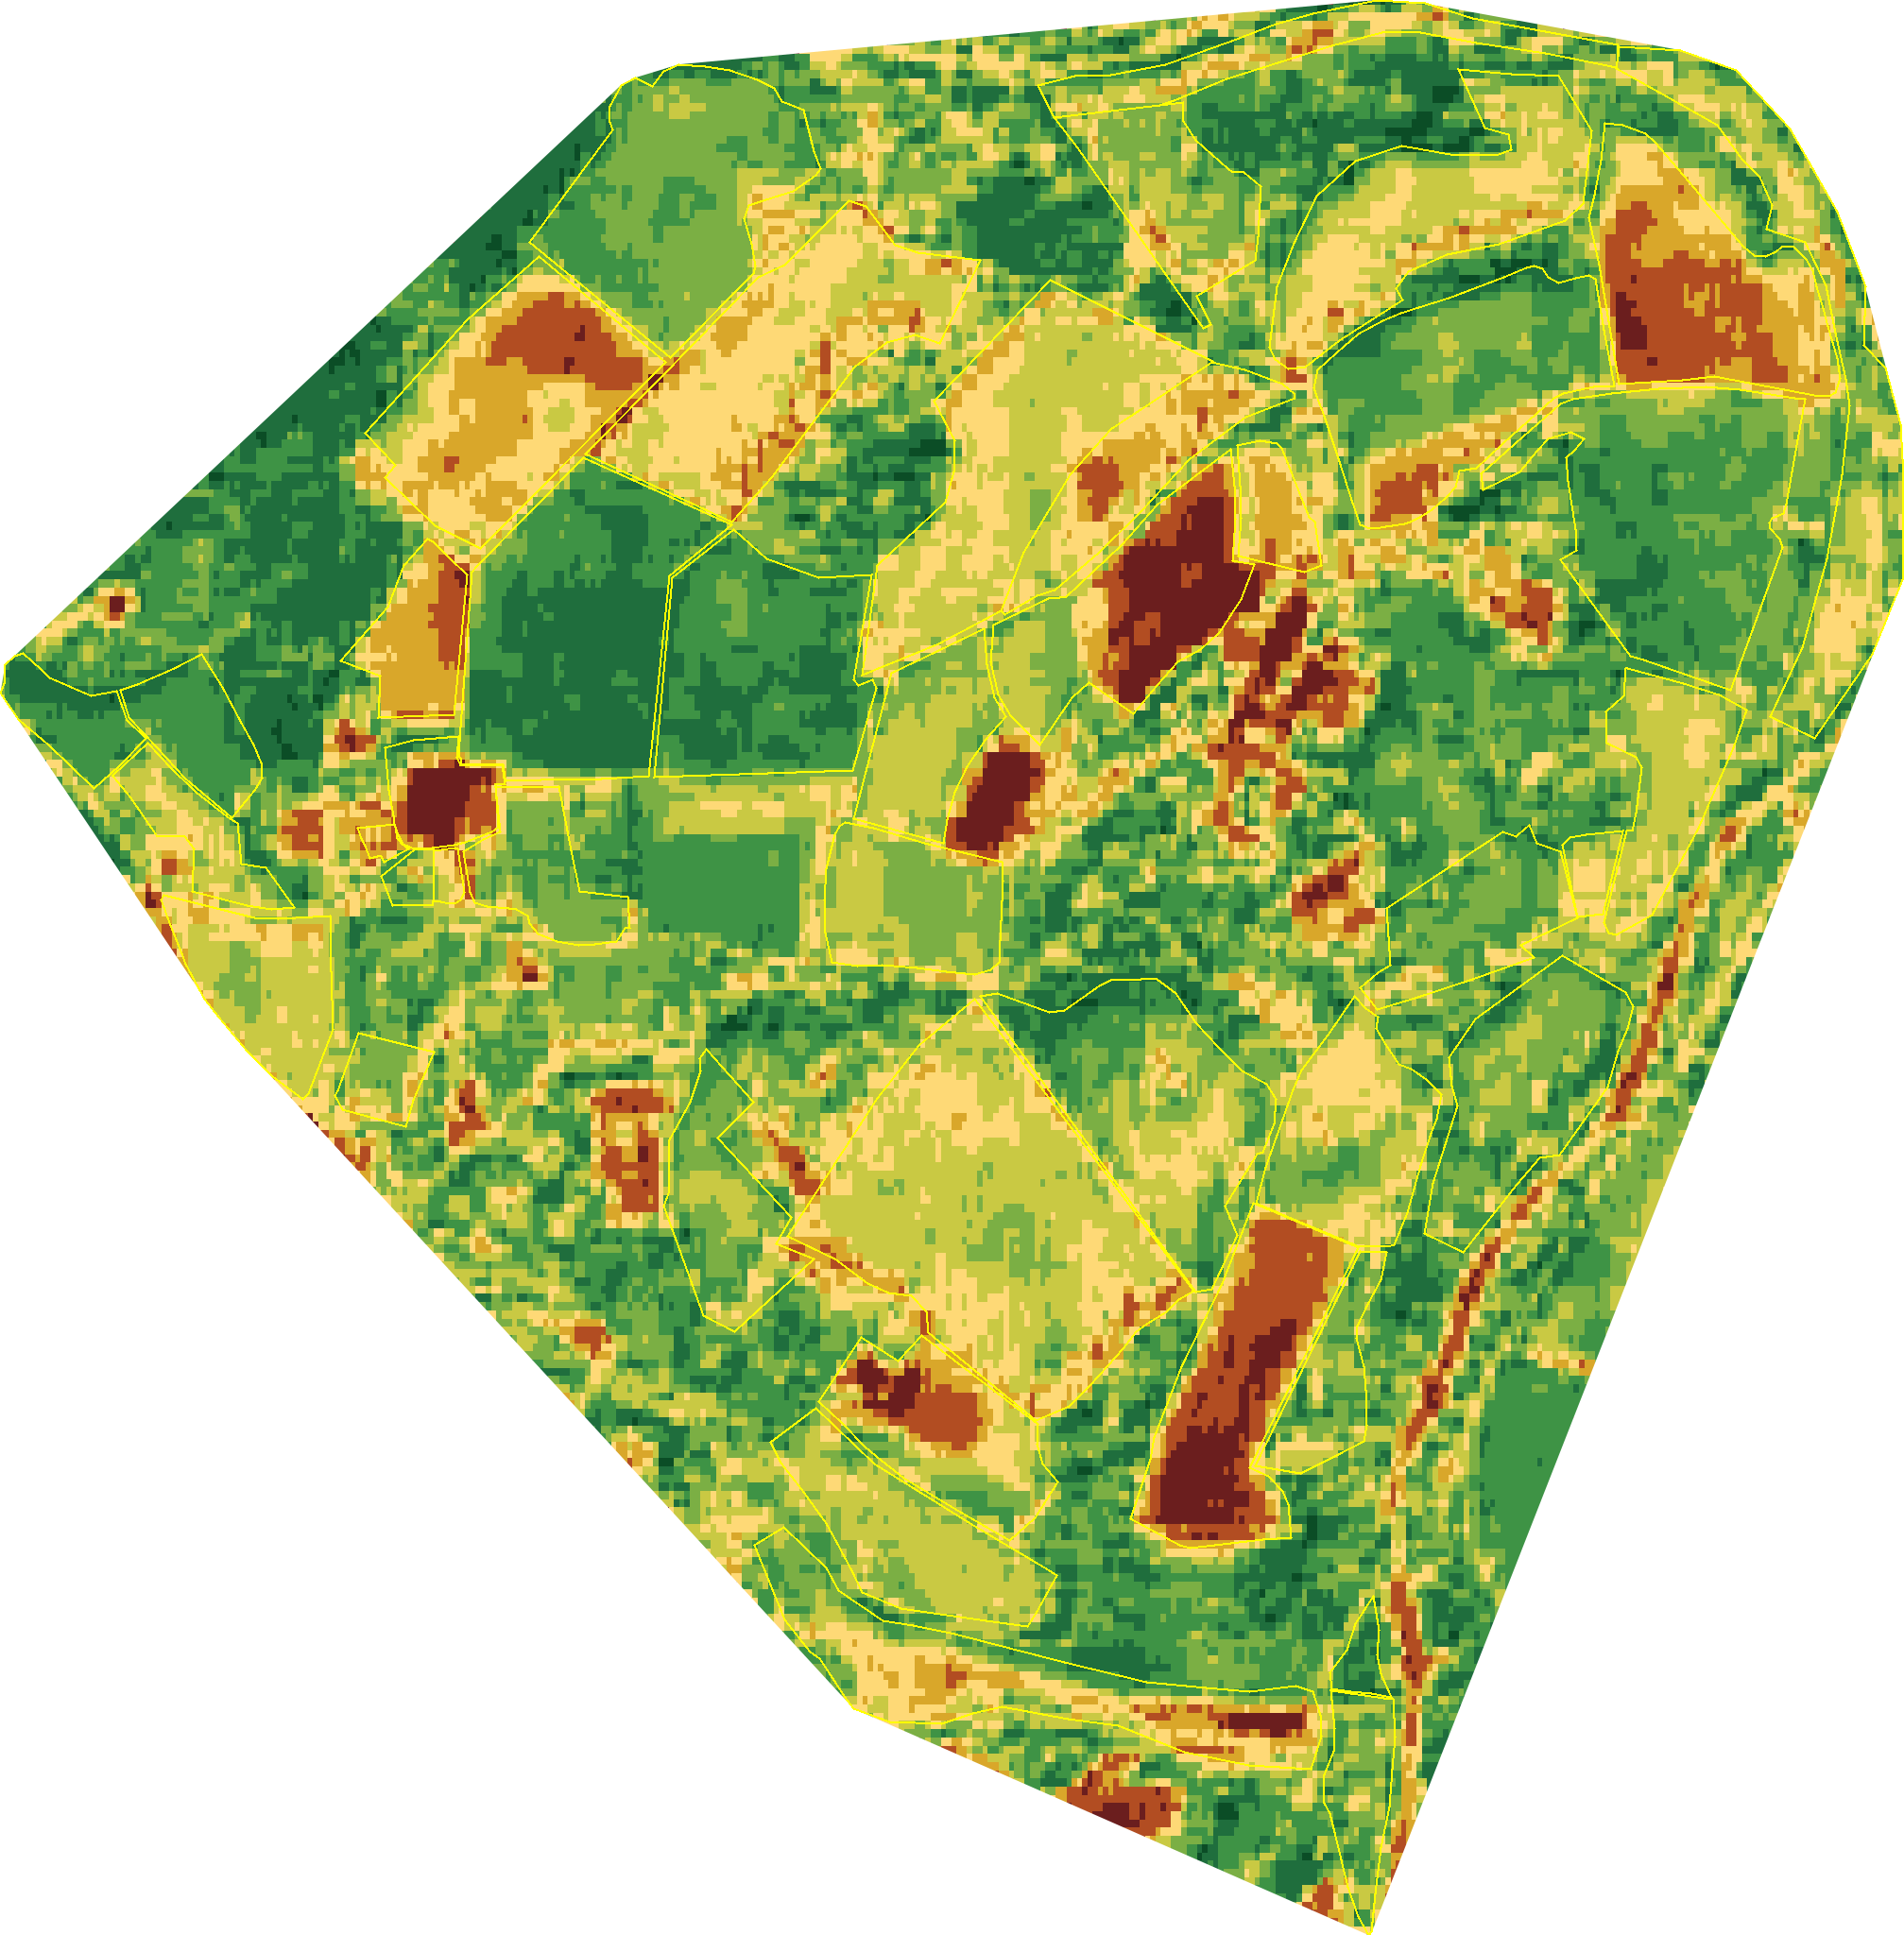
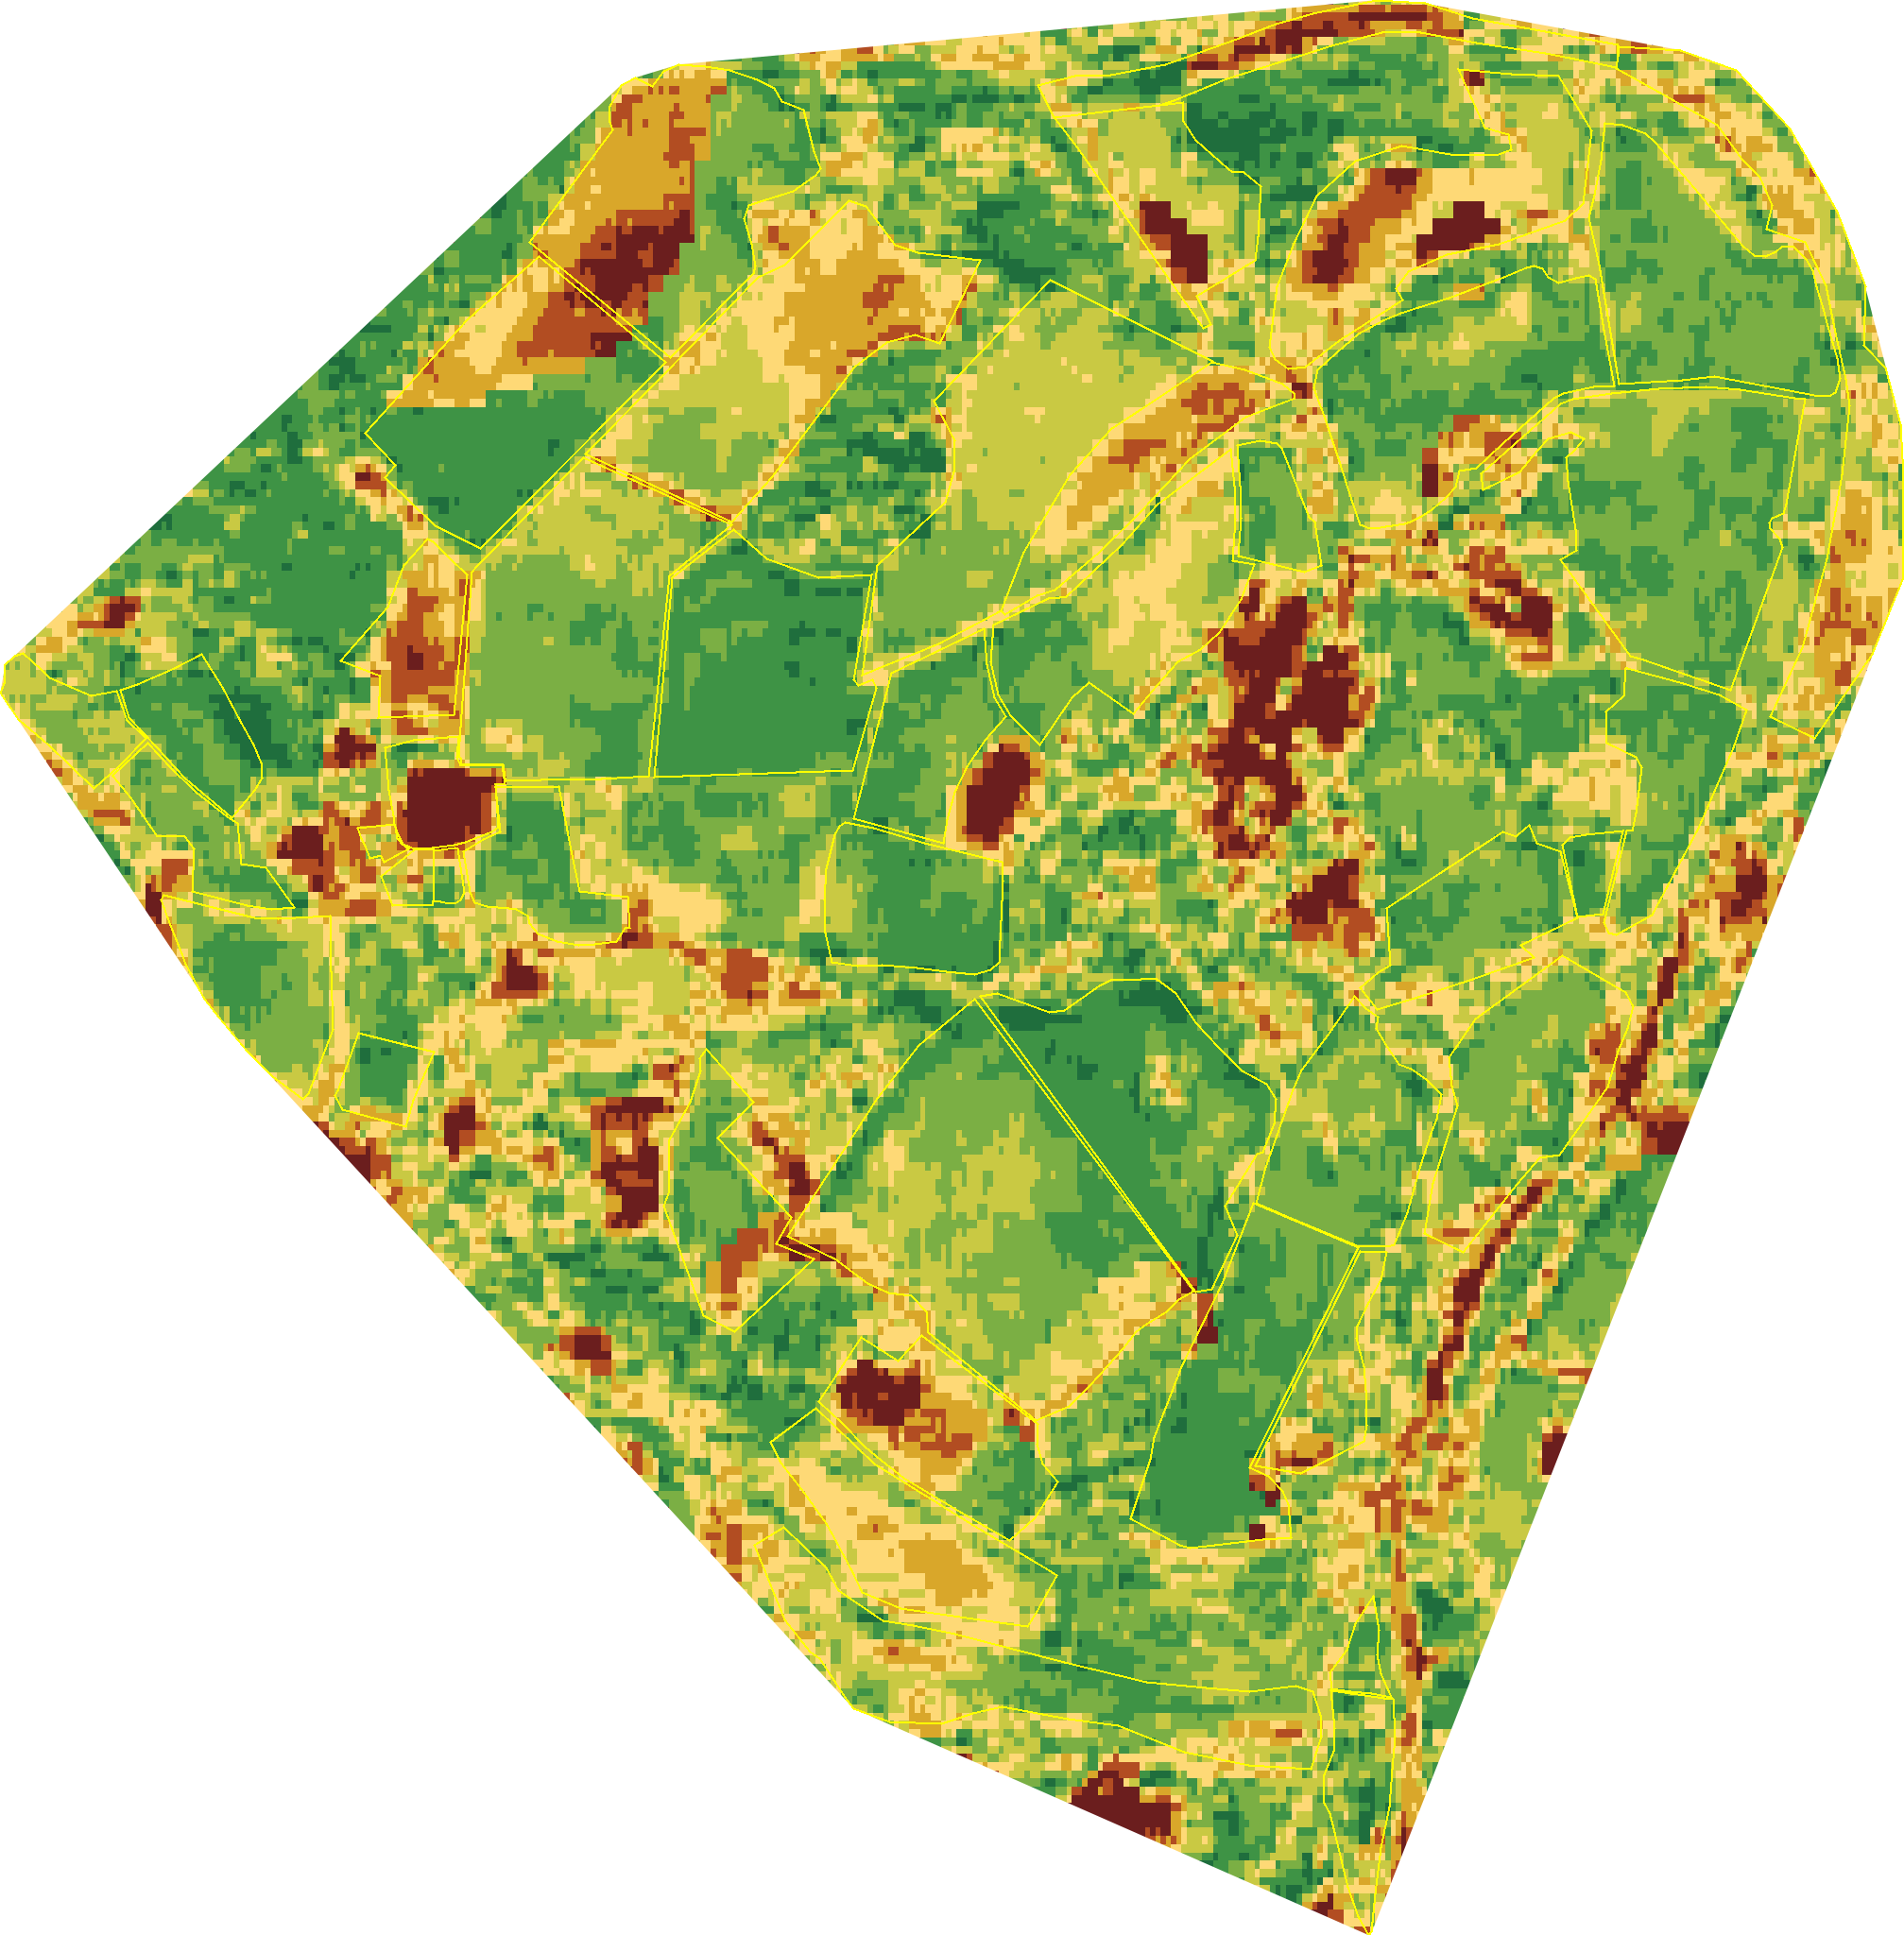
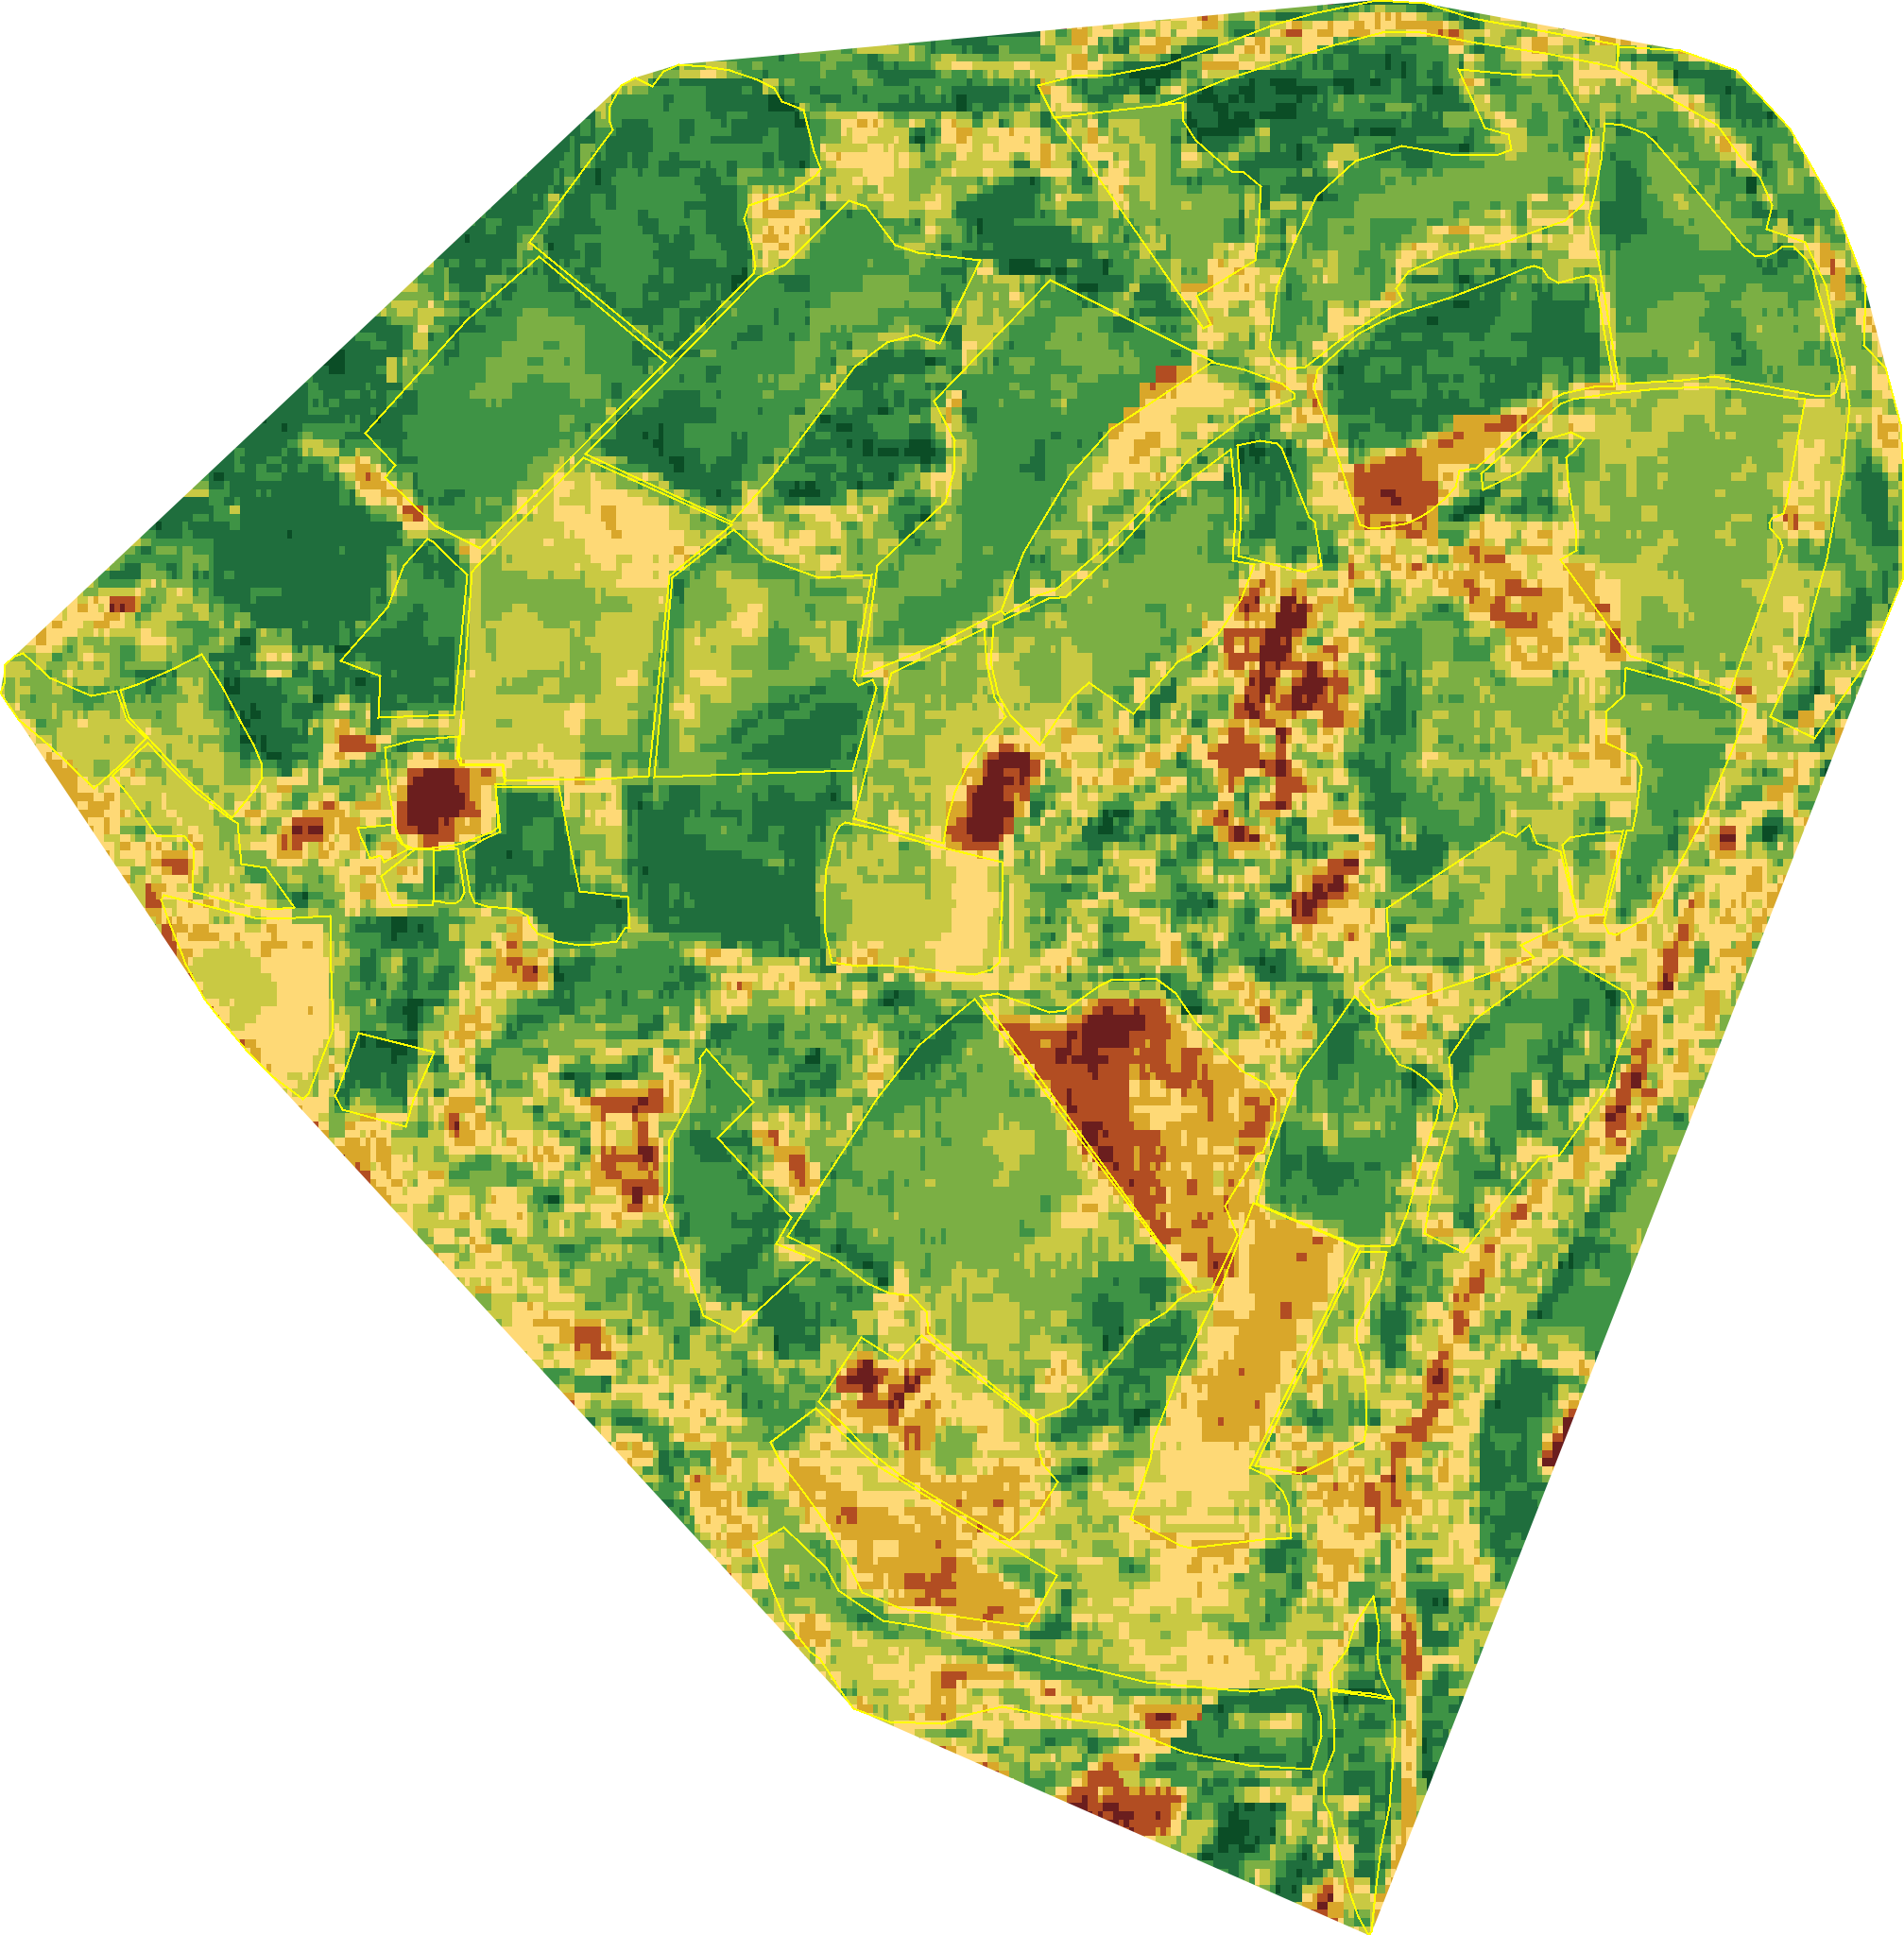
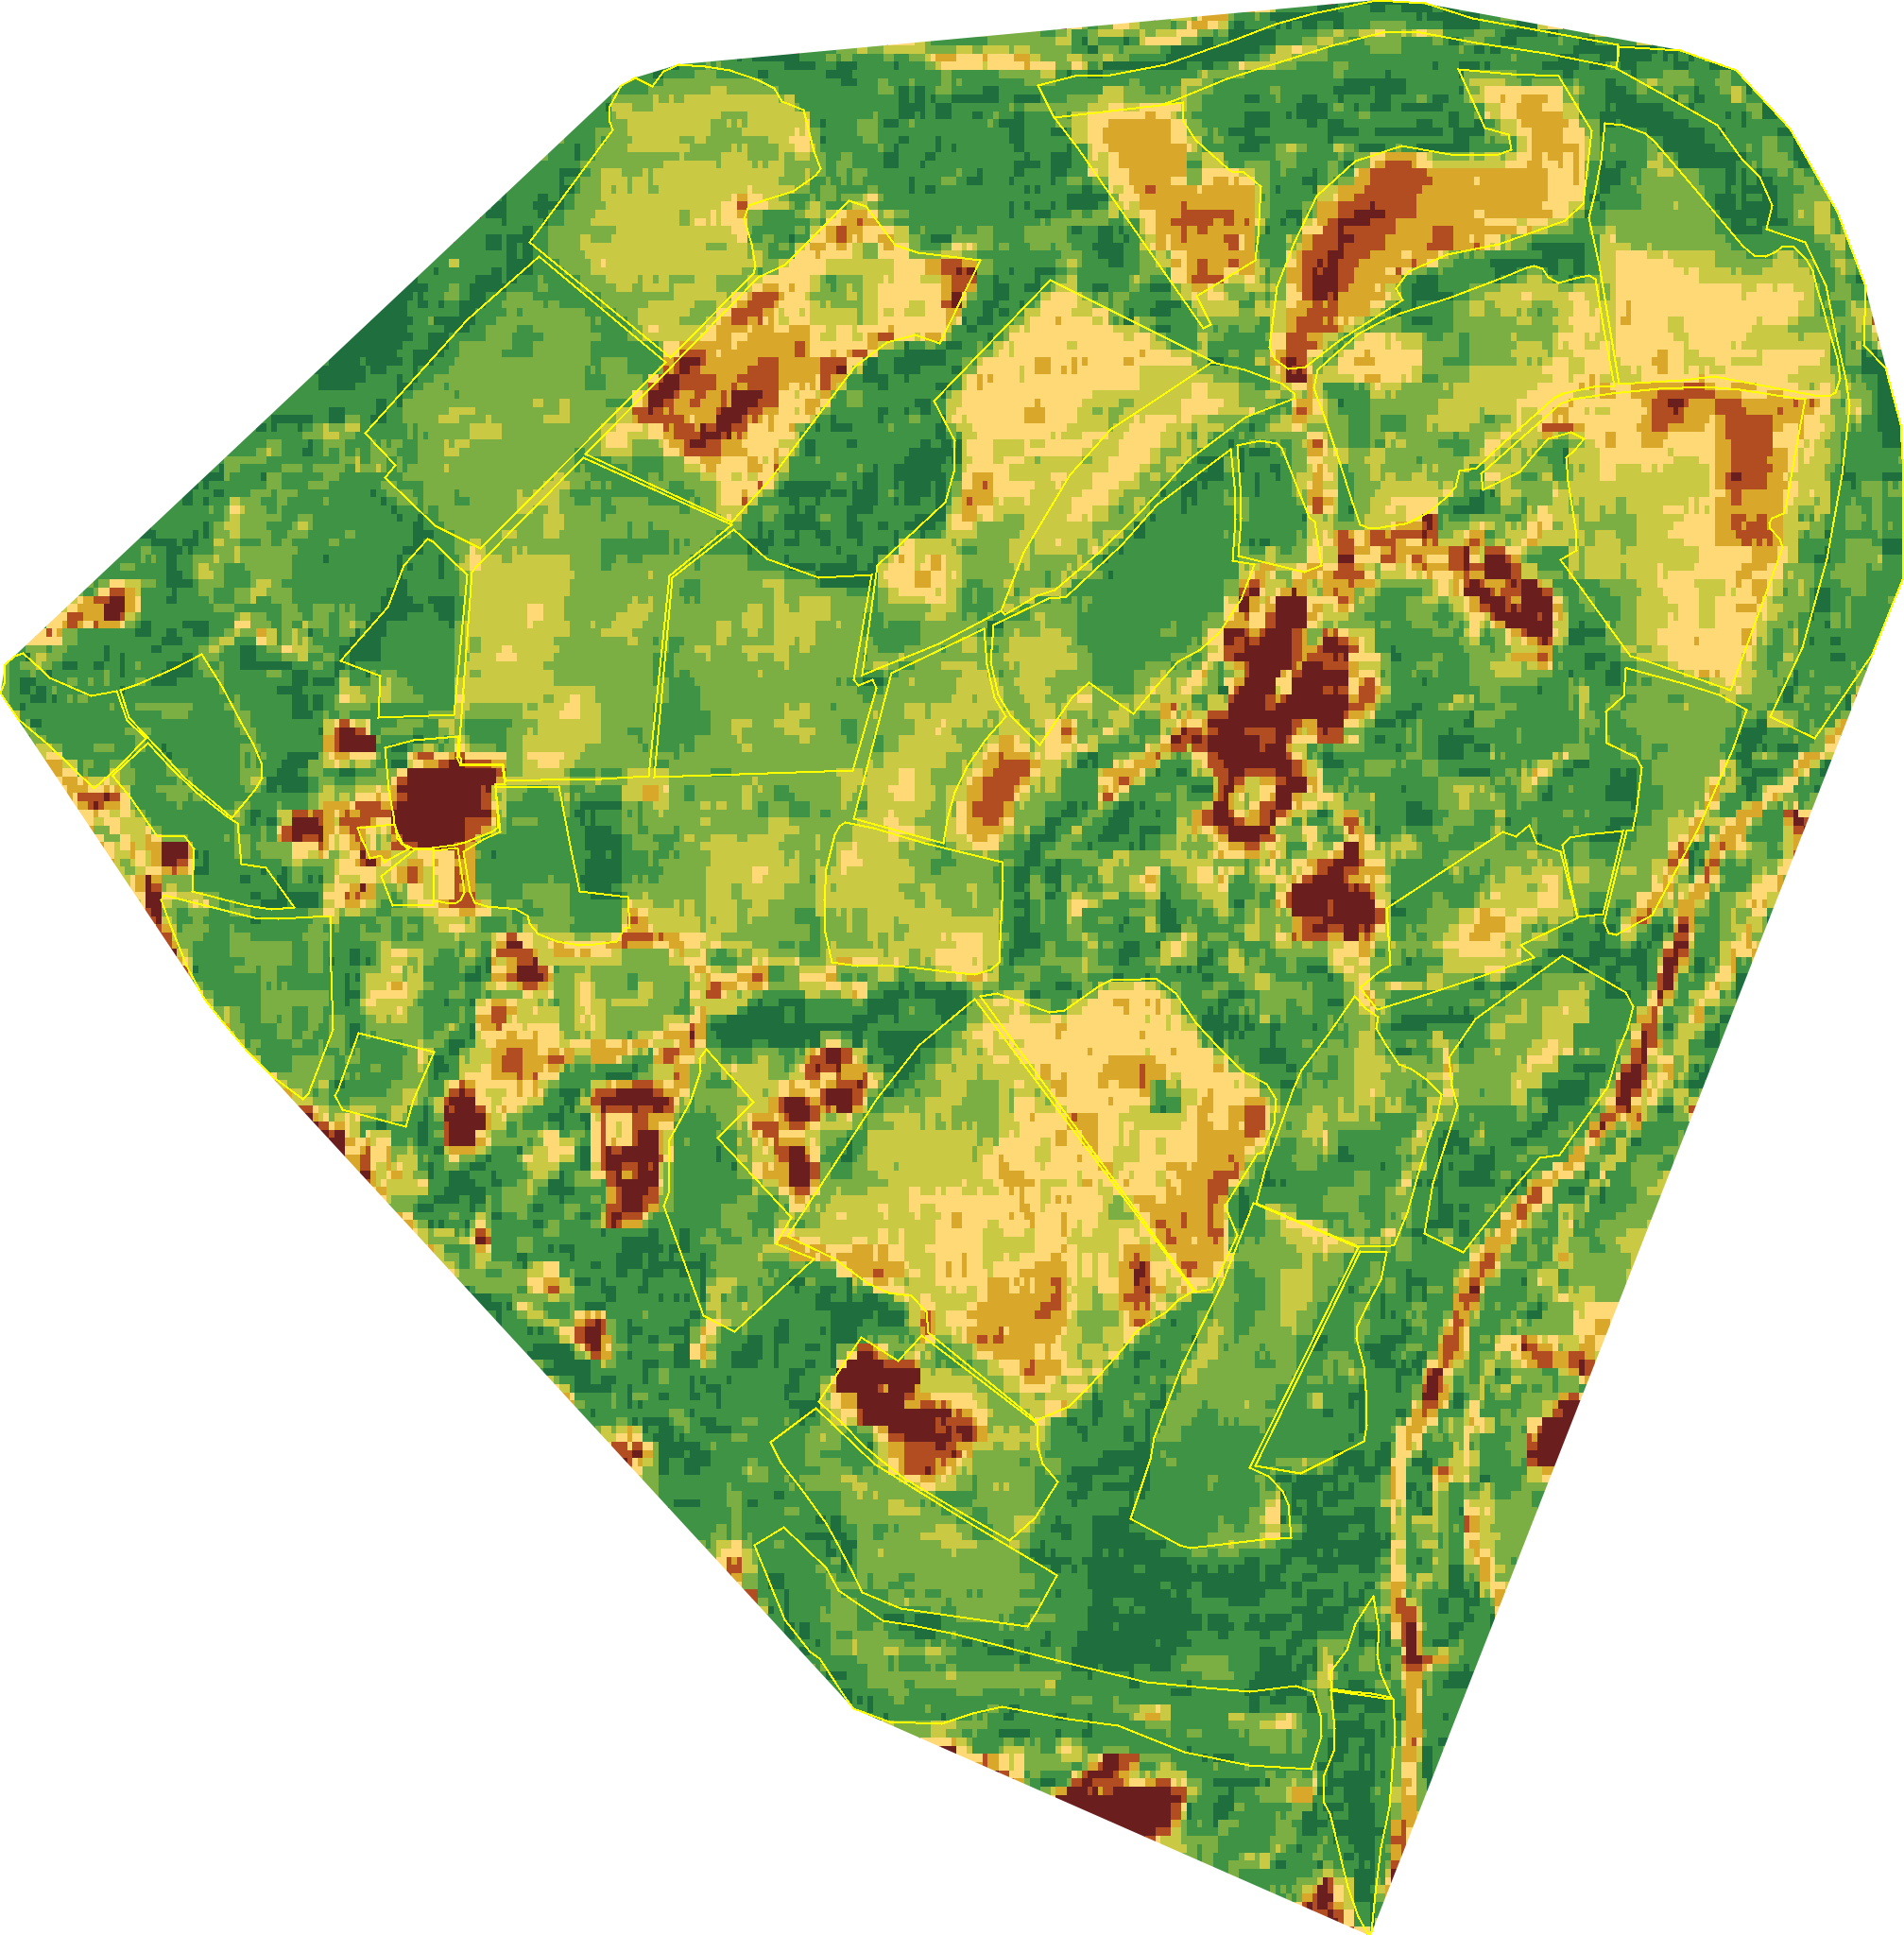
A Beaufort Scale for ecological health. A nine-level scale that communicates the condition of any piece of land, in any season, anywhere we have satellite coverage.
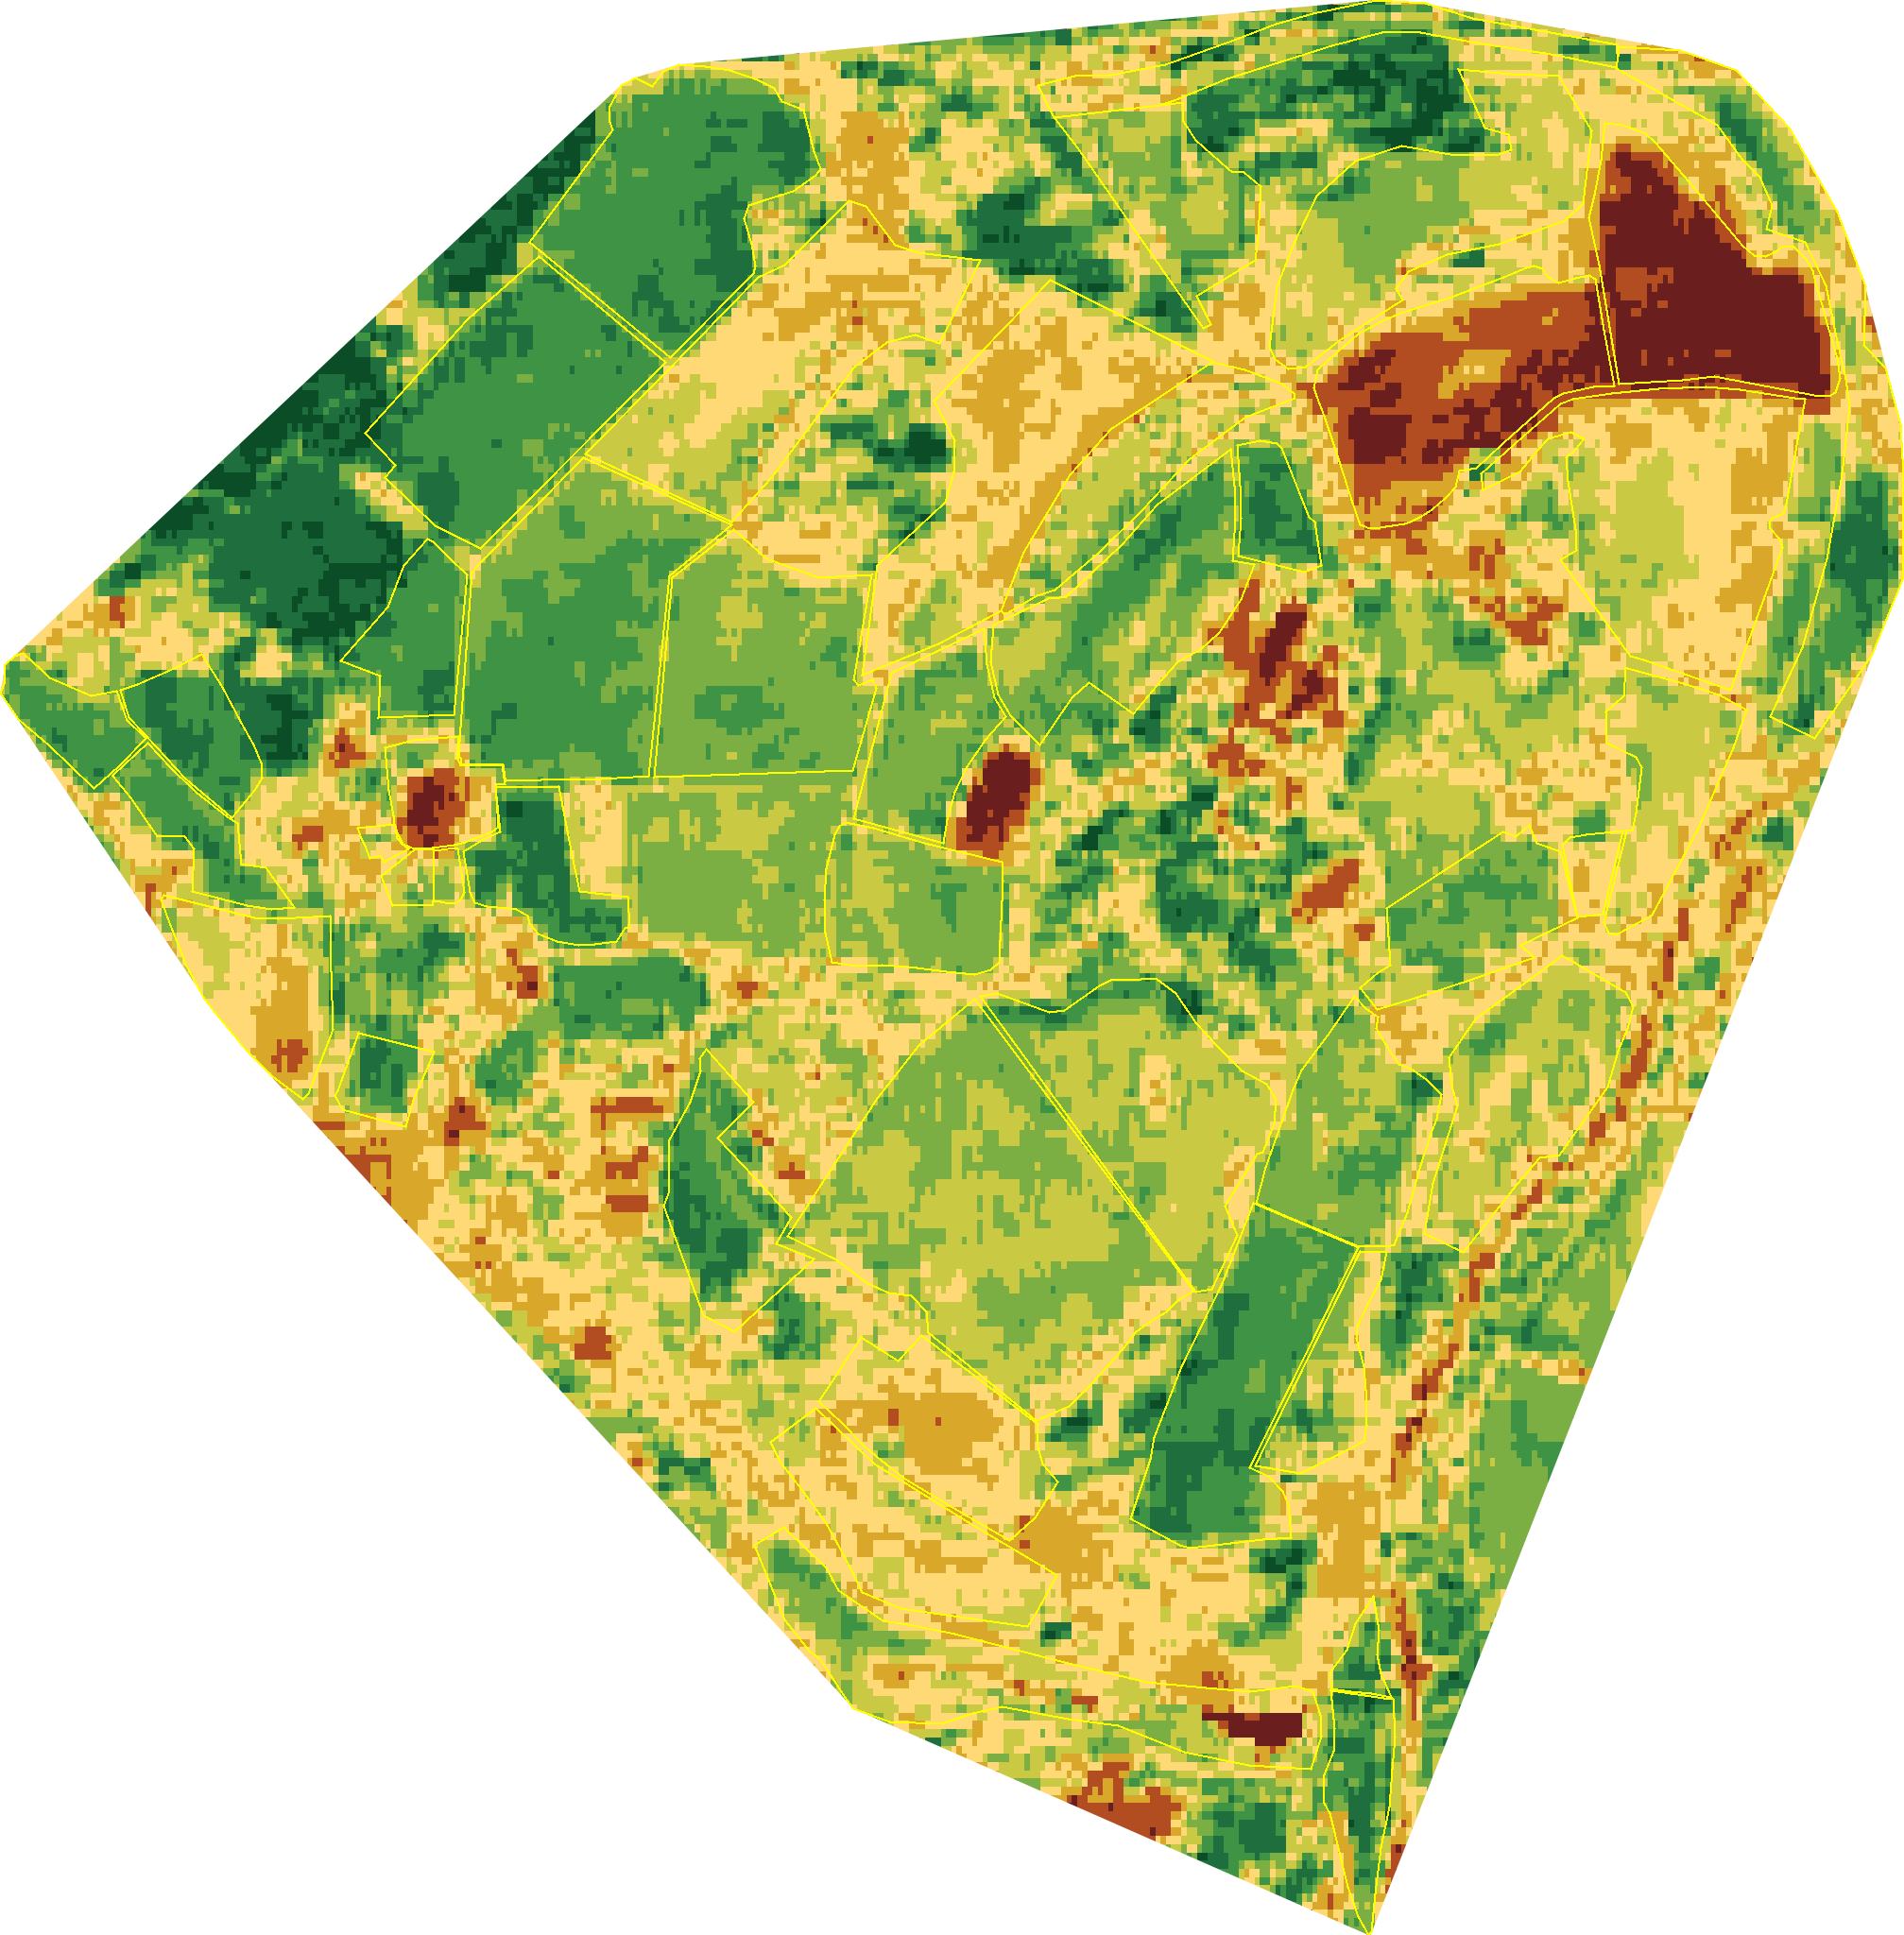
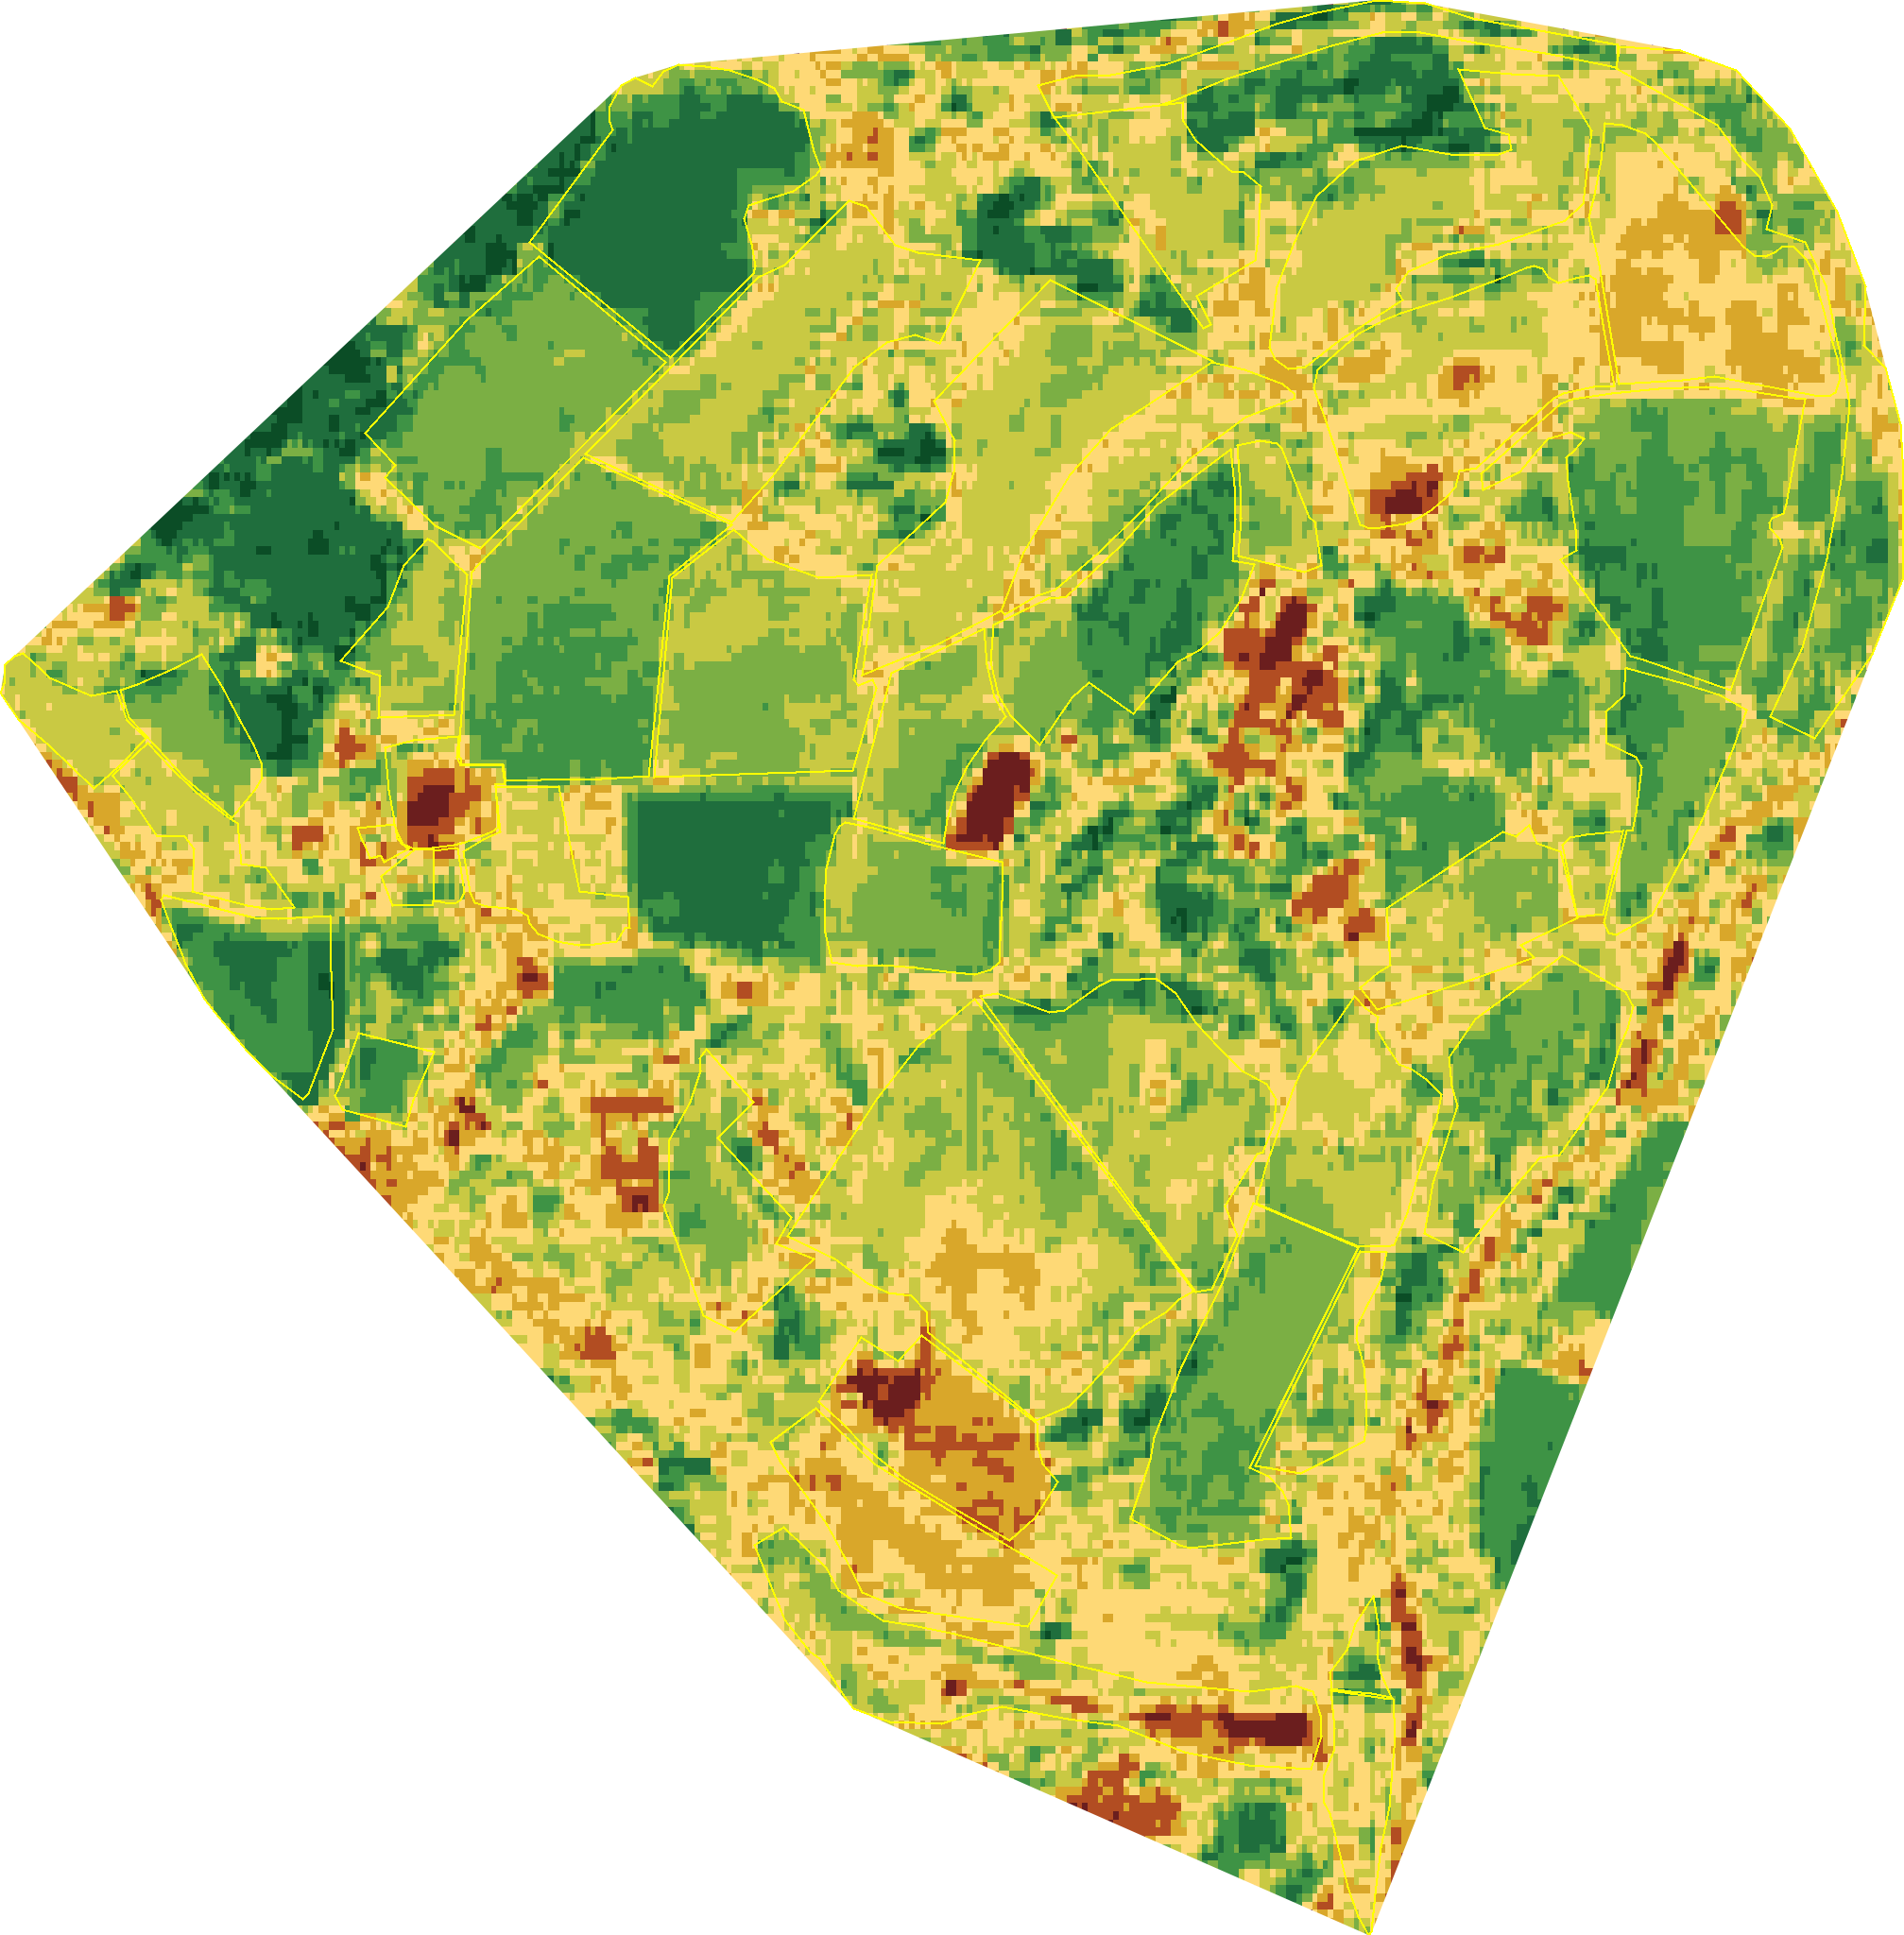
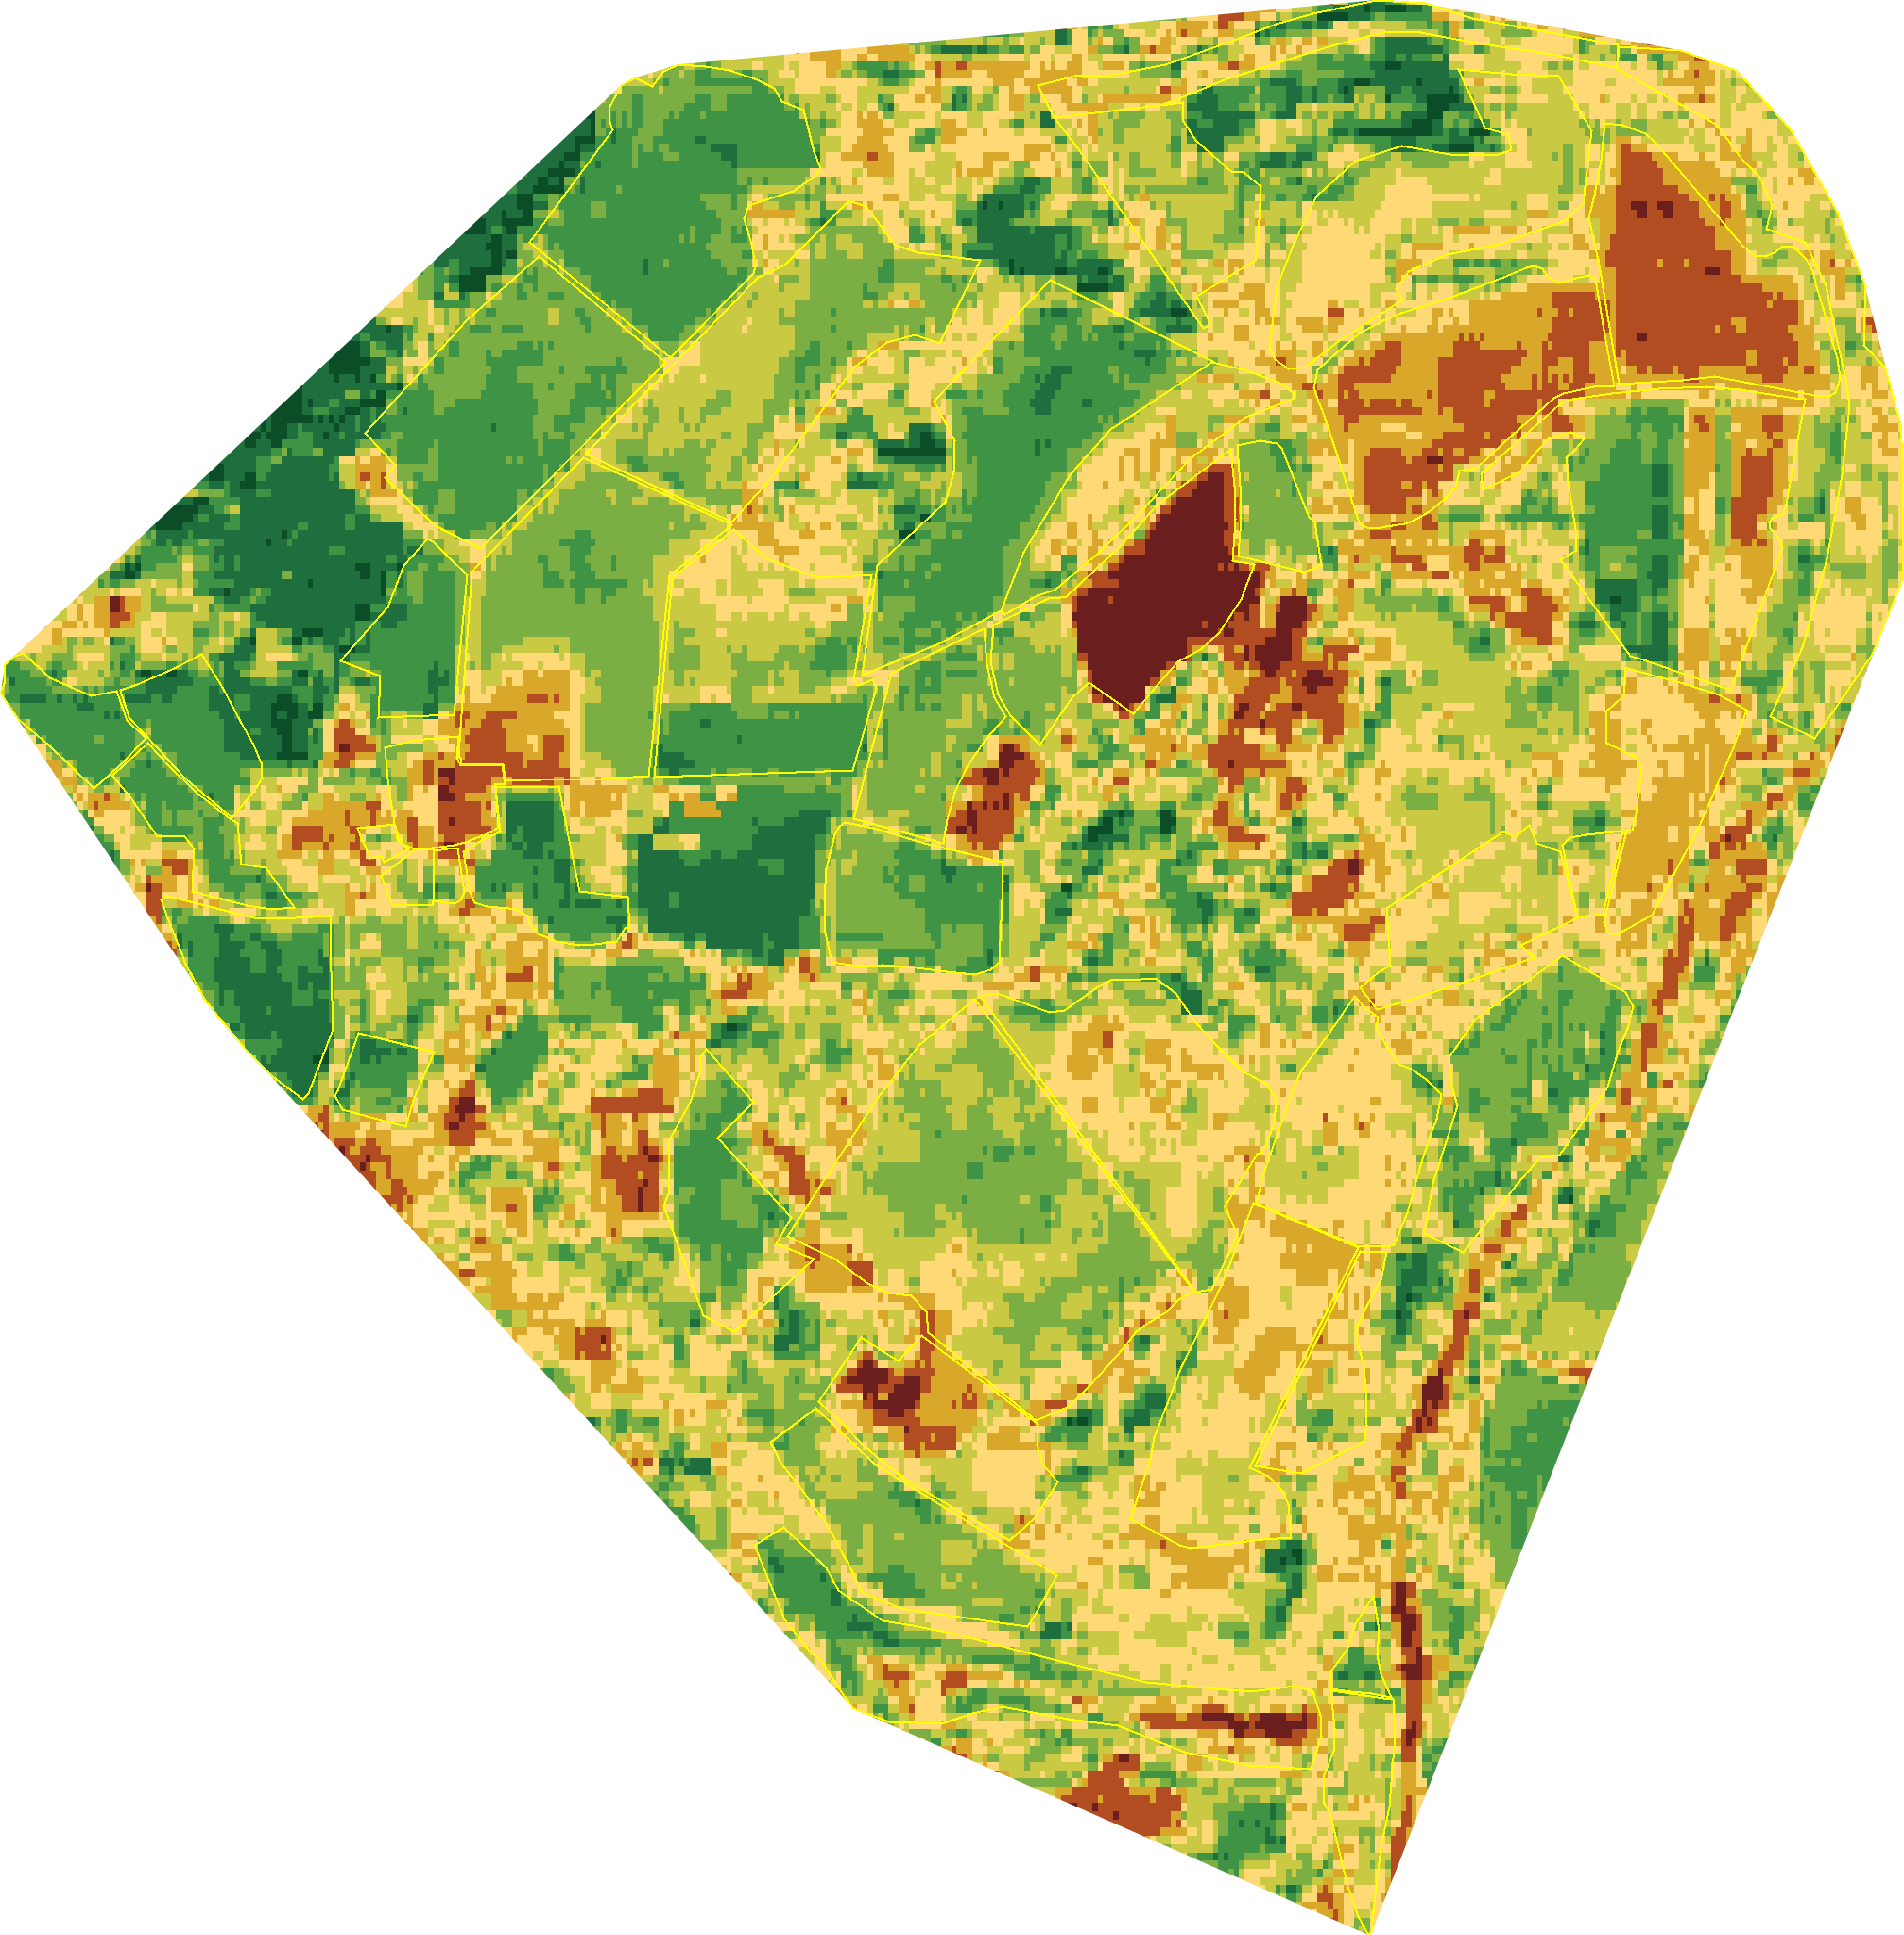
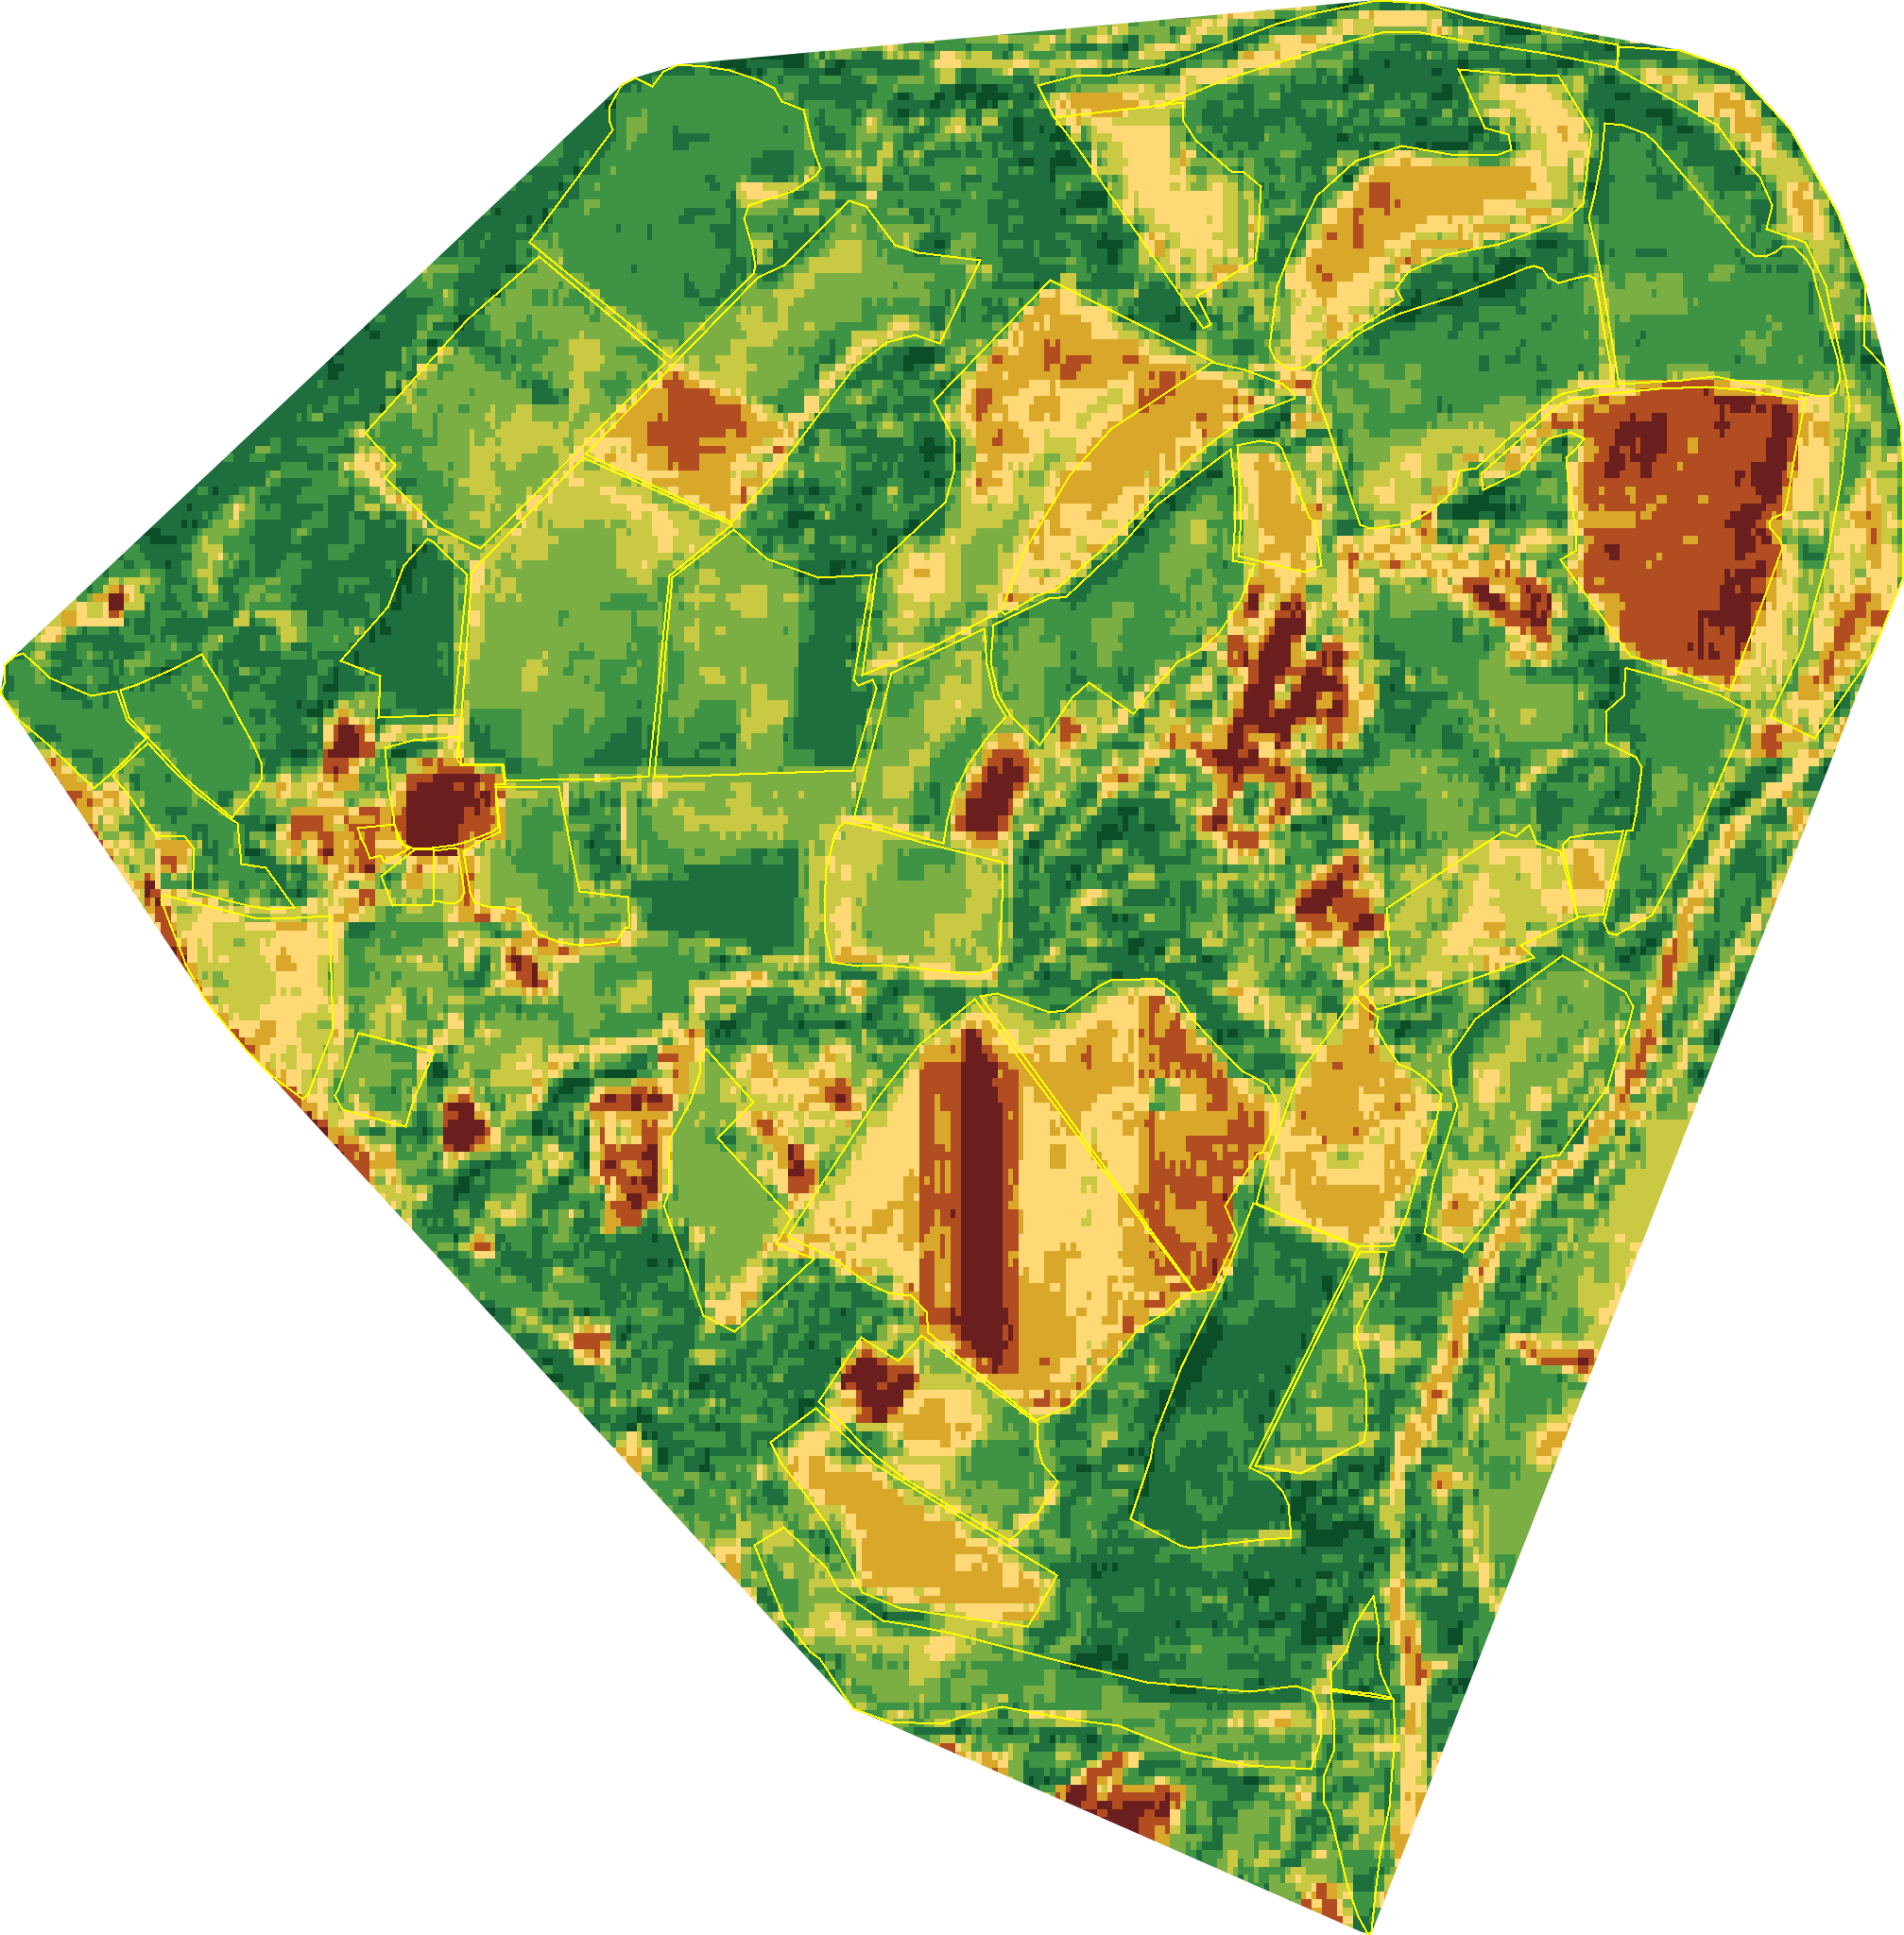
Eight years of history, on every property
Every parcel arrives with a multi-year scored history attached. Below: Wilder Wood Farm's Land Health classification at 10-metre hex resolution, year on year from 2018 to 2025. The greens hold their shape across a fair range of weather years. The property's score is real, not weather noise.
-
-
-
-
-
-
-
-
- 9
Flourishing
Ecosystem at fullest expression. Strengthens under disturbance.
- 8
Thriving
All processes highly active. Strong biological diversity and vitality.
- 7
Healthy
All core processes functioning well. Minor vulnerabilities only.
- 6
Recovering
Measurable improvement underway. Trajectory clearly positive.
- 5
Transitional
Some processes functioning, others compromised. Trend unstable.
- 4
Stressed
Multiple processes impaired. System under significant strain.
- 3
Degraded
Most processes failing. Structural damage evident. Urgent action needed.
- 2
Depleted
Severe dysfunction across systems. Biological capital critically low.
- 1
Collapsed
System failure. Bare soil dominant, minimal vegetation or function.
The EcoDynamics Engine
EcoIntel's proprietary analytical framework translates satellite and other data into process-based ecosystem diagnostics. We assess the functional conditions that drive every downstream outcome: carbon sequestration, biodiversity, soil health, water retention, farm profitability.
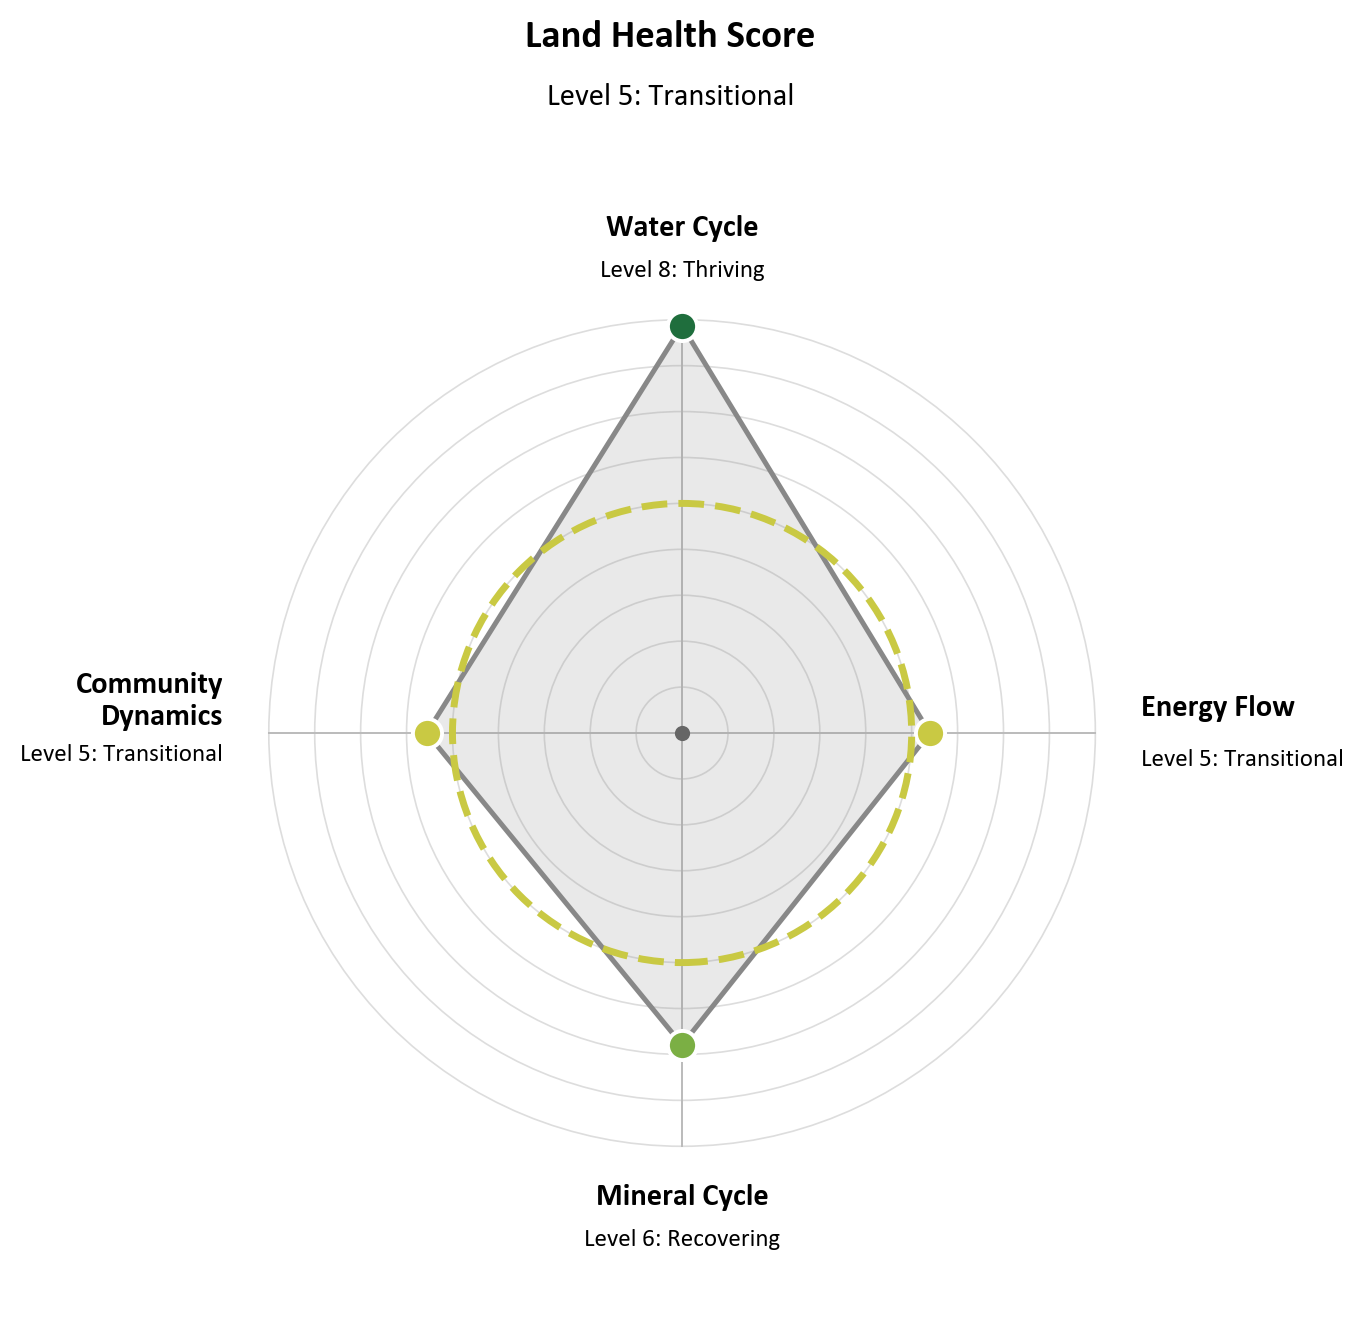
The four ecosystem processes
-
Energy Flow
Sunlight converted to bio-available energy by photosynthesis, cycled through the living system.
-
Water Cycle
Water movement drives all other ecosystem processes: infiltration, evaporation, groundwater.
-
Mineral Cycle
Nutrients cycling continuously through the living system: soil, organisms, atmosphere.
-
Community Dynamics
Species mix and relationships create system stability, diversity, balance, and resilience.
Risk and opportunity, mapped at field level
EcoIntel's reporting suite includes dedicated risk and opportunity reports: turning the diagnosis into the conversation a lender, an insurer, a tenant or a successor actually needs to have.
Risk covers a spectrum: topographic, ecosystemic, management, climate and financial. Fields with declining trajectories, valley positions failing to do their hydrological job, water security running close to the margins even in a wet climate, stranded assets, and more. The system maps these risks at field level and translates them into ecological, financial and compliance language: where natural capital is eroding, where long-term asset value is shifting, where succession risk is building, where regulatory exposure is growing.
Opportunity is the flip side. The system tells you where constraints are also leverage points. It separates the quick wins (fields close to a Land Health Score band boundary where small changes will produce a measurable shift in one or two growing seasons) from actions that require strategic investment to deliver compound returns over a multi-year horizon.
Every recommendation is anchored in what each parcel is currently doing, what its relative position in the landscape means and allows, and what climate, terrain and existing land use make practical.
Complementary, not competitive
Existing tools measure component outputs. The Land Health System analyses the conditions driving those outputs. It strengthens Carbon MRV, natural-capital tools, biodiversity surveys, and regulatory reporting. It is different because it strengthens decision-making, to deliver better outcomes, whatever component you want to improve.
| Tool | Their primary purpose | Land Health System application |
|---|---|---|
| Carbon MRV | Single-metric verification | Analyses the ecosystem flows that create the carbon |
| Natural-capital tools | Proxy-based asset valuation | Focuses on actual ecosystem function |
| Biodiversity tools | Species counts and surveys | Assesses the system that delivers biodiversity change |
| Soil tests | Point-in-time sampling | Continuous assessment of evolving ecosystem health |
| Regulatory reports | Disclosure frameworks | Makes sense of how well nature is really doing |
Want to see it on your land?
Onboard with a single map upload. Get a multi-year scored history of every field within days.