Mapping & planning

See your land in ways you never have

EcoIntel builds every map layer of your farm and puts them in one place. The same layers that show you the land also score its health. No GIS skills, no downloading data, no stitching tools together. Every map on this page is our own demonstration farm, Wilder Wood.

01 · One place

Every layer in one place, built for you

Most of what shapes a farm sits below what you can see from the gate: how water moves, where the ground stays cold and wet, which slopes shed and which collect, how each field has recovered year on year. EcoIntel maps all of it from satellite and public elevation data, styles it, and shows it on one screen. You open a field and read it.

Two products bring the layers together:

  • The app map. A satellite base with a layer panel. Turn layers on and off, stack up to eight at once, and click any parcel to read its scores.
  • The Visual Property Atlas. A report that shows your land through fifteen-plus satellite layers, one full-page map each, with a short read-this-map note beside every one. It comes with every plan.

See the full list of layers on the Capabilities page.

The EcoIntel app map: Land Health Score and the four ecosystem-process layers mapped across Wilder Wood Farm, with a layer panel on the right.
The app map on Wilder Wood Farm: every field scored, every layer one click away.

02 · The terrain

The shape of the land, the layer everything else sits on

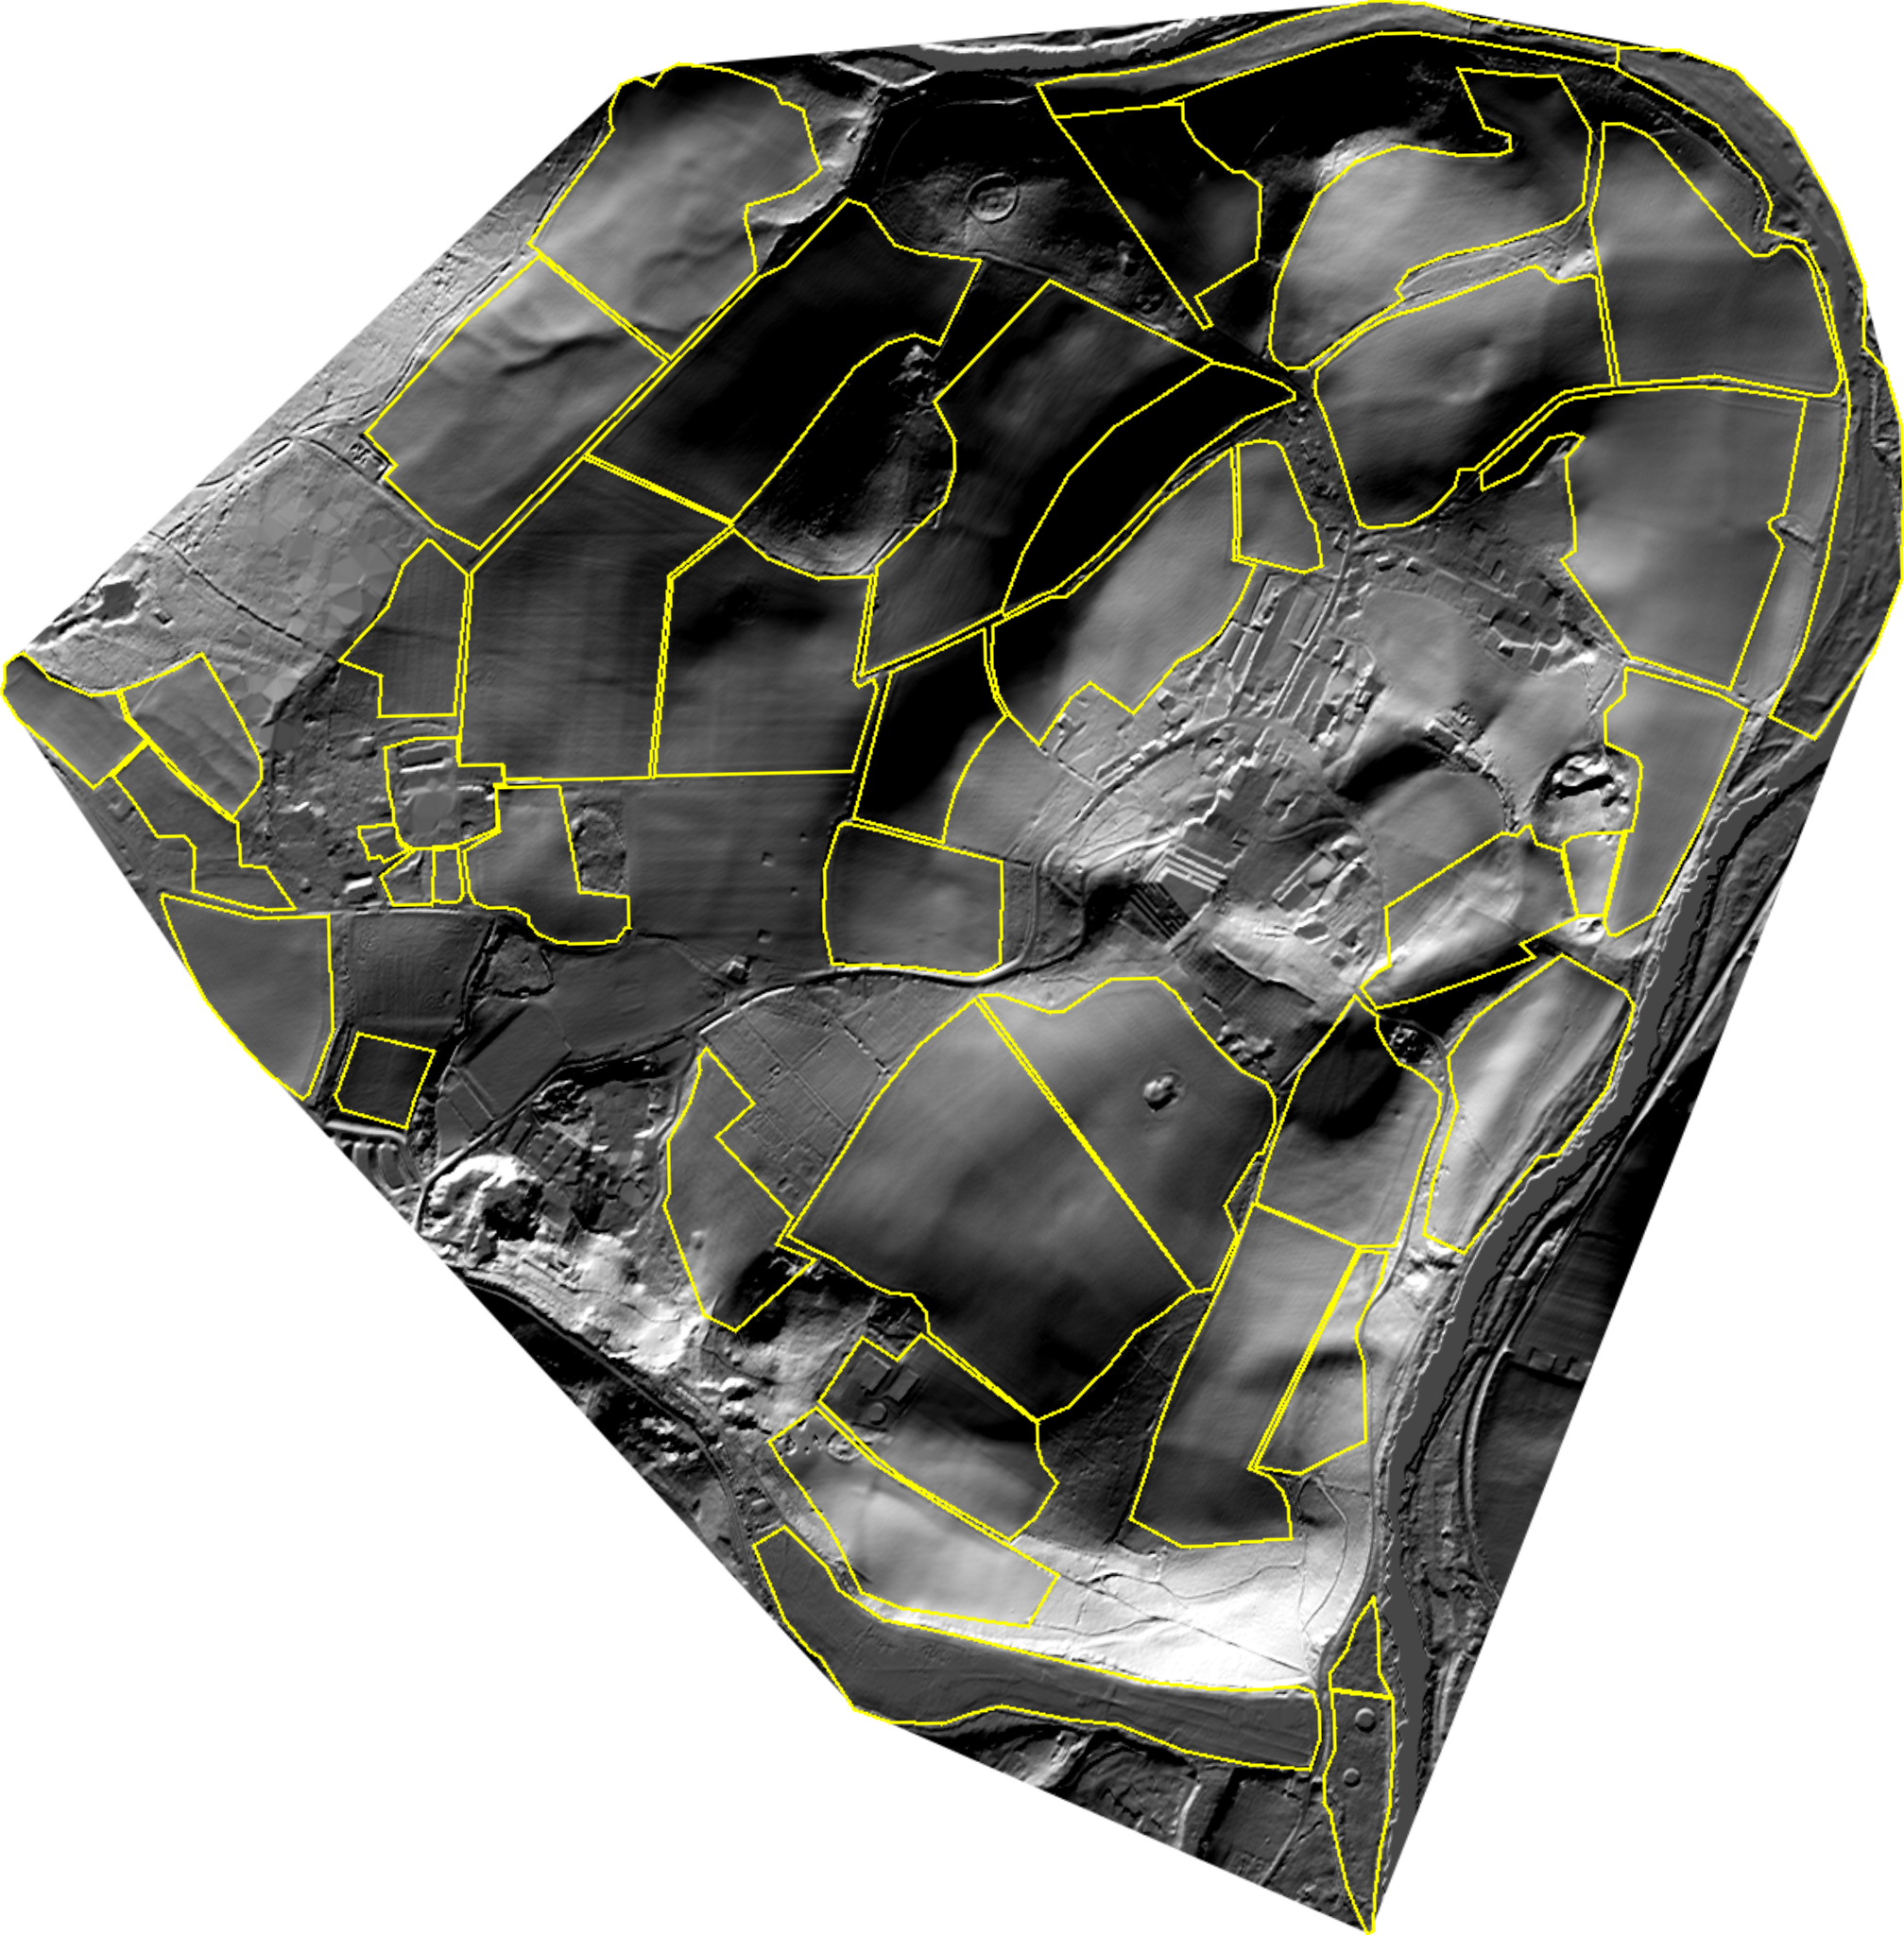
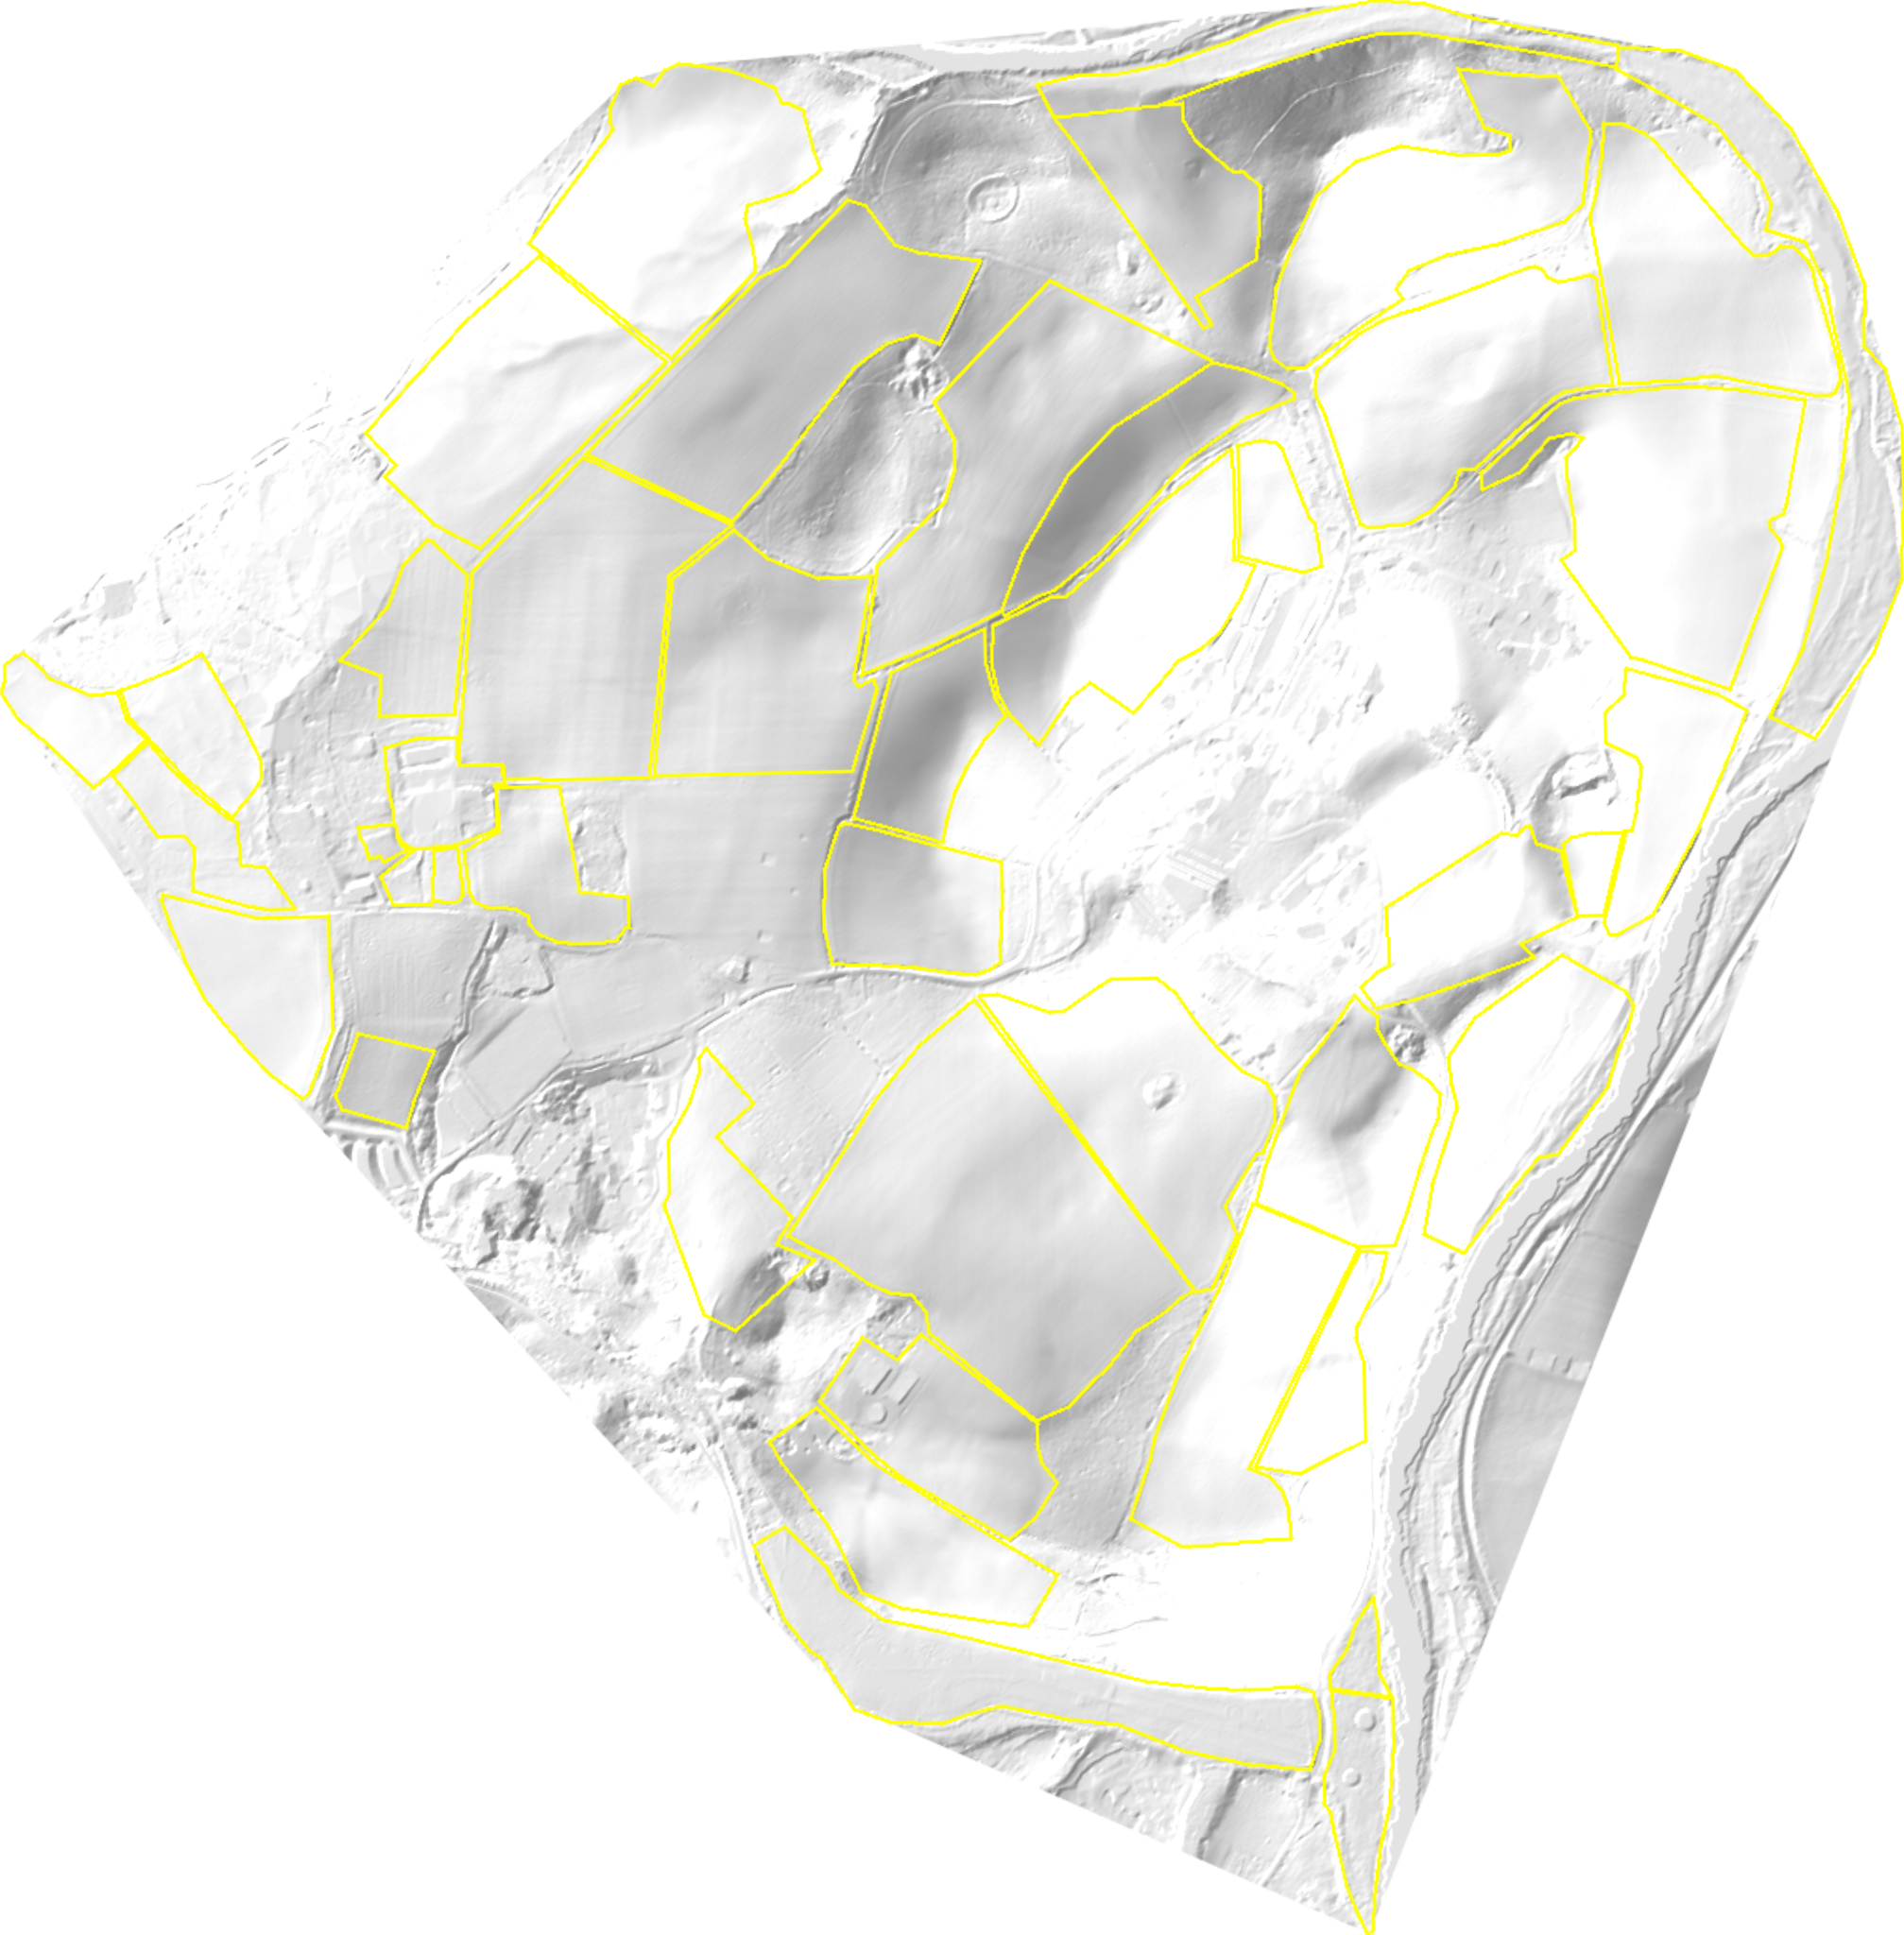
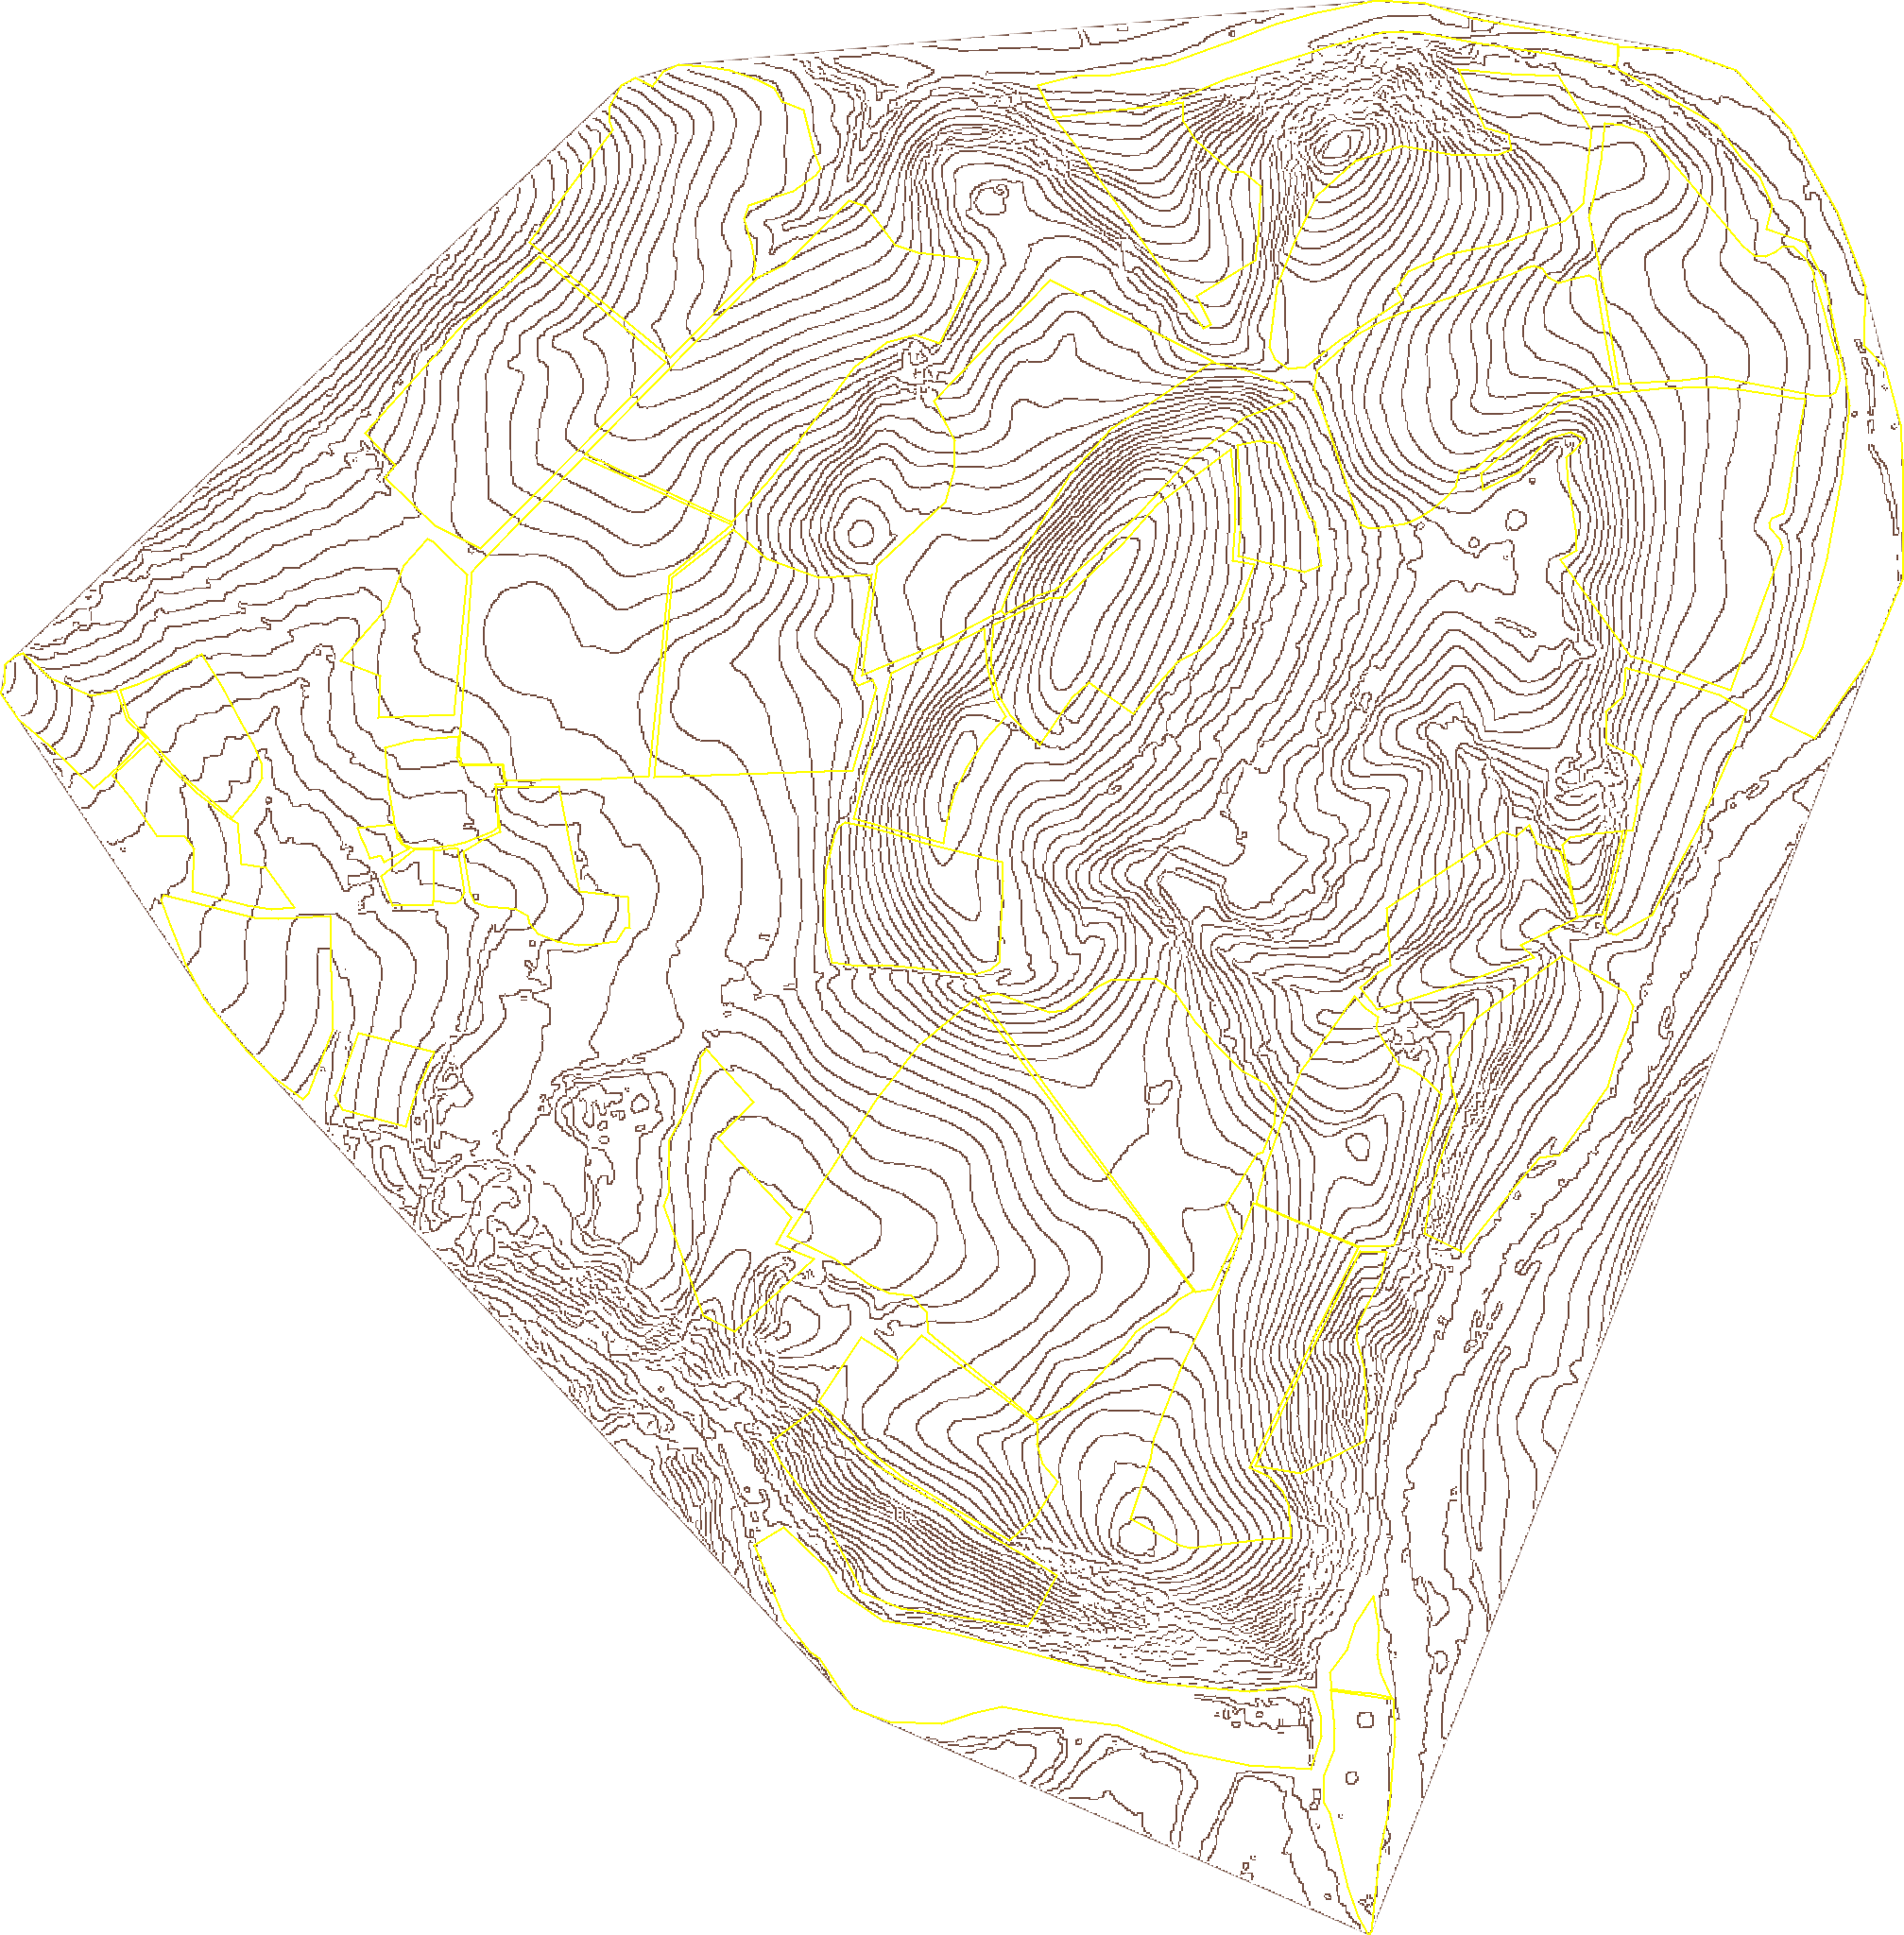
Terrain does not change from year to year, so it is the base you read every other layer against. EcoIntel builds it from public 2 m elevation data.

03 · Water

Where water gathers and where it sheds

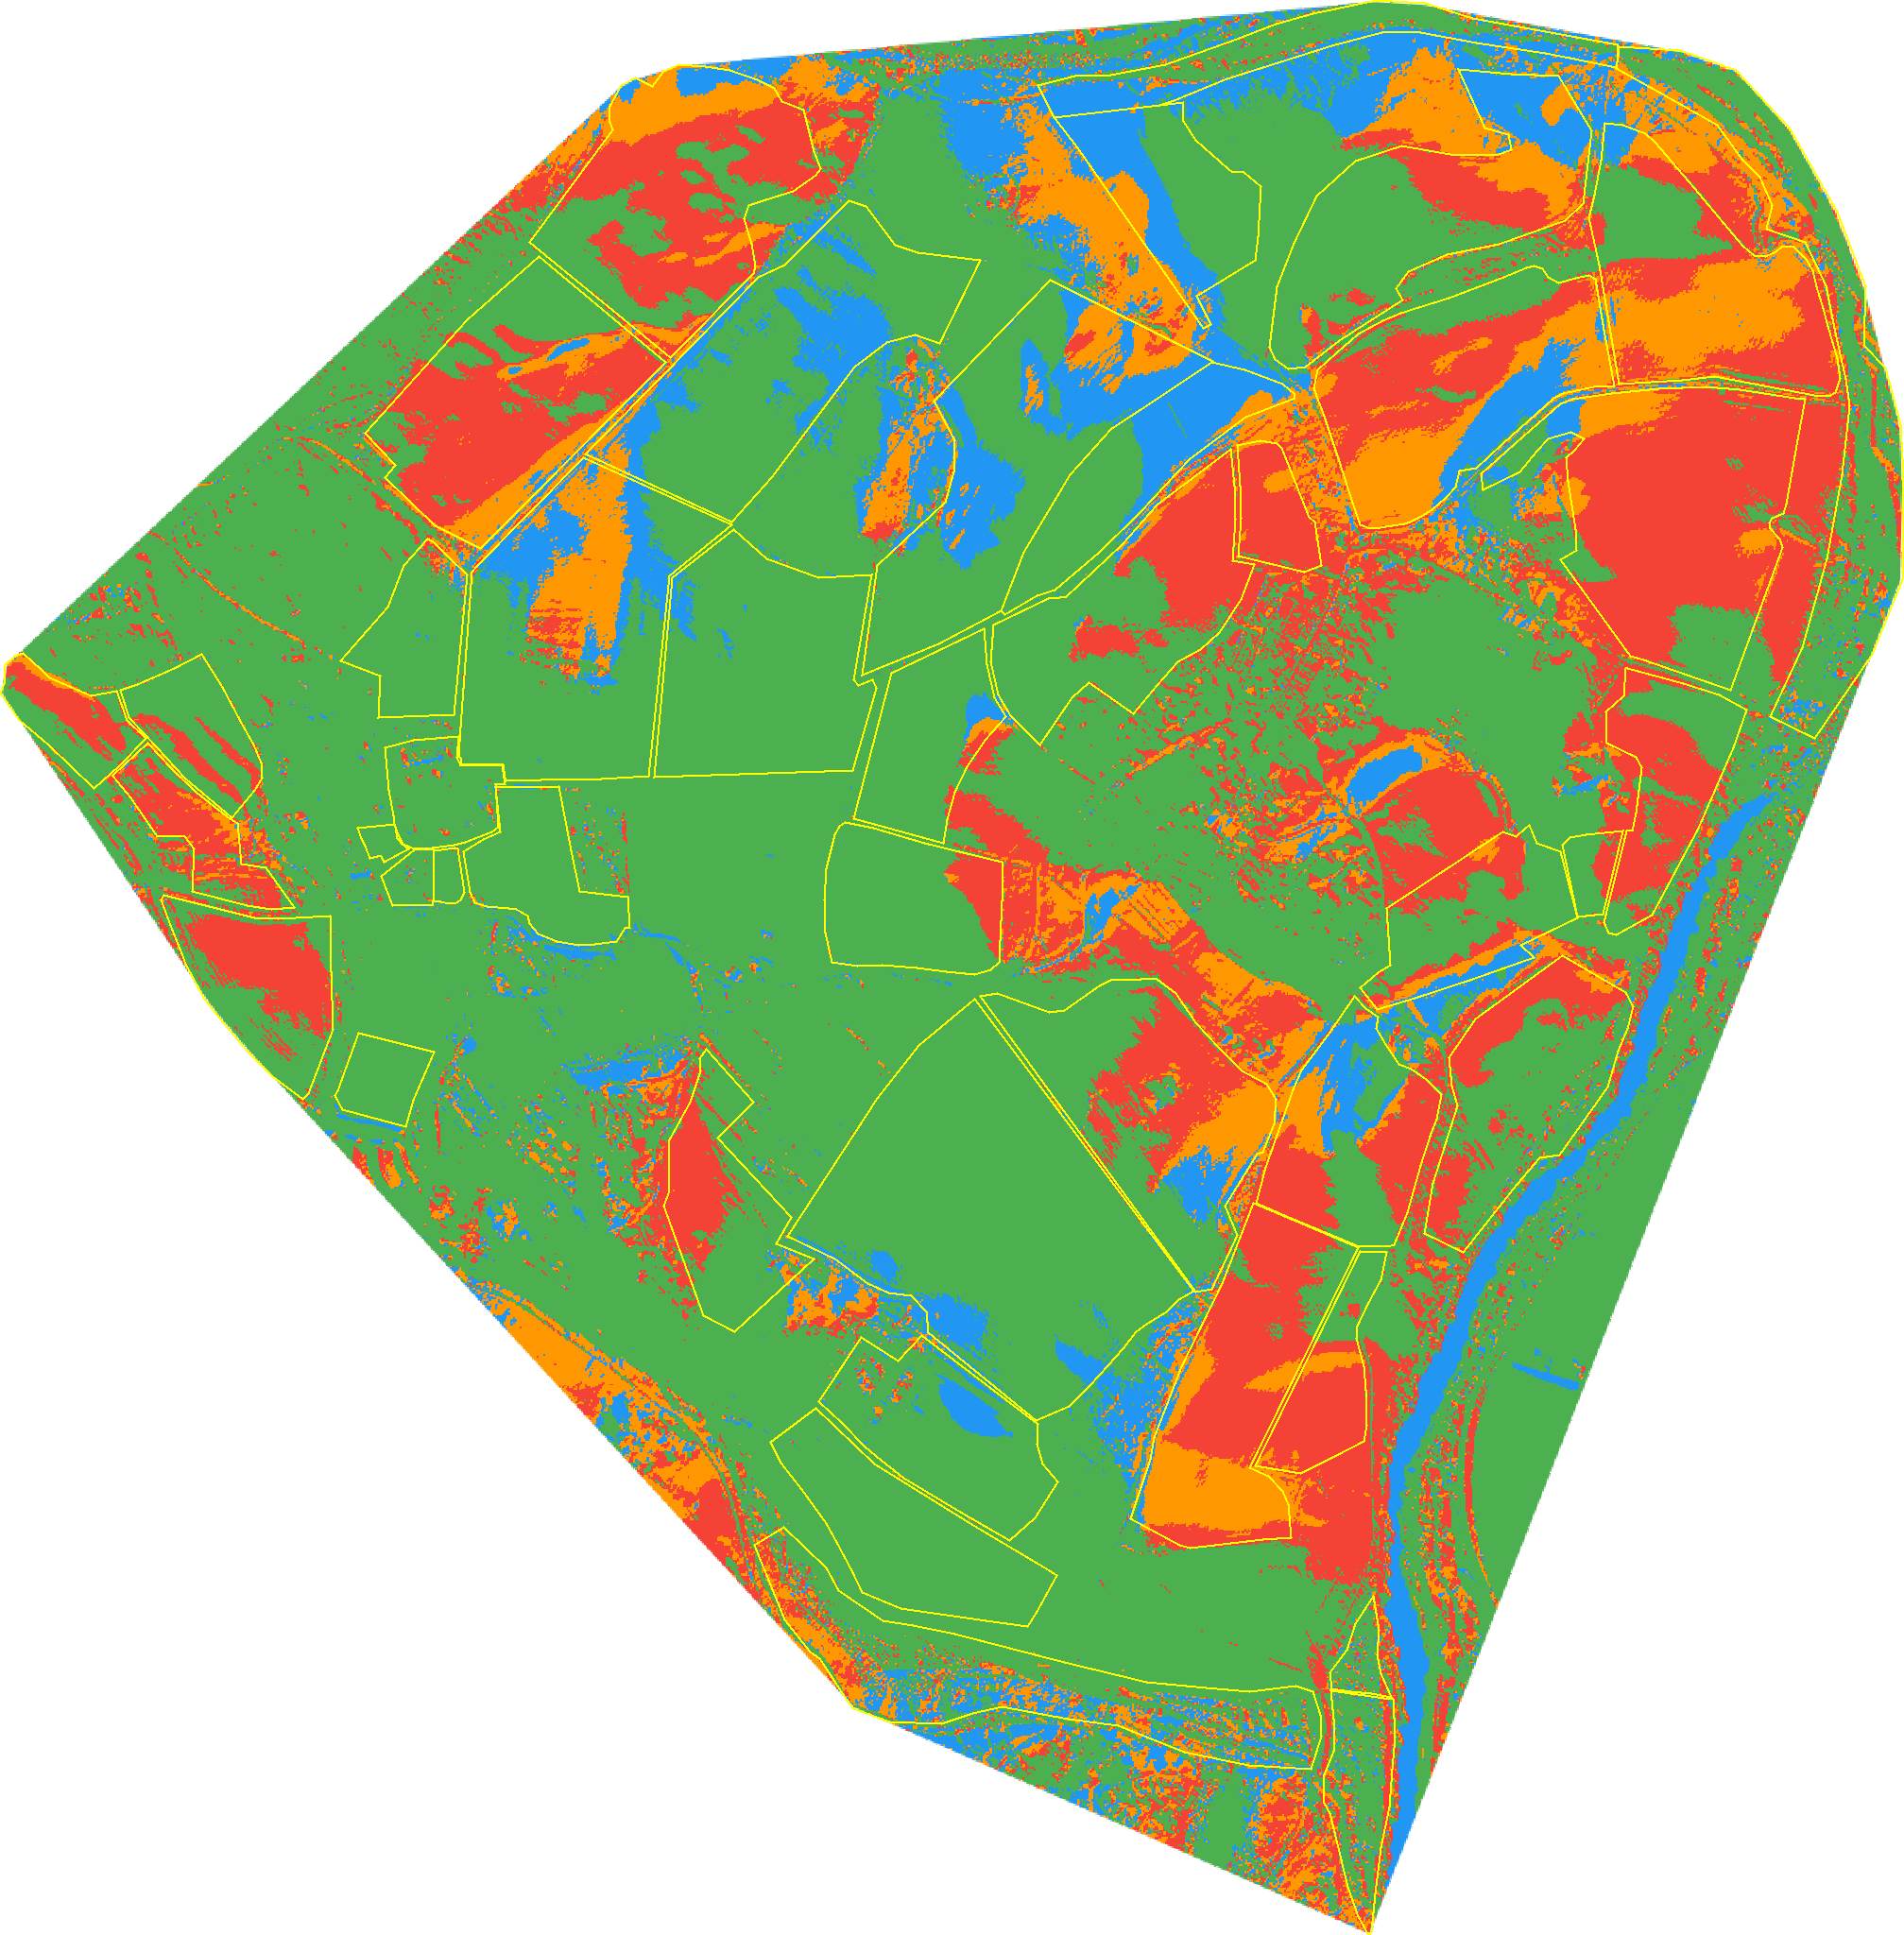
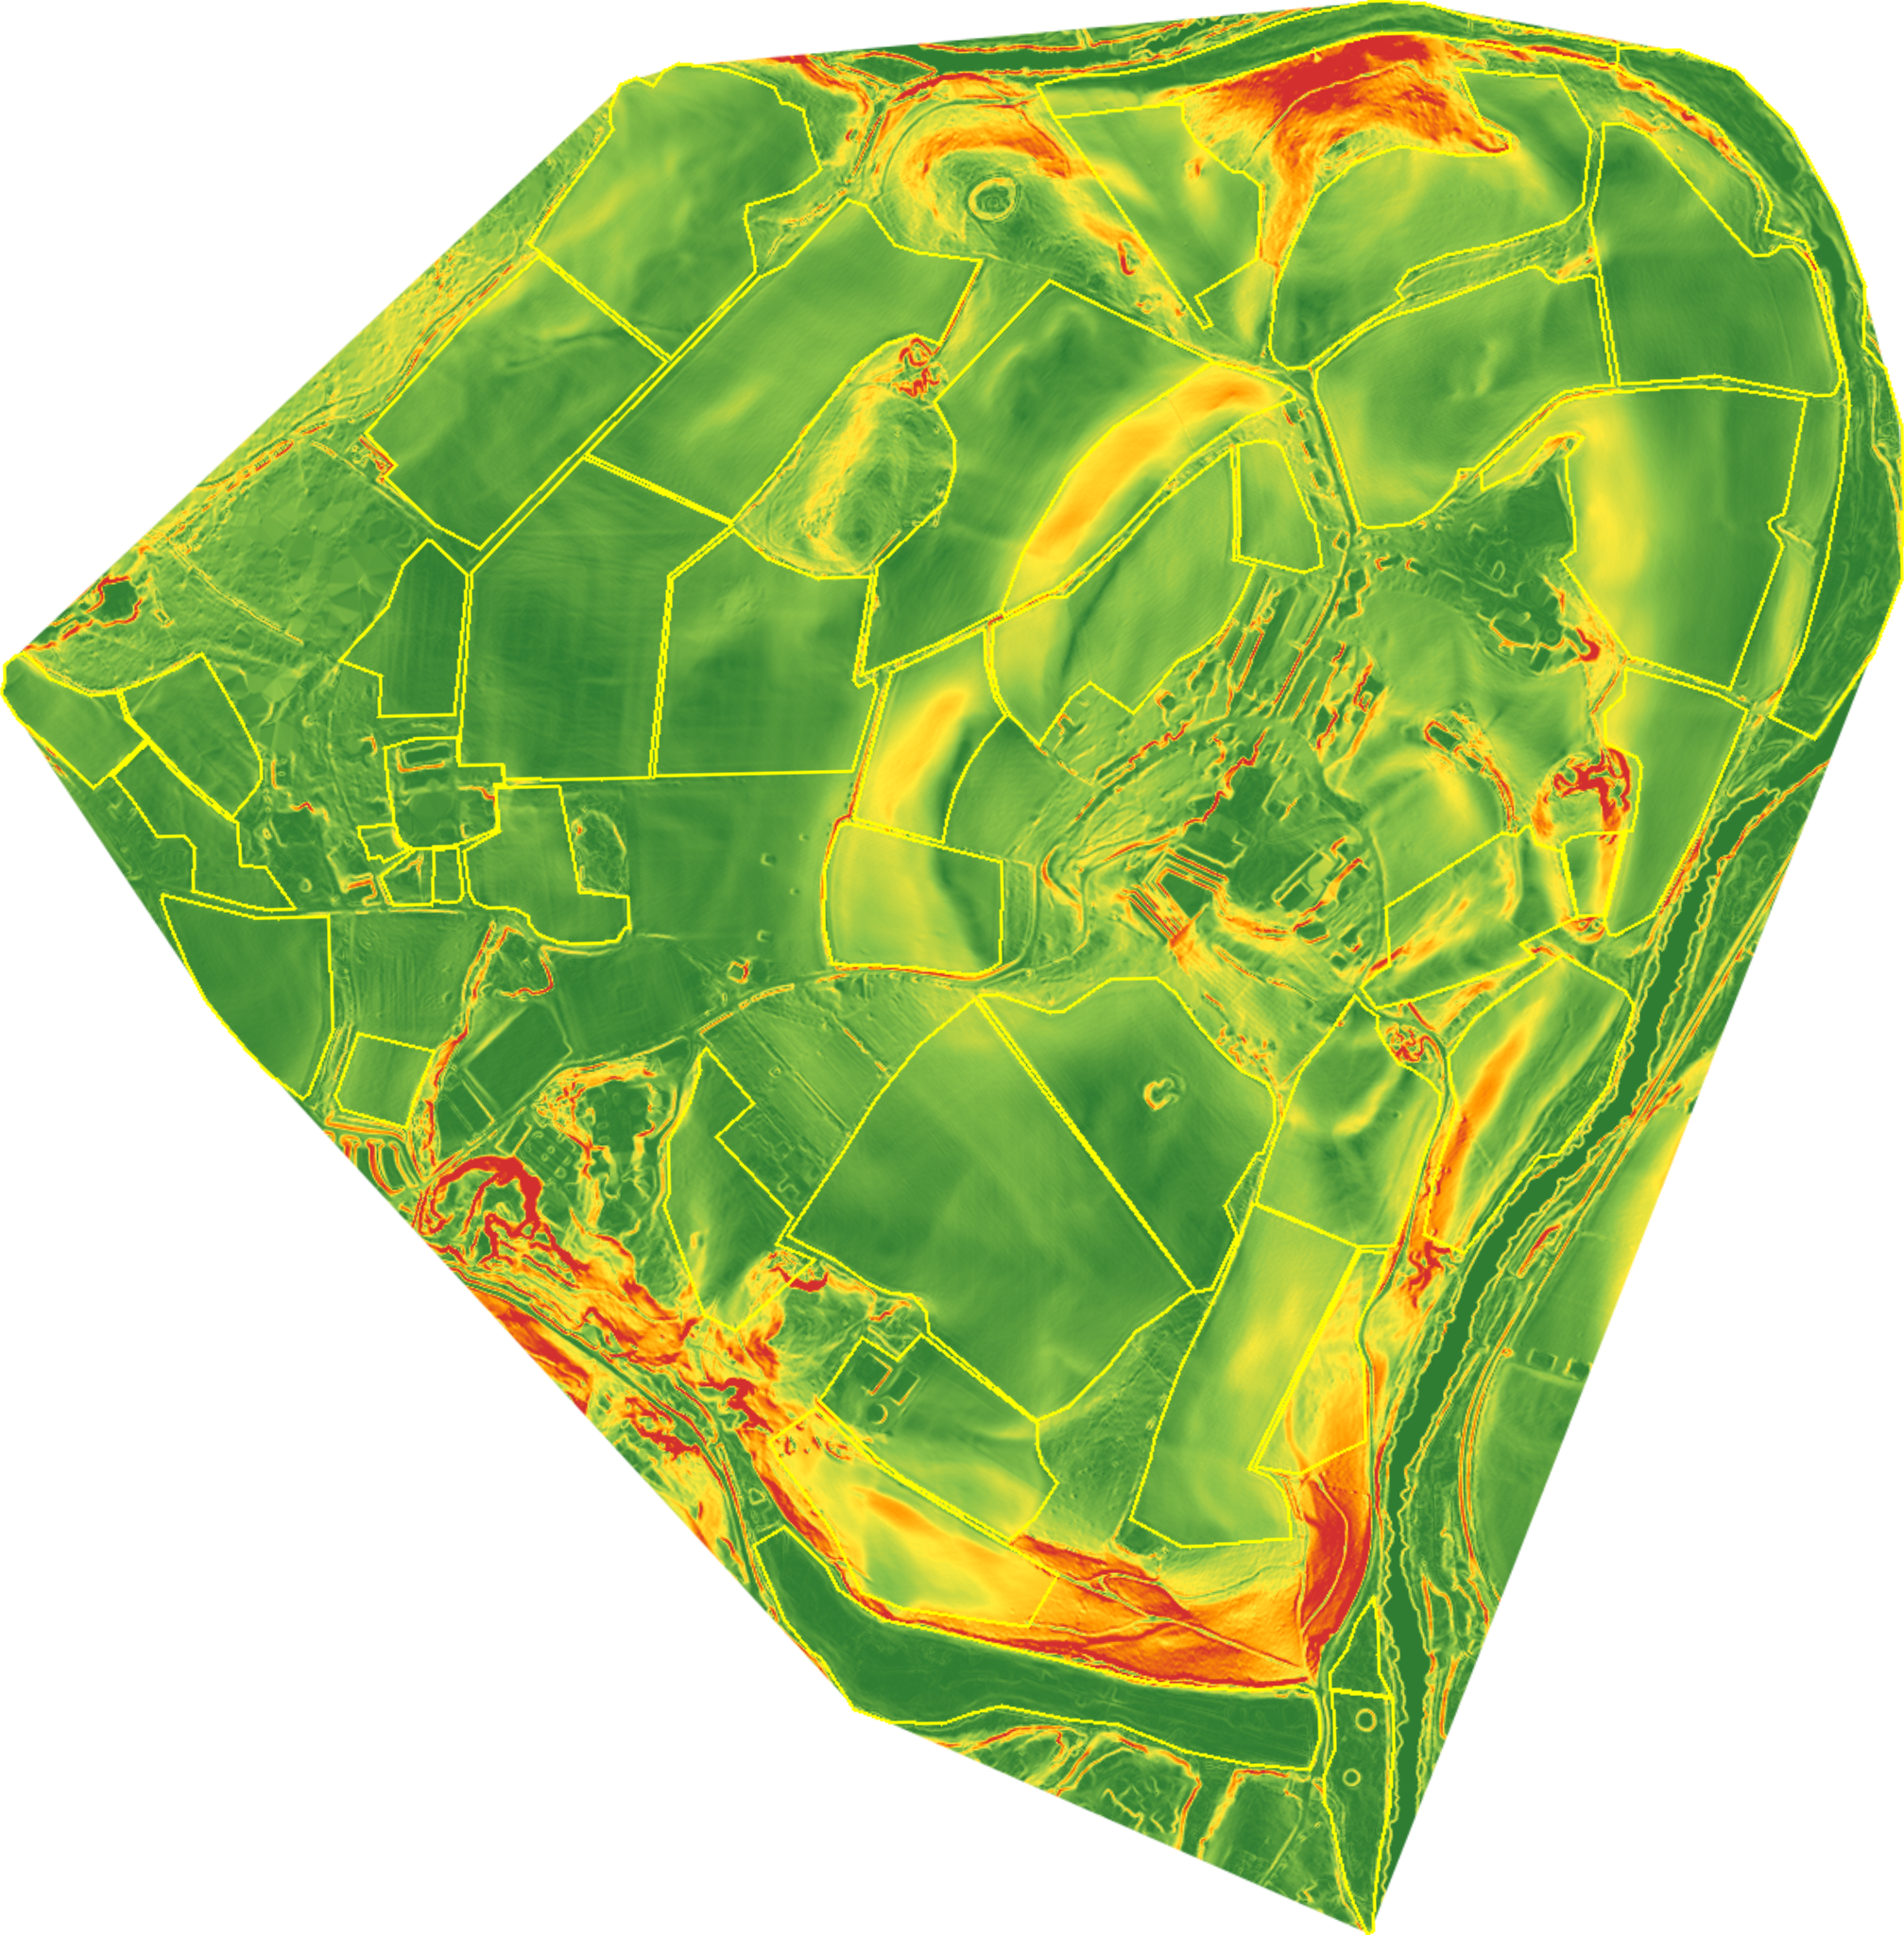
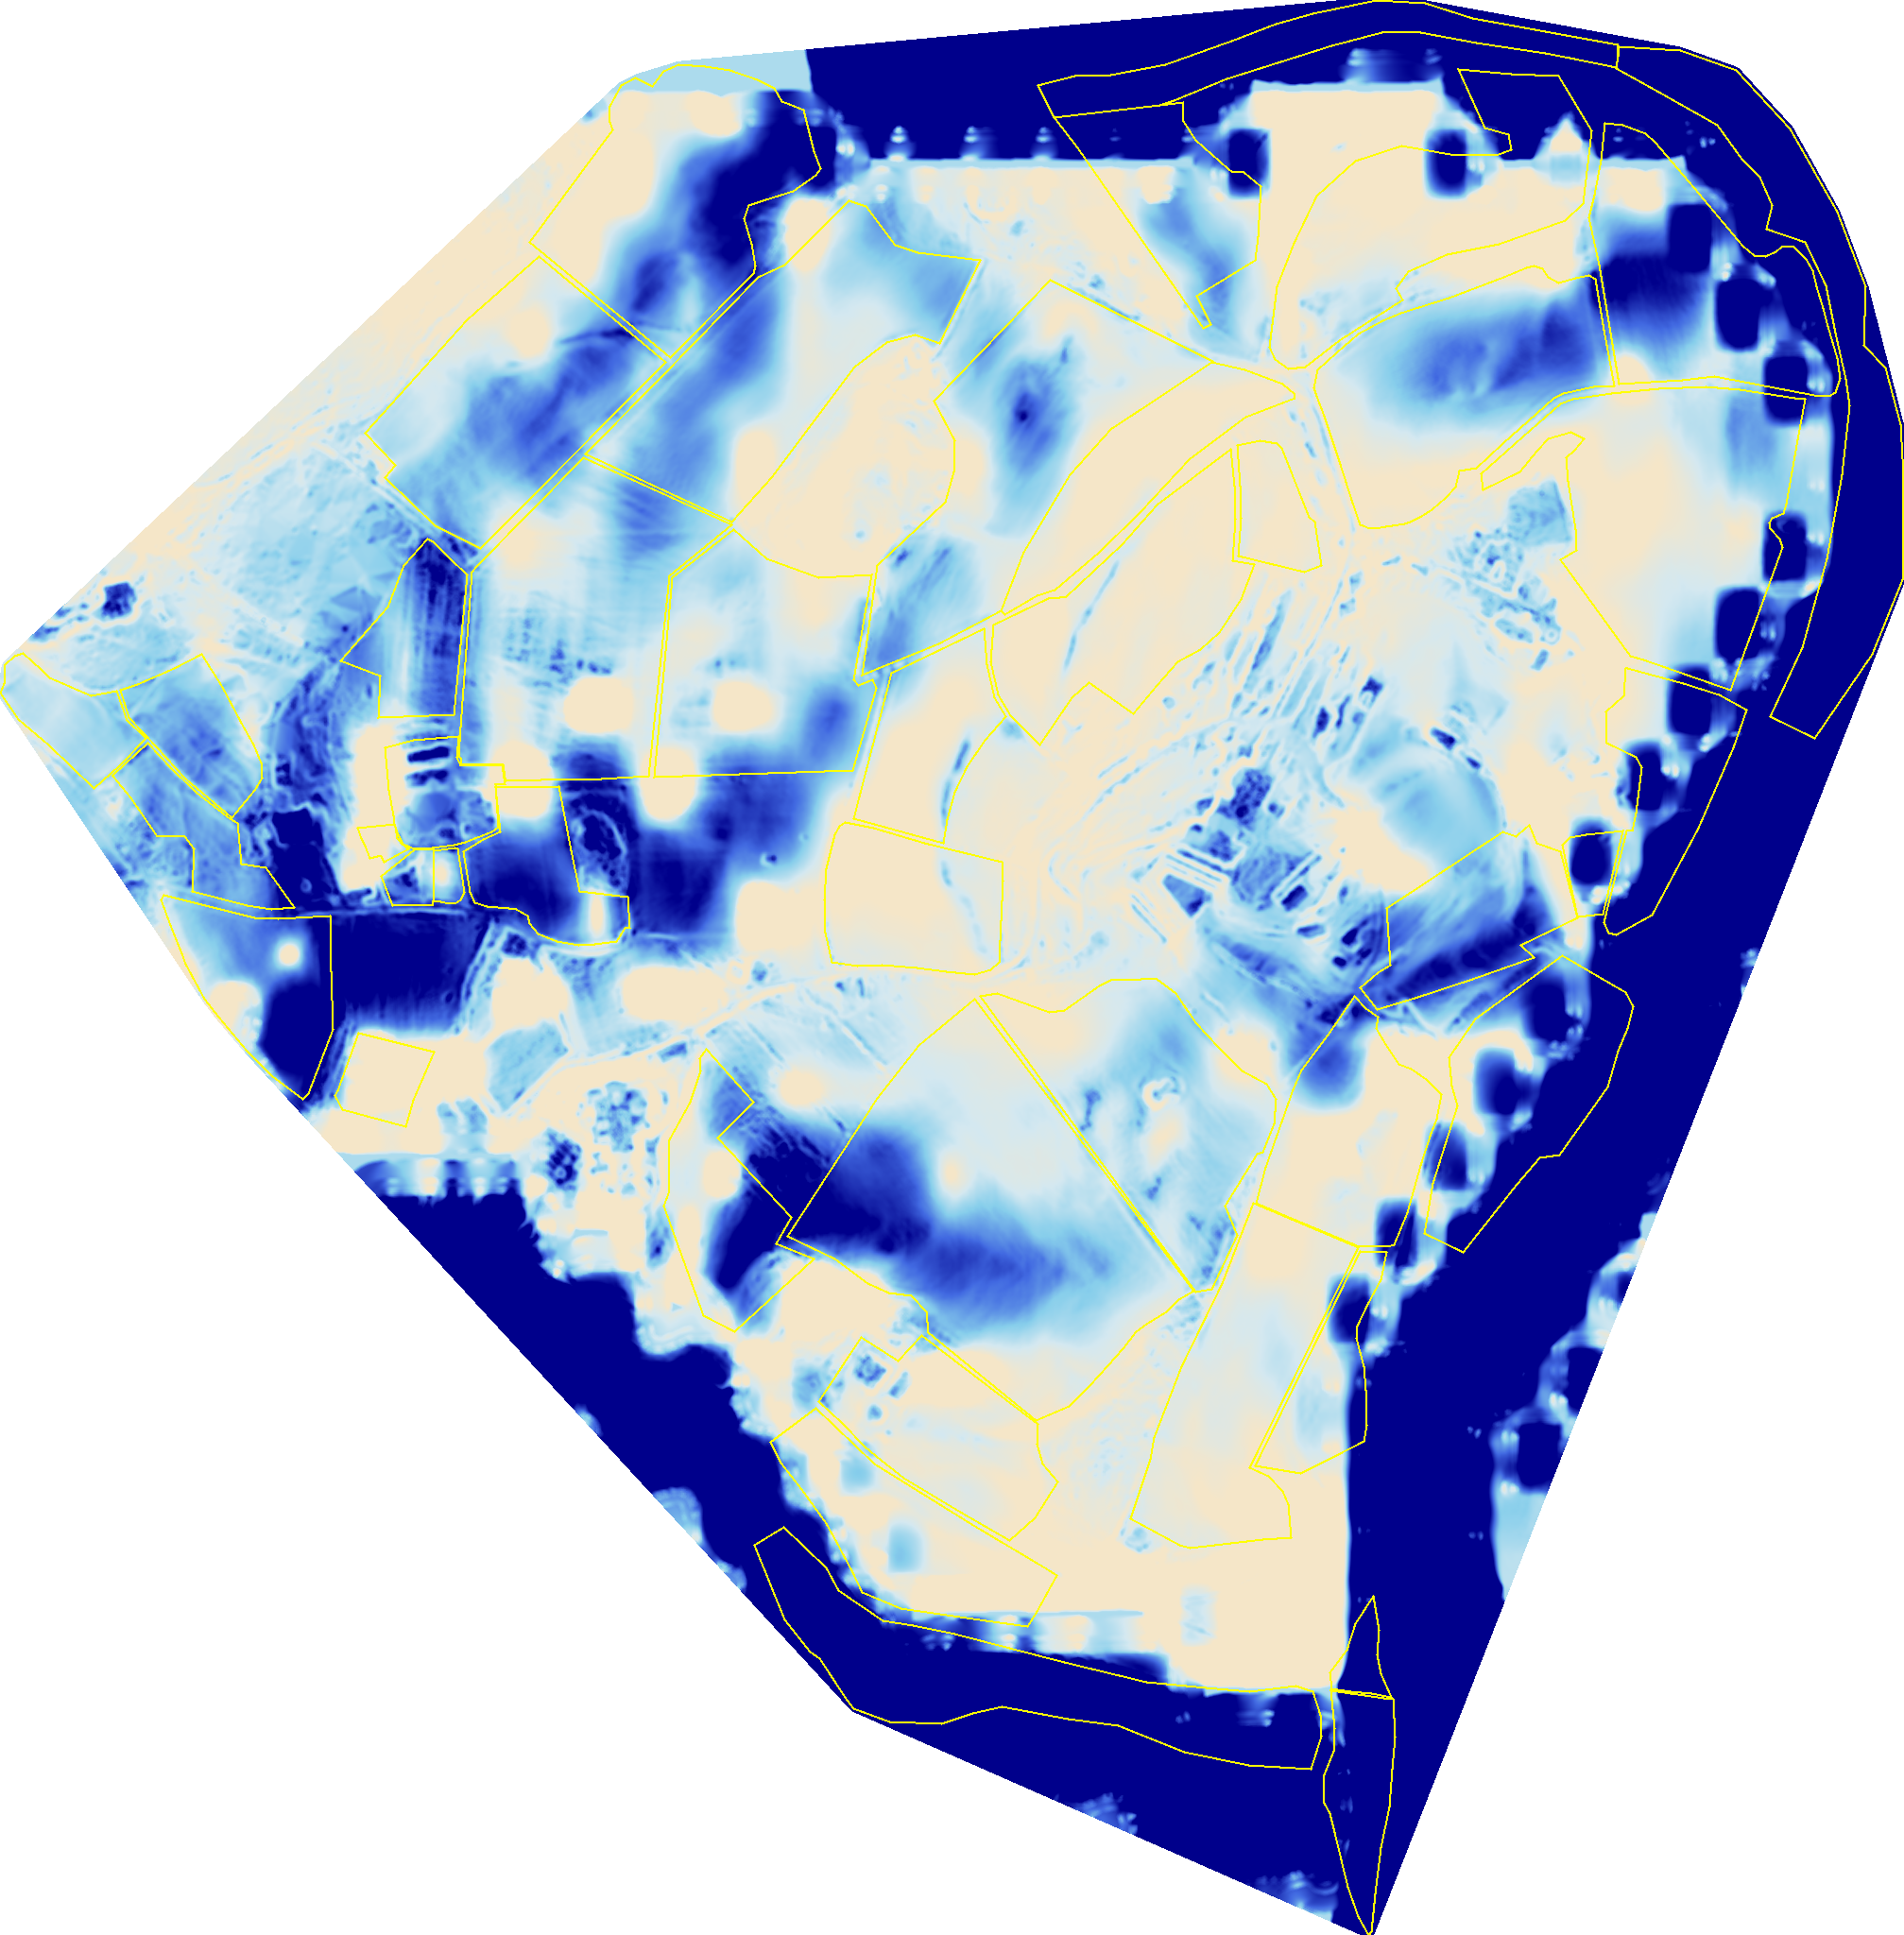
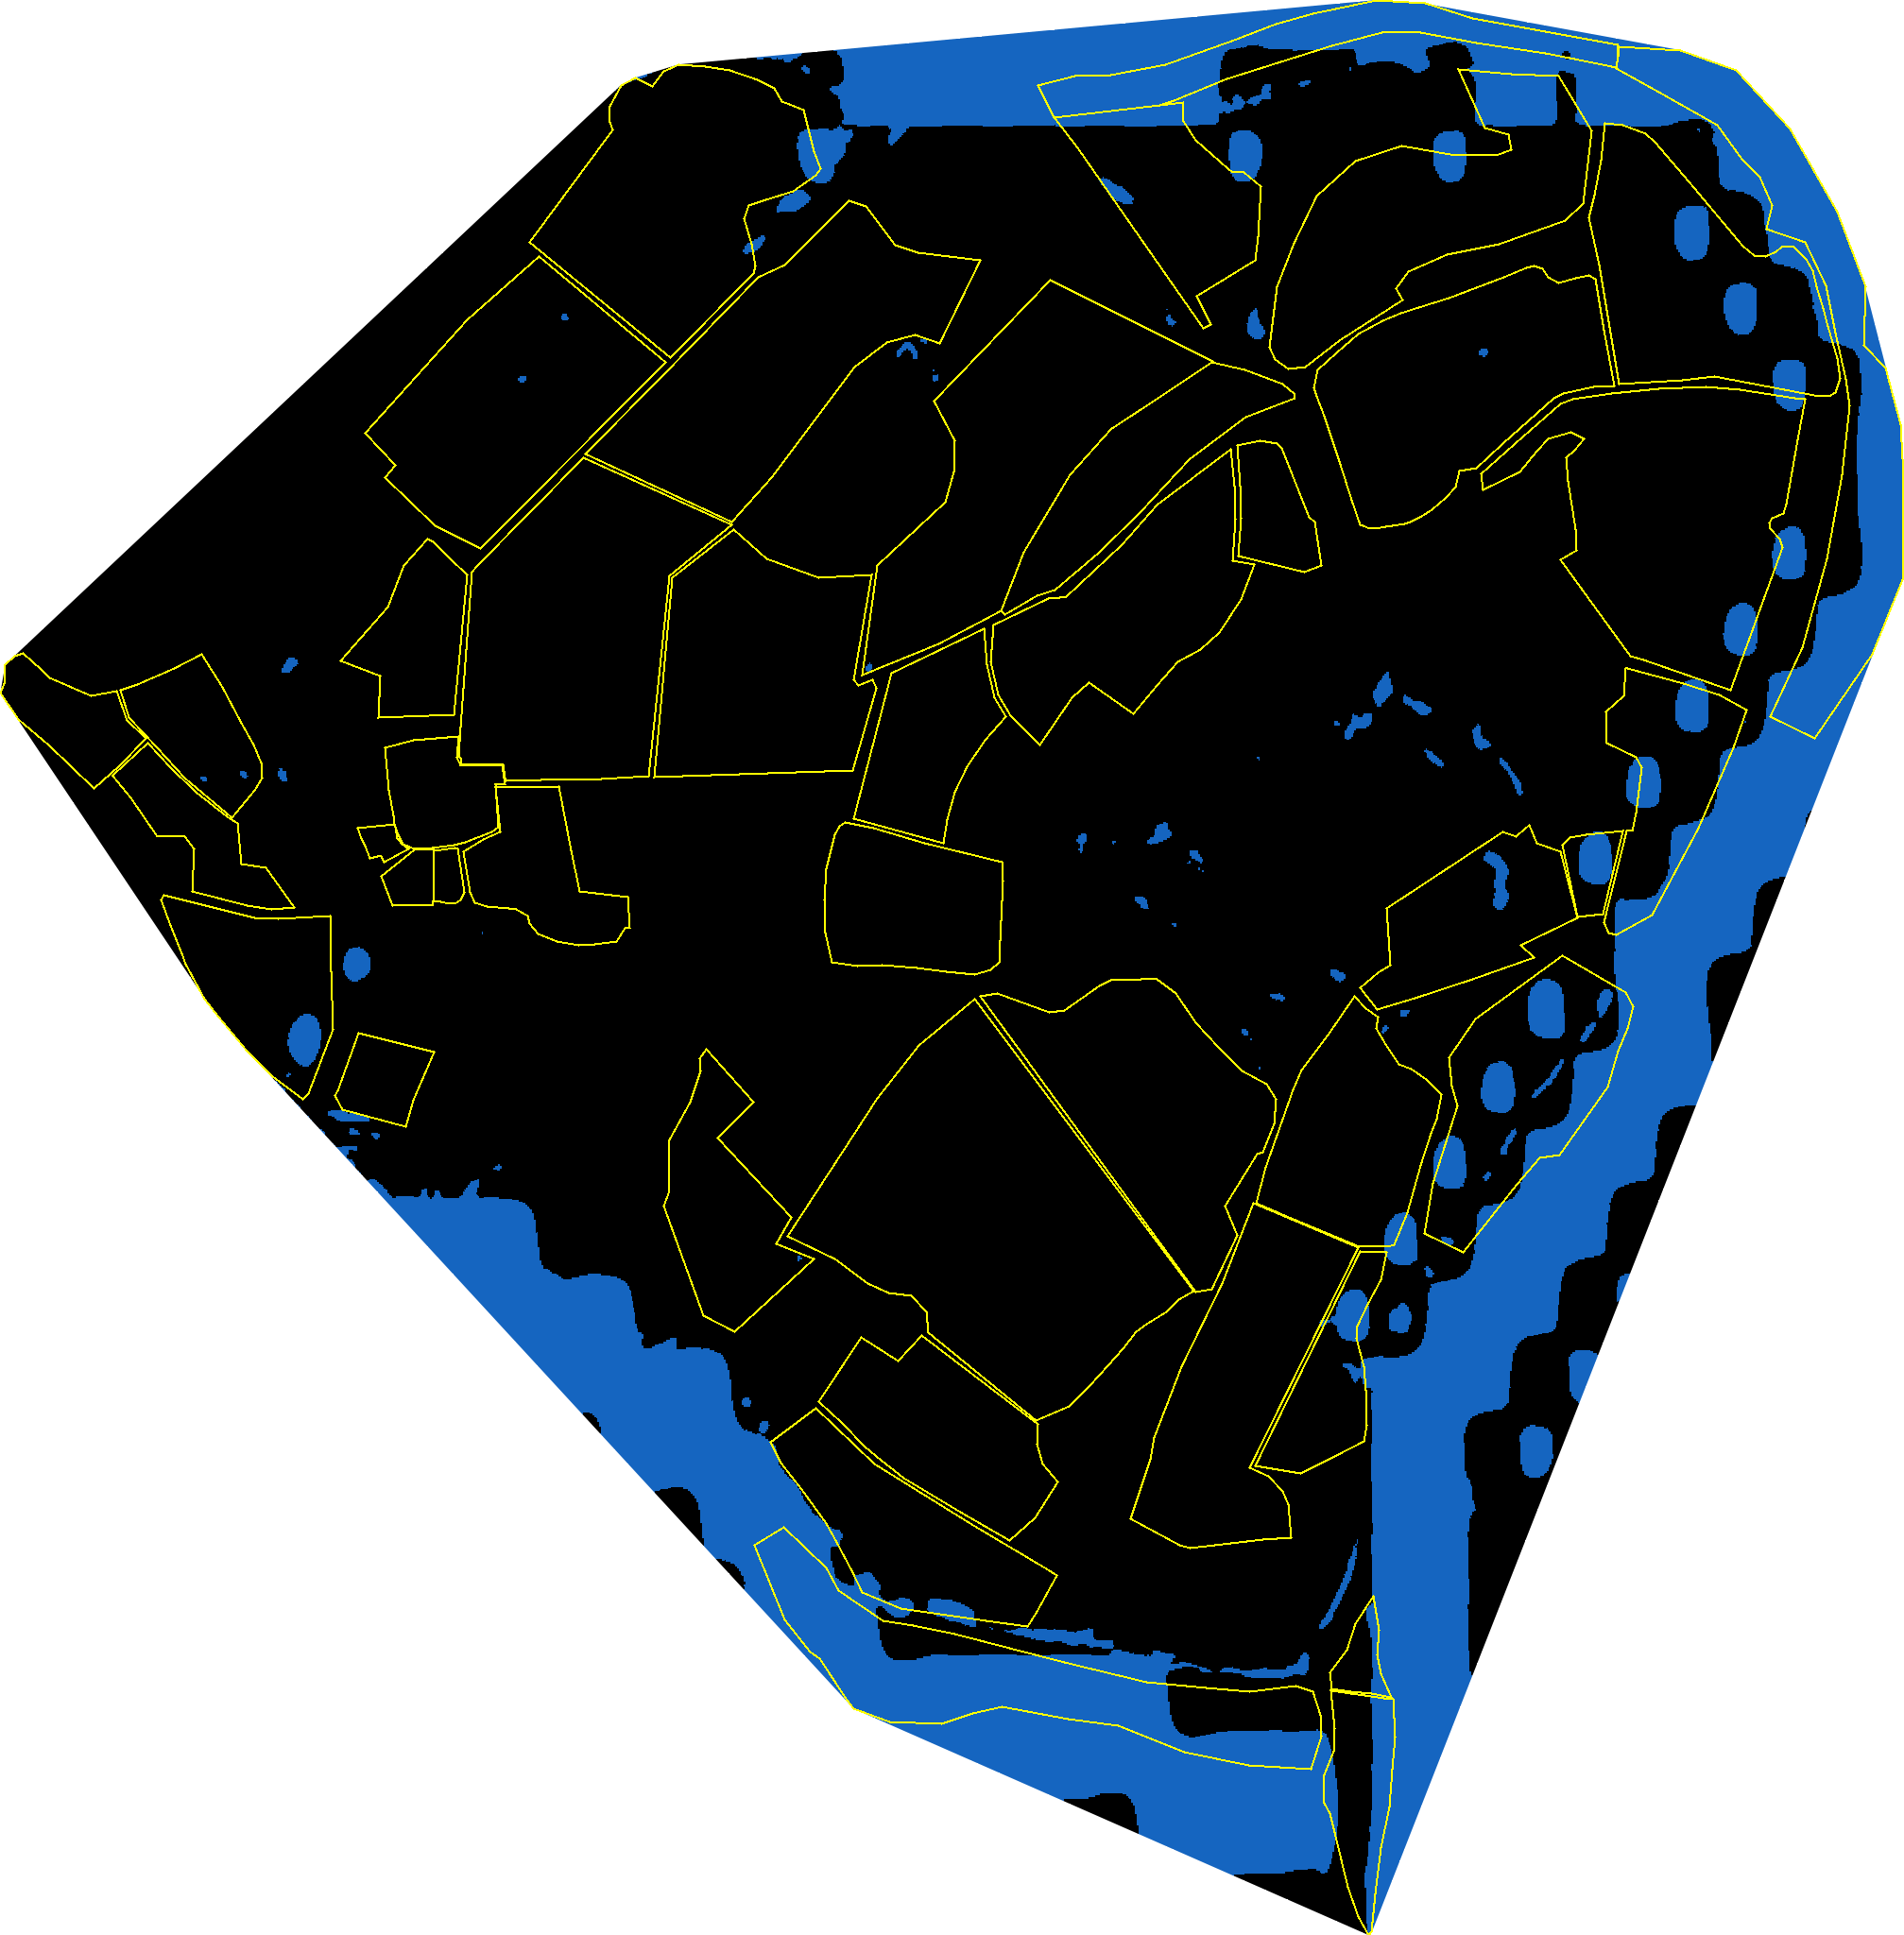
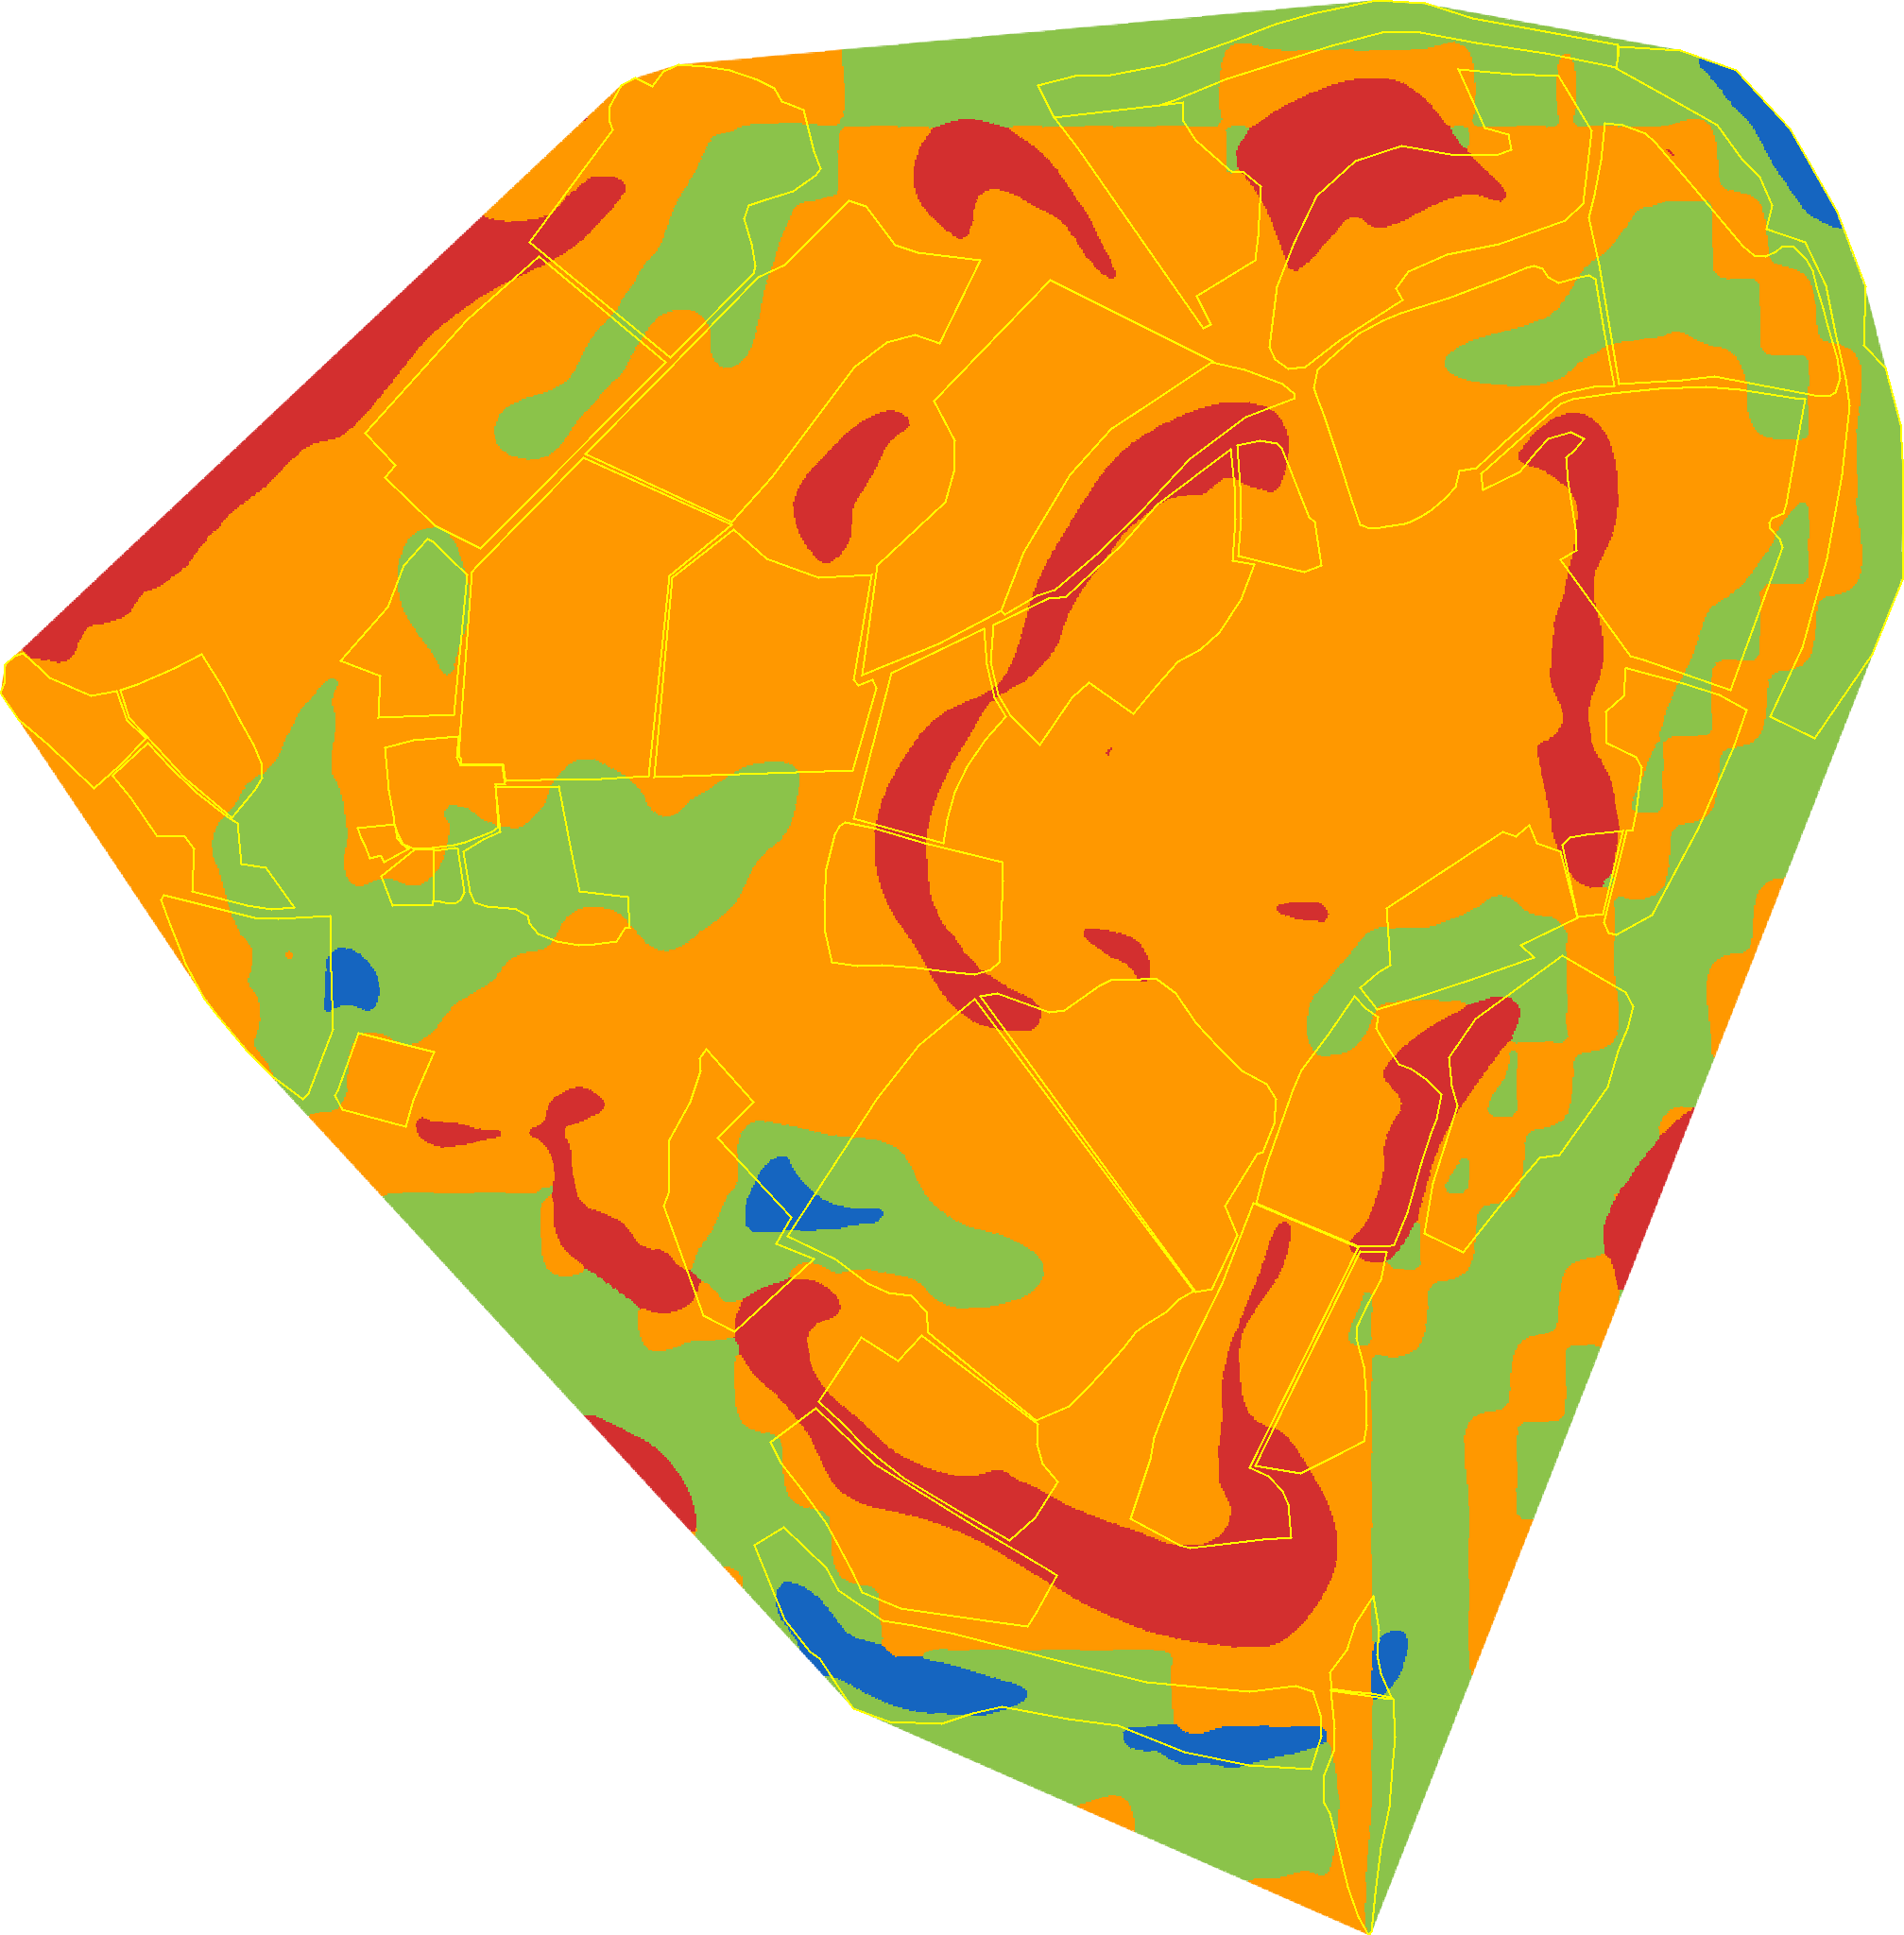
From the same elevation data EcoIntel works out how water moves across the farm, before you ever walk it in the rain.

And more: fifteen-plus map layers in the Atlas, sixty-plus signals across the system. See them all.

04 · Land health, read over time

The layers that also score the land

The same satellite record that draws the maps scores each field. EcoIntel reads greenness and structure week by week, weather-corrects it, and turns it into a Land Health Score from 1 to 9 and the four ecosystem processes, back to 2018.

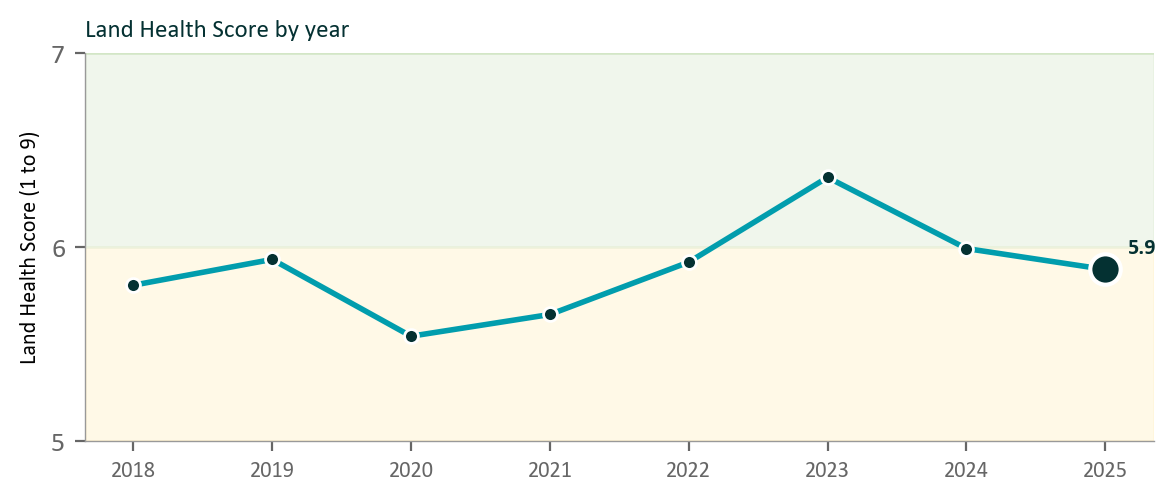
Land Health Score for Wilder Wood Farm by year from 2018 to 2025, plotted over the reference-state bands.
The Land Health Score over time. Wilder Wood, year by year from 2018 to 2025. It sits in the 5 to 6 band and ends near a Land Health Score of 6. Weather-corrected, so it reflects what management did rather than what the weather added.
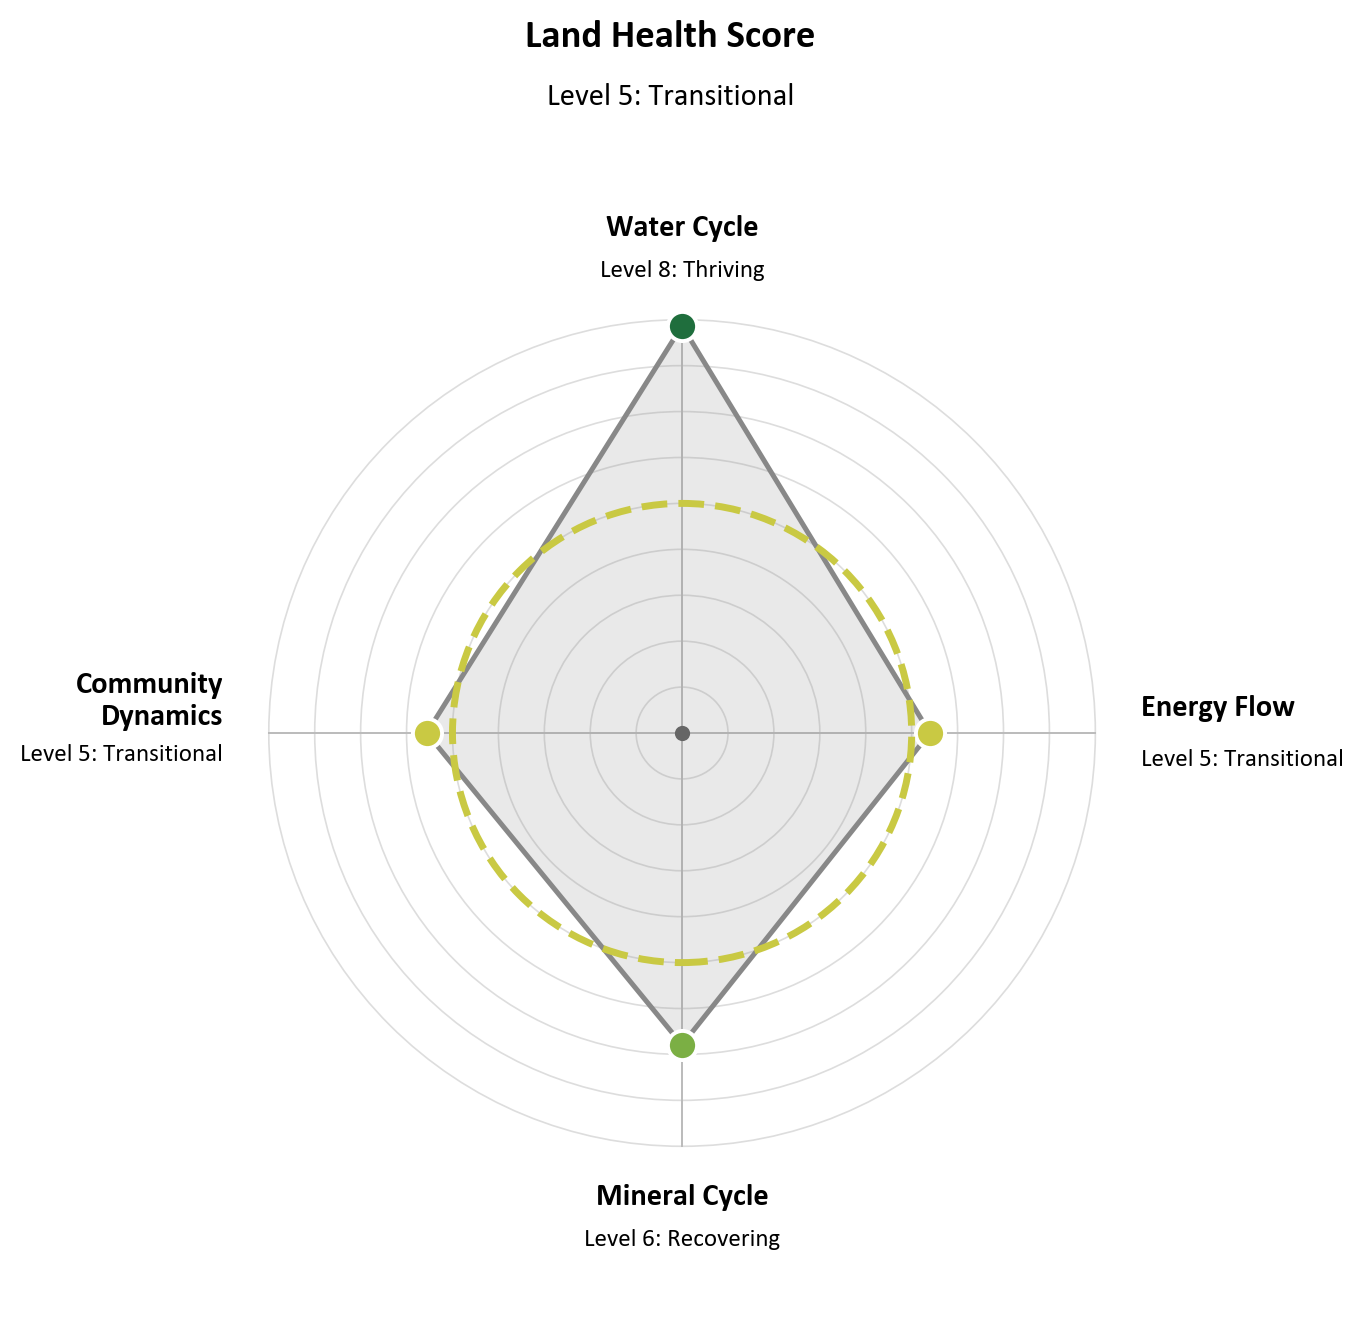
The four ecosystem processes for Wilder Wood as a kite: water, energy, minerals and community.
The four ecosystem processes. Water, energy, minerals and community. Community Dynamics is the shortest arm, so it is the weakest of the four and the one holding the score back.
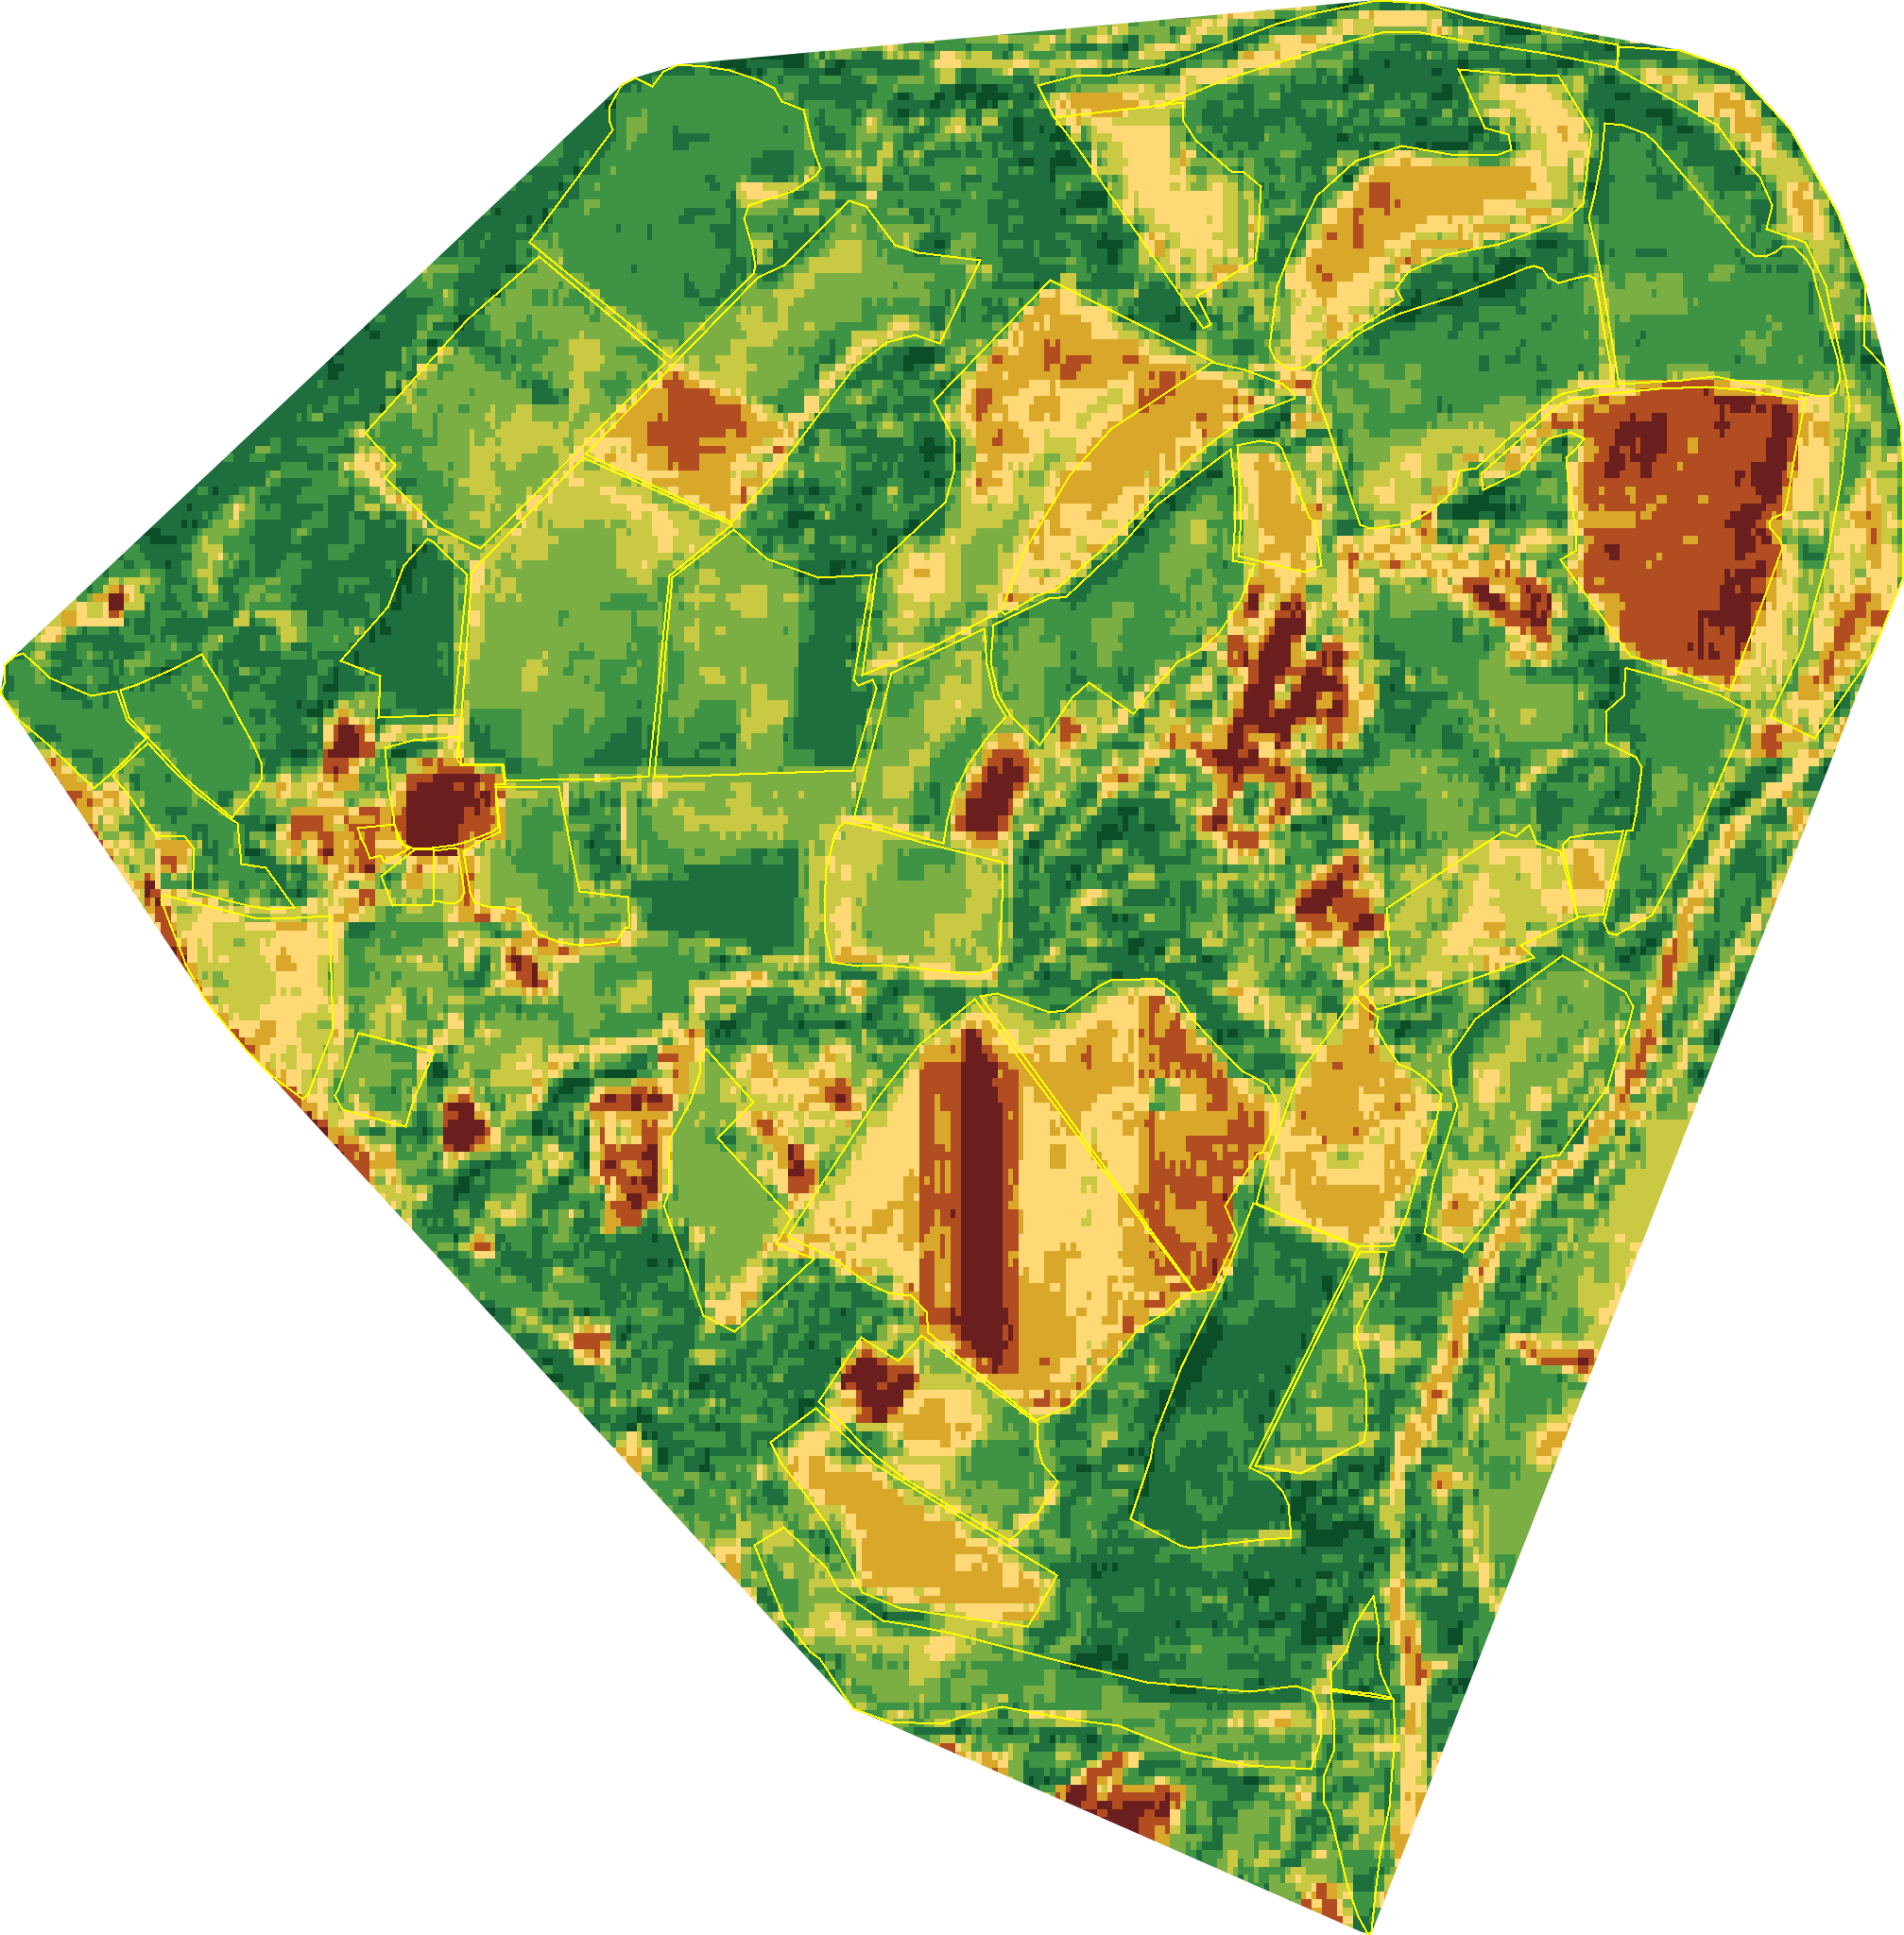
Land Health Score across Wilder Wood in 2018, mapped at 10 m.
2018. Every field scored 1 to 9, mapped at 10 m.
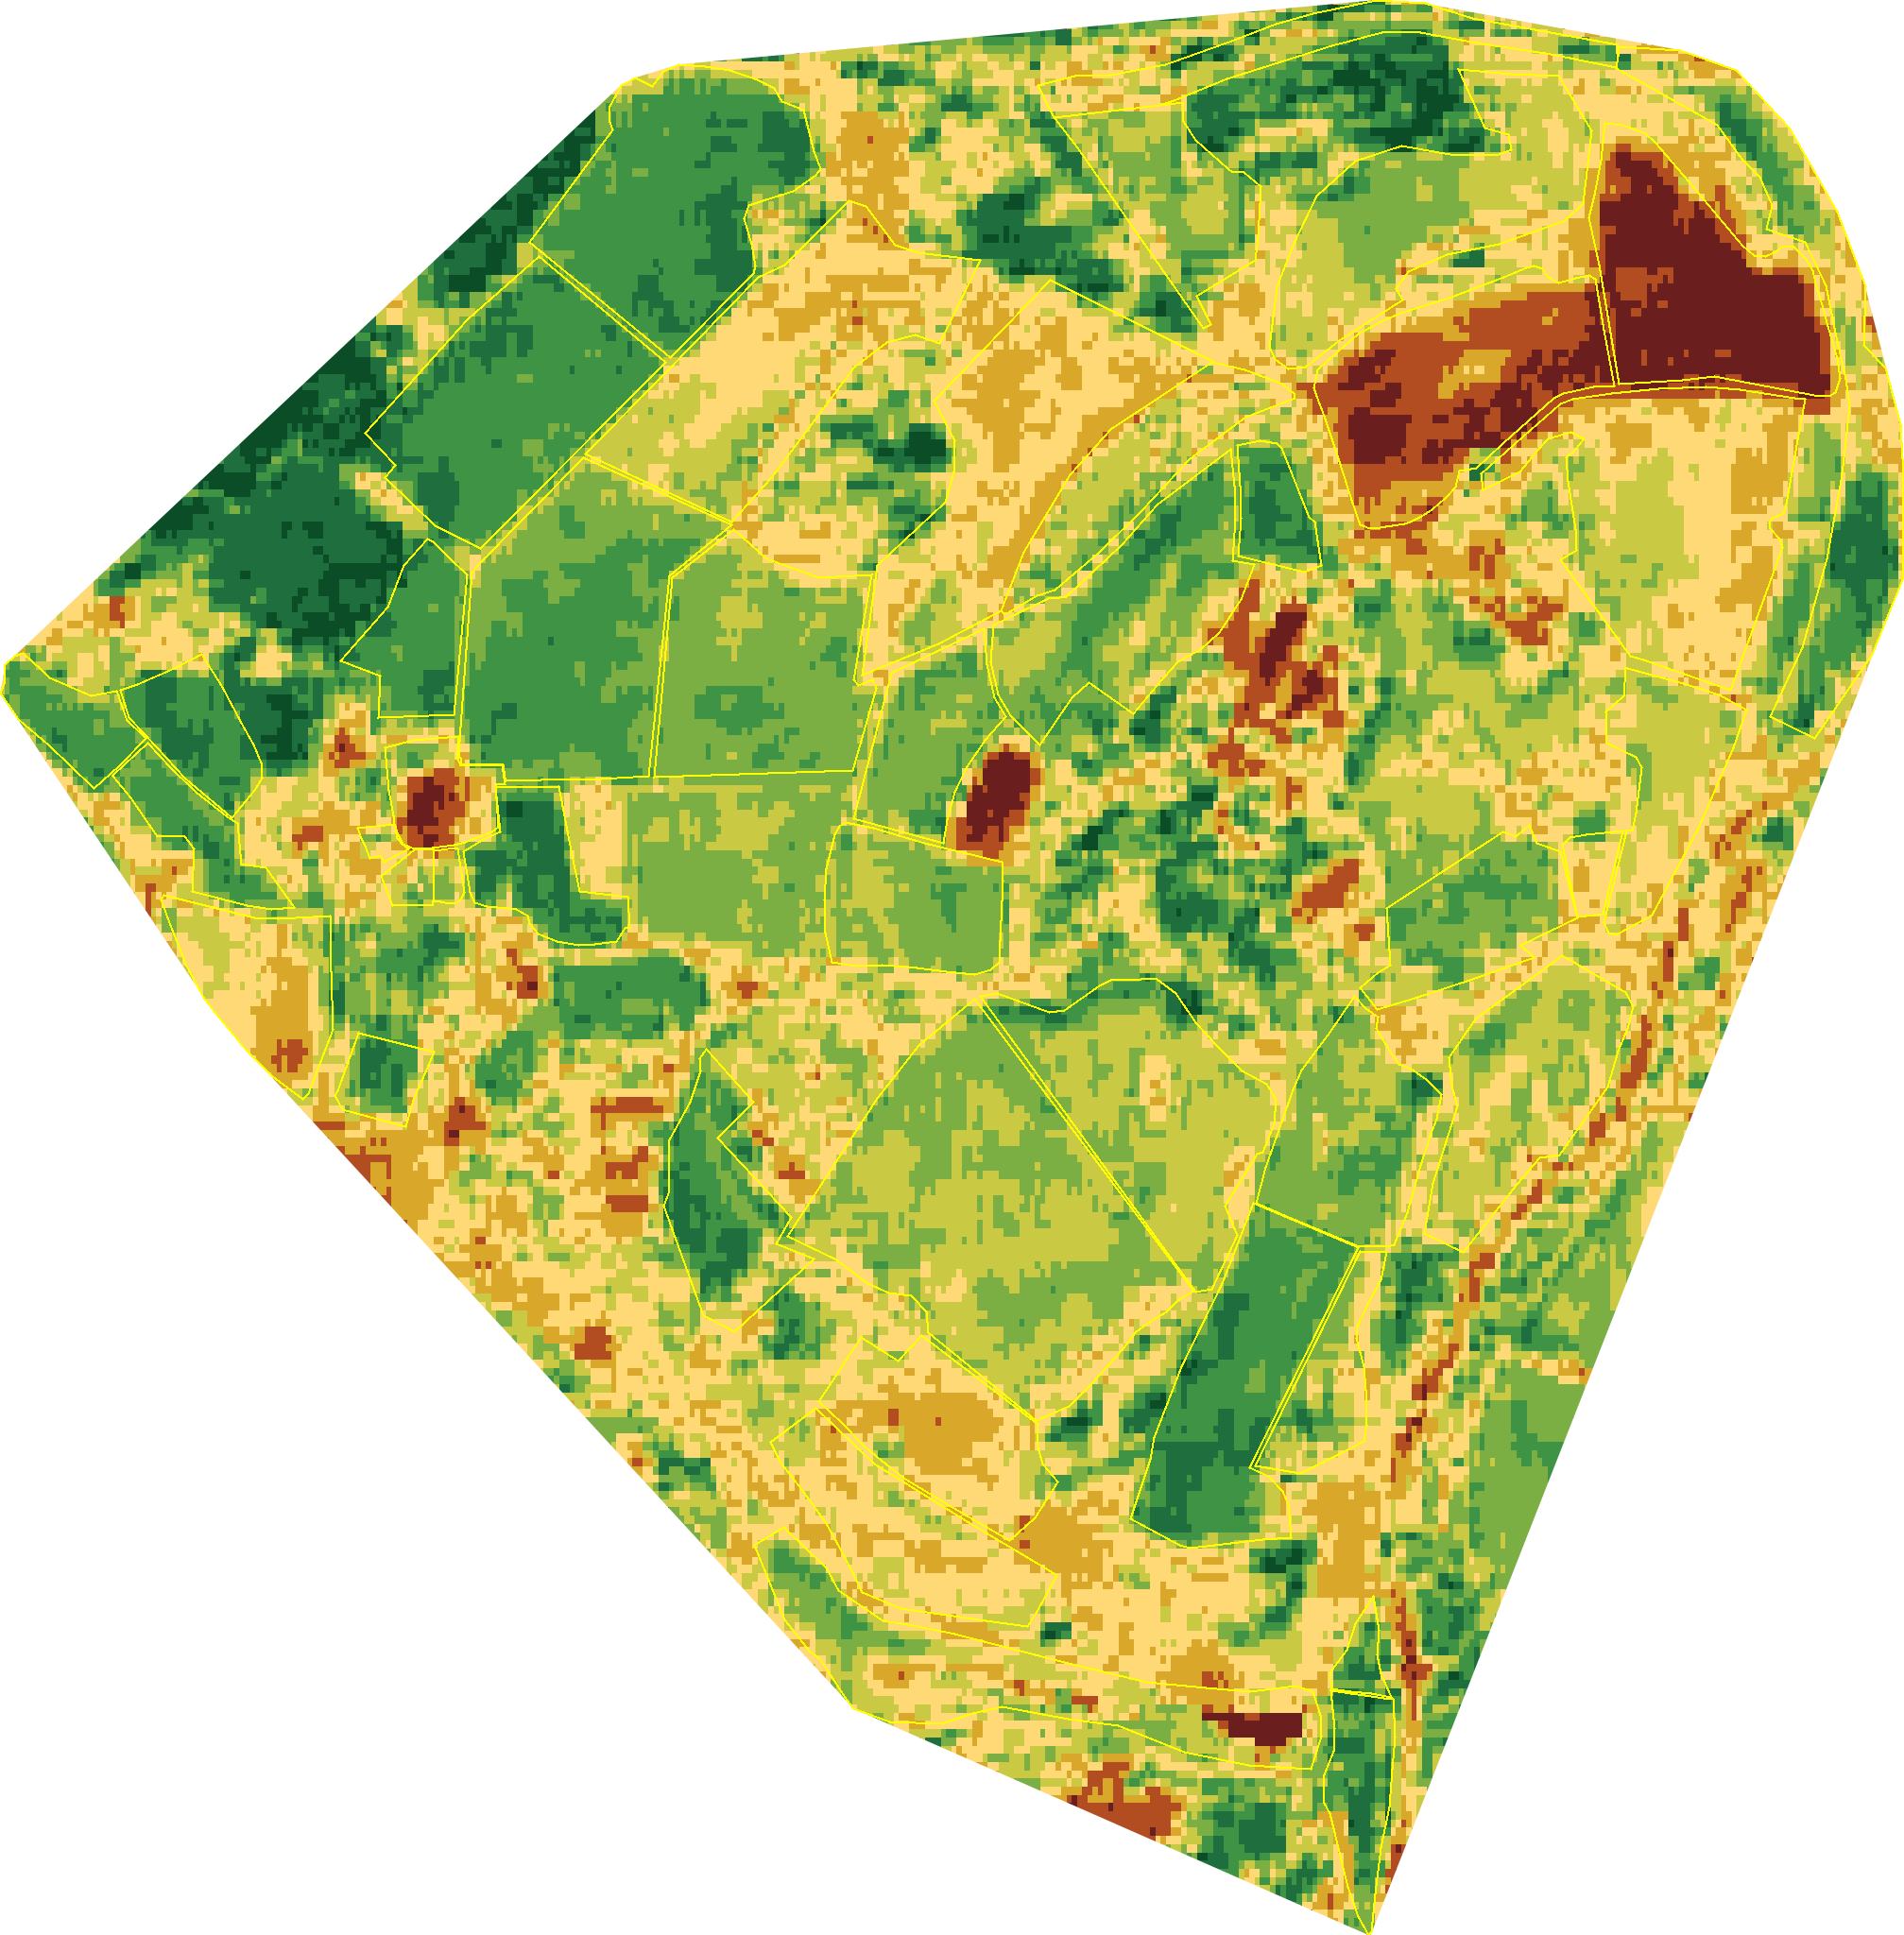
Land Health Score across Wilder Wood in 2025, mapped at 10 m.
2025. The same map, eight years on, shows which fields climbed and which slipped. See all eight years.

05 · What was done, week by week

EcoIntel sees grazing and mowing from space

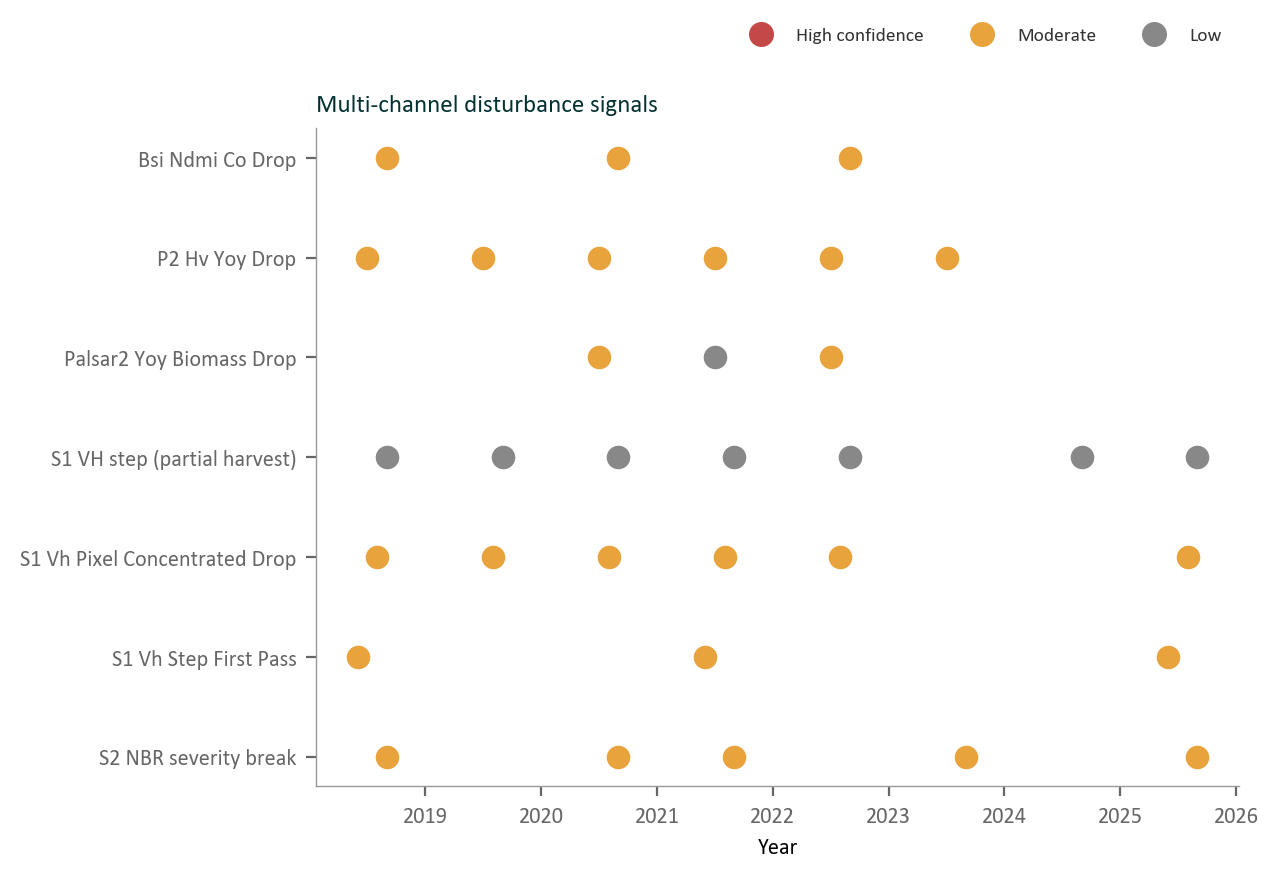
A step drop in the Sentinel-1 radar signal marks a likely grazing or mowing event. EcoIntel logs them week by week and measures how many weeks each field takes to recover its biomass afterwards. Hay cuts and grazing look similar from space, so you confirm what was done; the timing comes from the satellite.

Multi-channel disturbance signals for Wilder Wood from 2018 to 2026: radar step drops and biomass breaks marking likely grazing, mowing and harvest events, coloured by confidence.
Wilder Wood, 2018 to 2026. Each dot is a detected event; the radar step-drop rows pick up grazing and mowing, coloured by confidence.

06 · What makes it different

Two things you will not get elsewhere

You do not build it yourself

You could pull elevation data, run hillshade and wetness in QGIS, load Sentinel imagery in Google Earth, then reproject and style each layer by hand. That takes GIS skills and hours per farm. EcoIntel does all of it for you and keeps it current, so you spend your time reading the land instead of preparing it.

The layers also score the land

Other farm maps draw the land and stop there. EcoIntel reads the same layers to score each field on the four ecosystem processes and to give it a Land Health Score from 1 to 9. The map you browse for planning and the diagnosis you act on run on one set of layers.

07 · A worked example

Were the cattle out too early?

What if, for every field and parcel on your farm, you had its aspect, its winter and summer shade fractions, its slope and its Topographic Wetness Index, the week it starts growing and the week it peaks, radar detection of every grazing and mowing event and the recovery time that followed, and its water and energy cycles quarter by quarter, all read from satellite and elevation data and ready the moment you open the map, to build the grazing plan that works for the cattle and for the ecosystem? EcoIntel reads all of it for you, for every field, at once.

That is exactly what the report's Field Seasonal Profile does. Here is how it works on Wilder Wood.

Start with the ground that does not change. The winter hillshade and the aspect layer show which fields face north and sit in shade and which face south and catch the sun. The Topographic Wetness Index shows which hold water and which drain. A north-facing, shaded, wet field is the cold, slow-to-warm one; a south-facing, dry field warms and grows first.

Now add time. For every field, EcoIntel reads the week it starts growing in spring, the week its biomass peaks, and how long its season runs. It ranks the fields by green-up, so the earliest south-facing fields are ready for the first spring graze, and the cold shaded fields are the ones that need to wait and need the longest rest.

Then it reads what happened. EcoIntel picks up grazing and mowing from radar and measures how many weeks each field took to recover afterwards. When a cold, slow-to-warm field is grazed early and then peaks late or recovers slowly, that is the sign it was grazed before it was ready, and its growth stayed low for the rest of the season. On Wilder Wood the report says it plainly for a real field: an east-facing field on cooler ridge ground greens up in the second half of the spring window, and grazing it too early costs energy capture for the rest of the year.

It becomes a turnout order. Start the spring rotation on the early south-facing fields, hold the cold shaded ones for later and give them the longest rest, and move stock to the wetter, cooler fields when the free-draining ground dries out in summer. The report flags a field grazed too often for its recovery. You and your advisor make the turnout call and confirm what happened on the ground; EcoIntel supplies the readiness order, the recovery times and the reasoning.

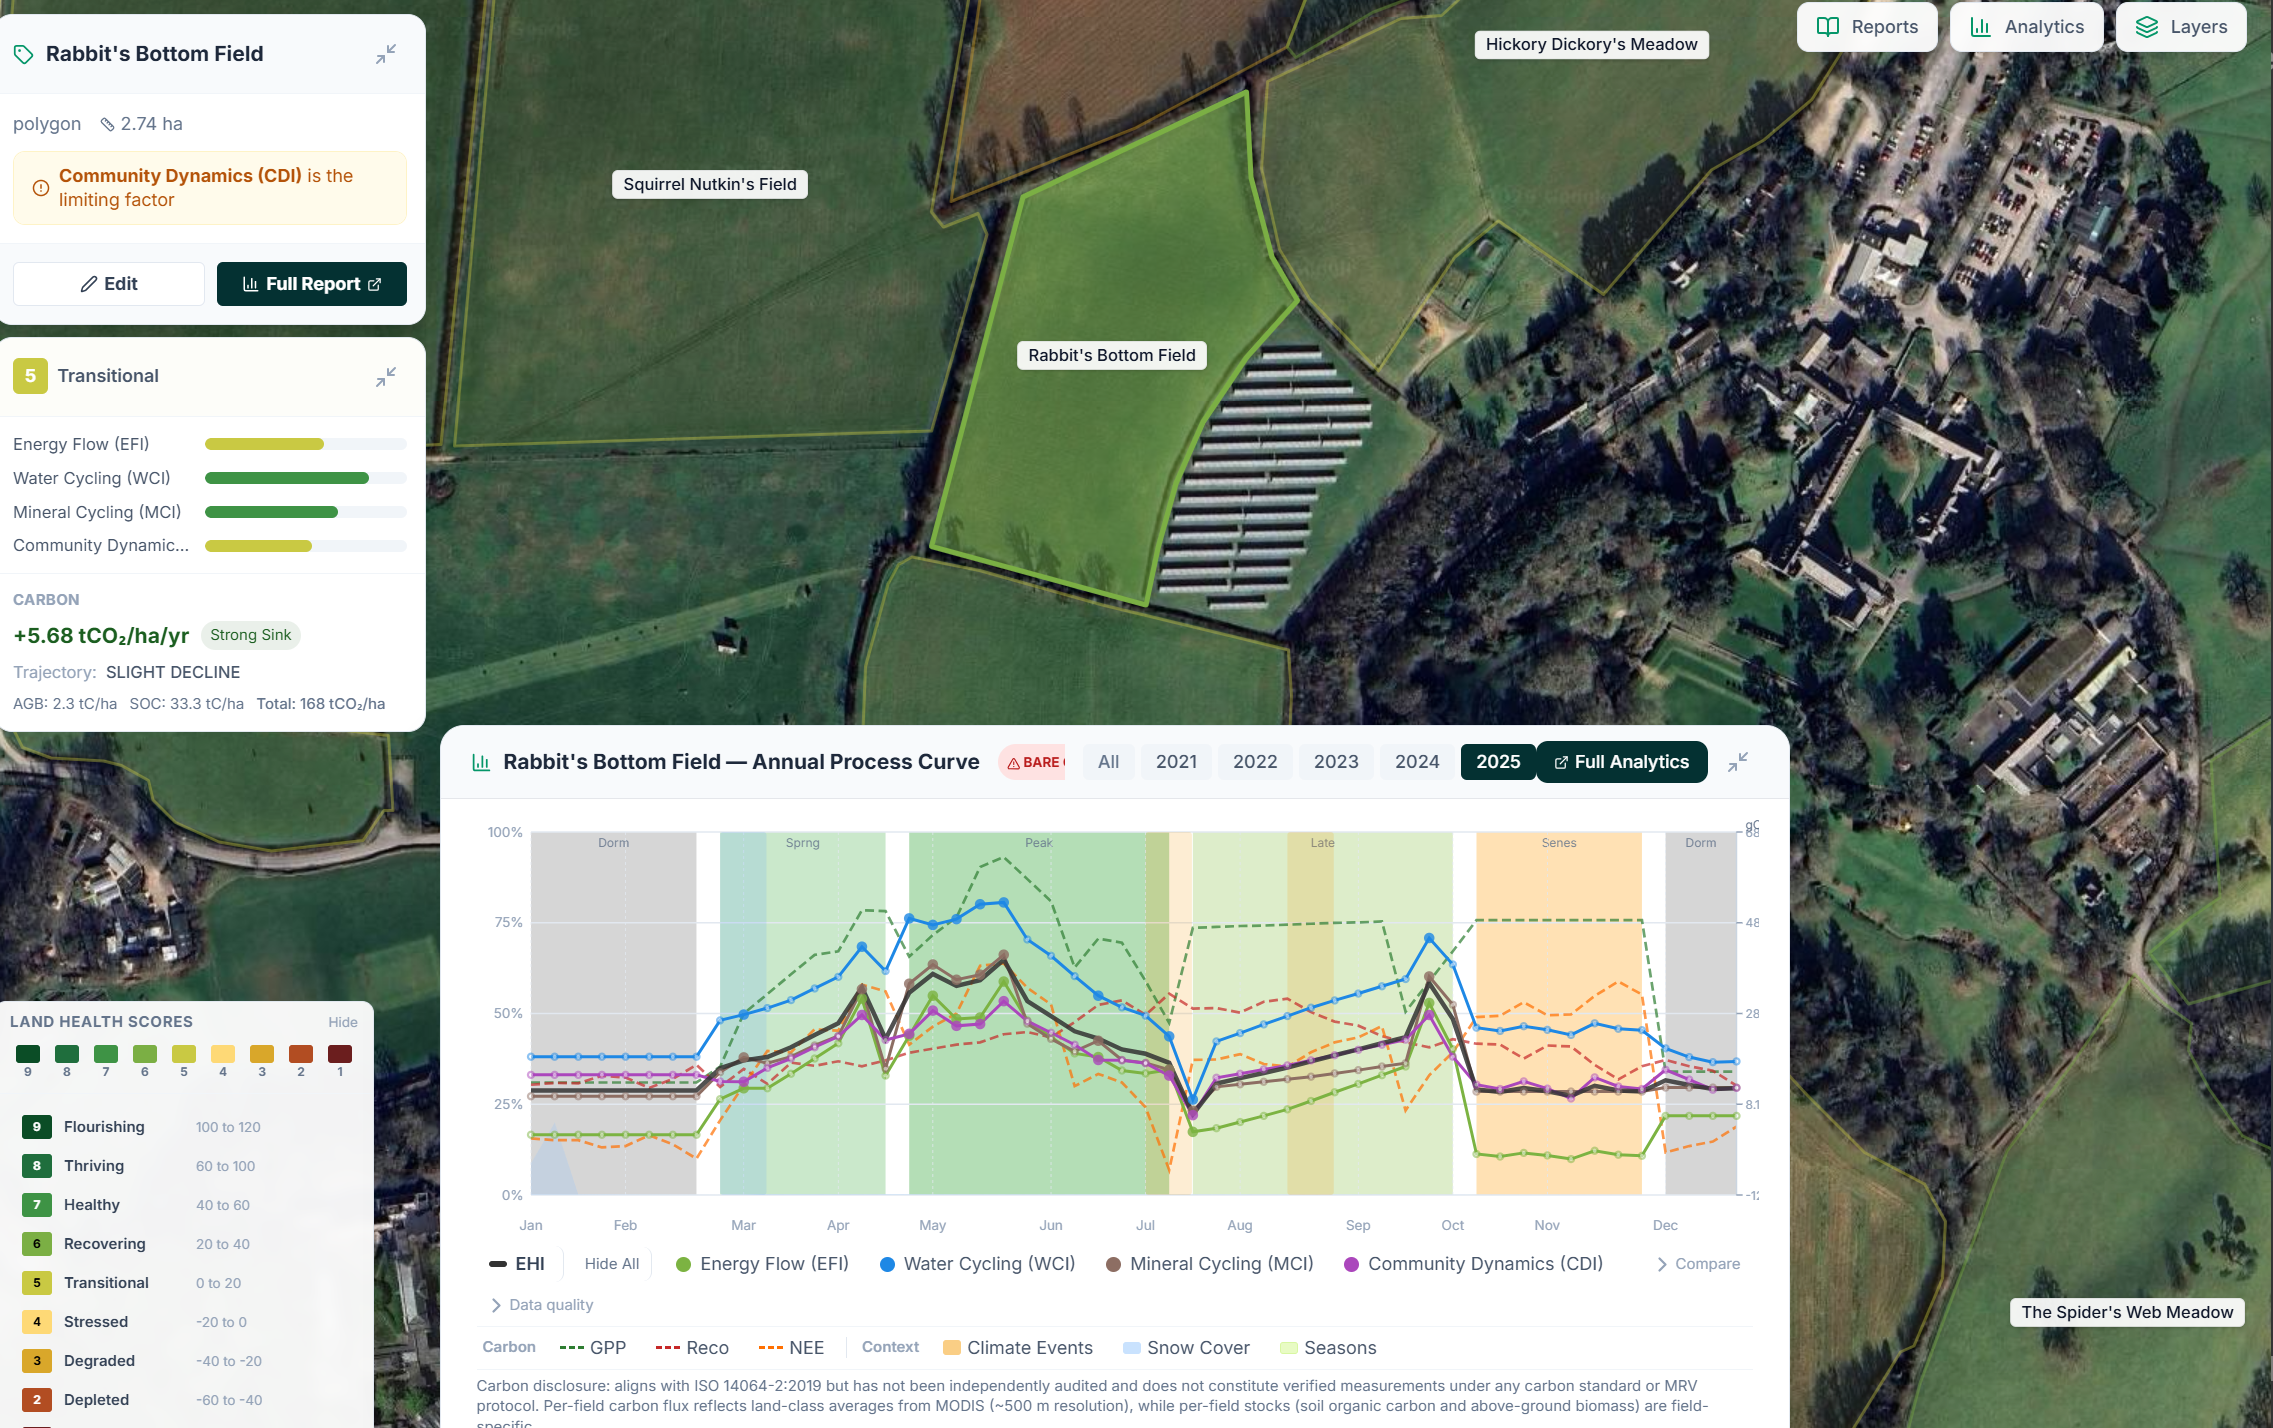
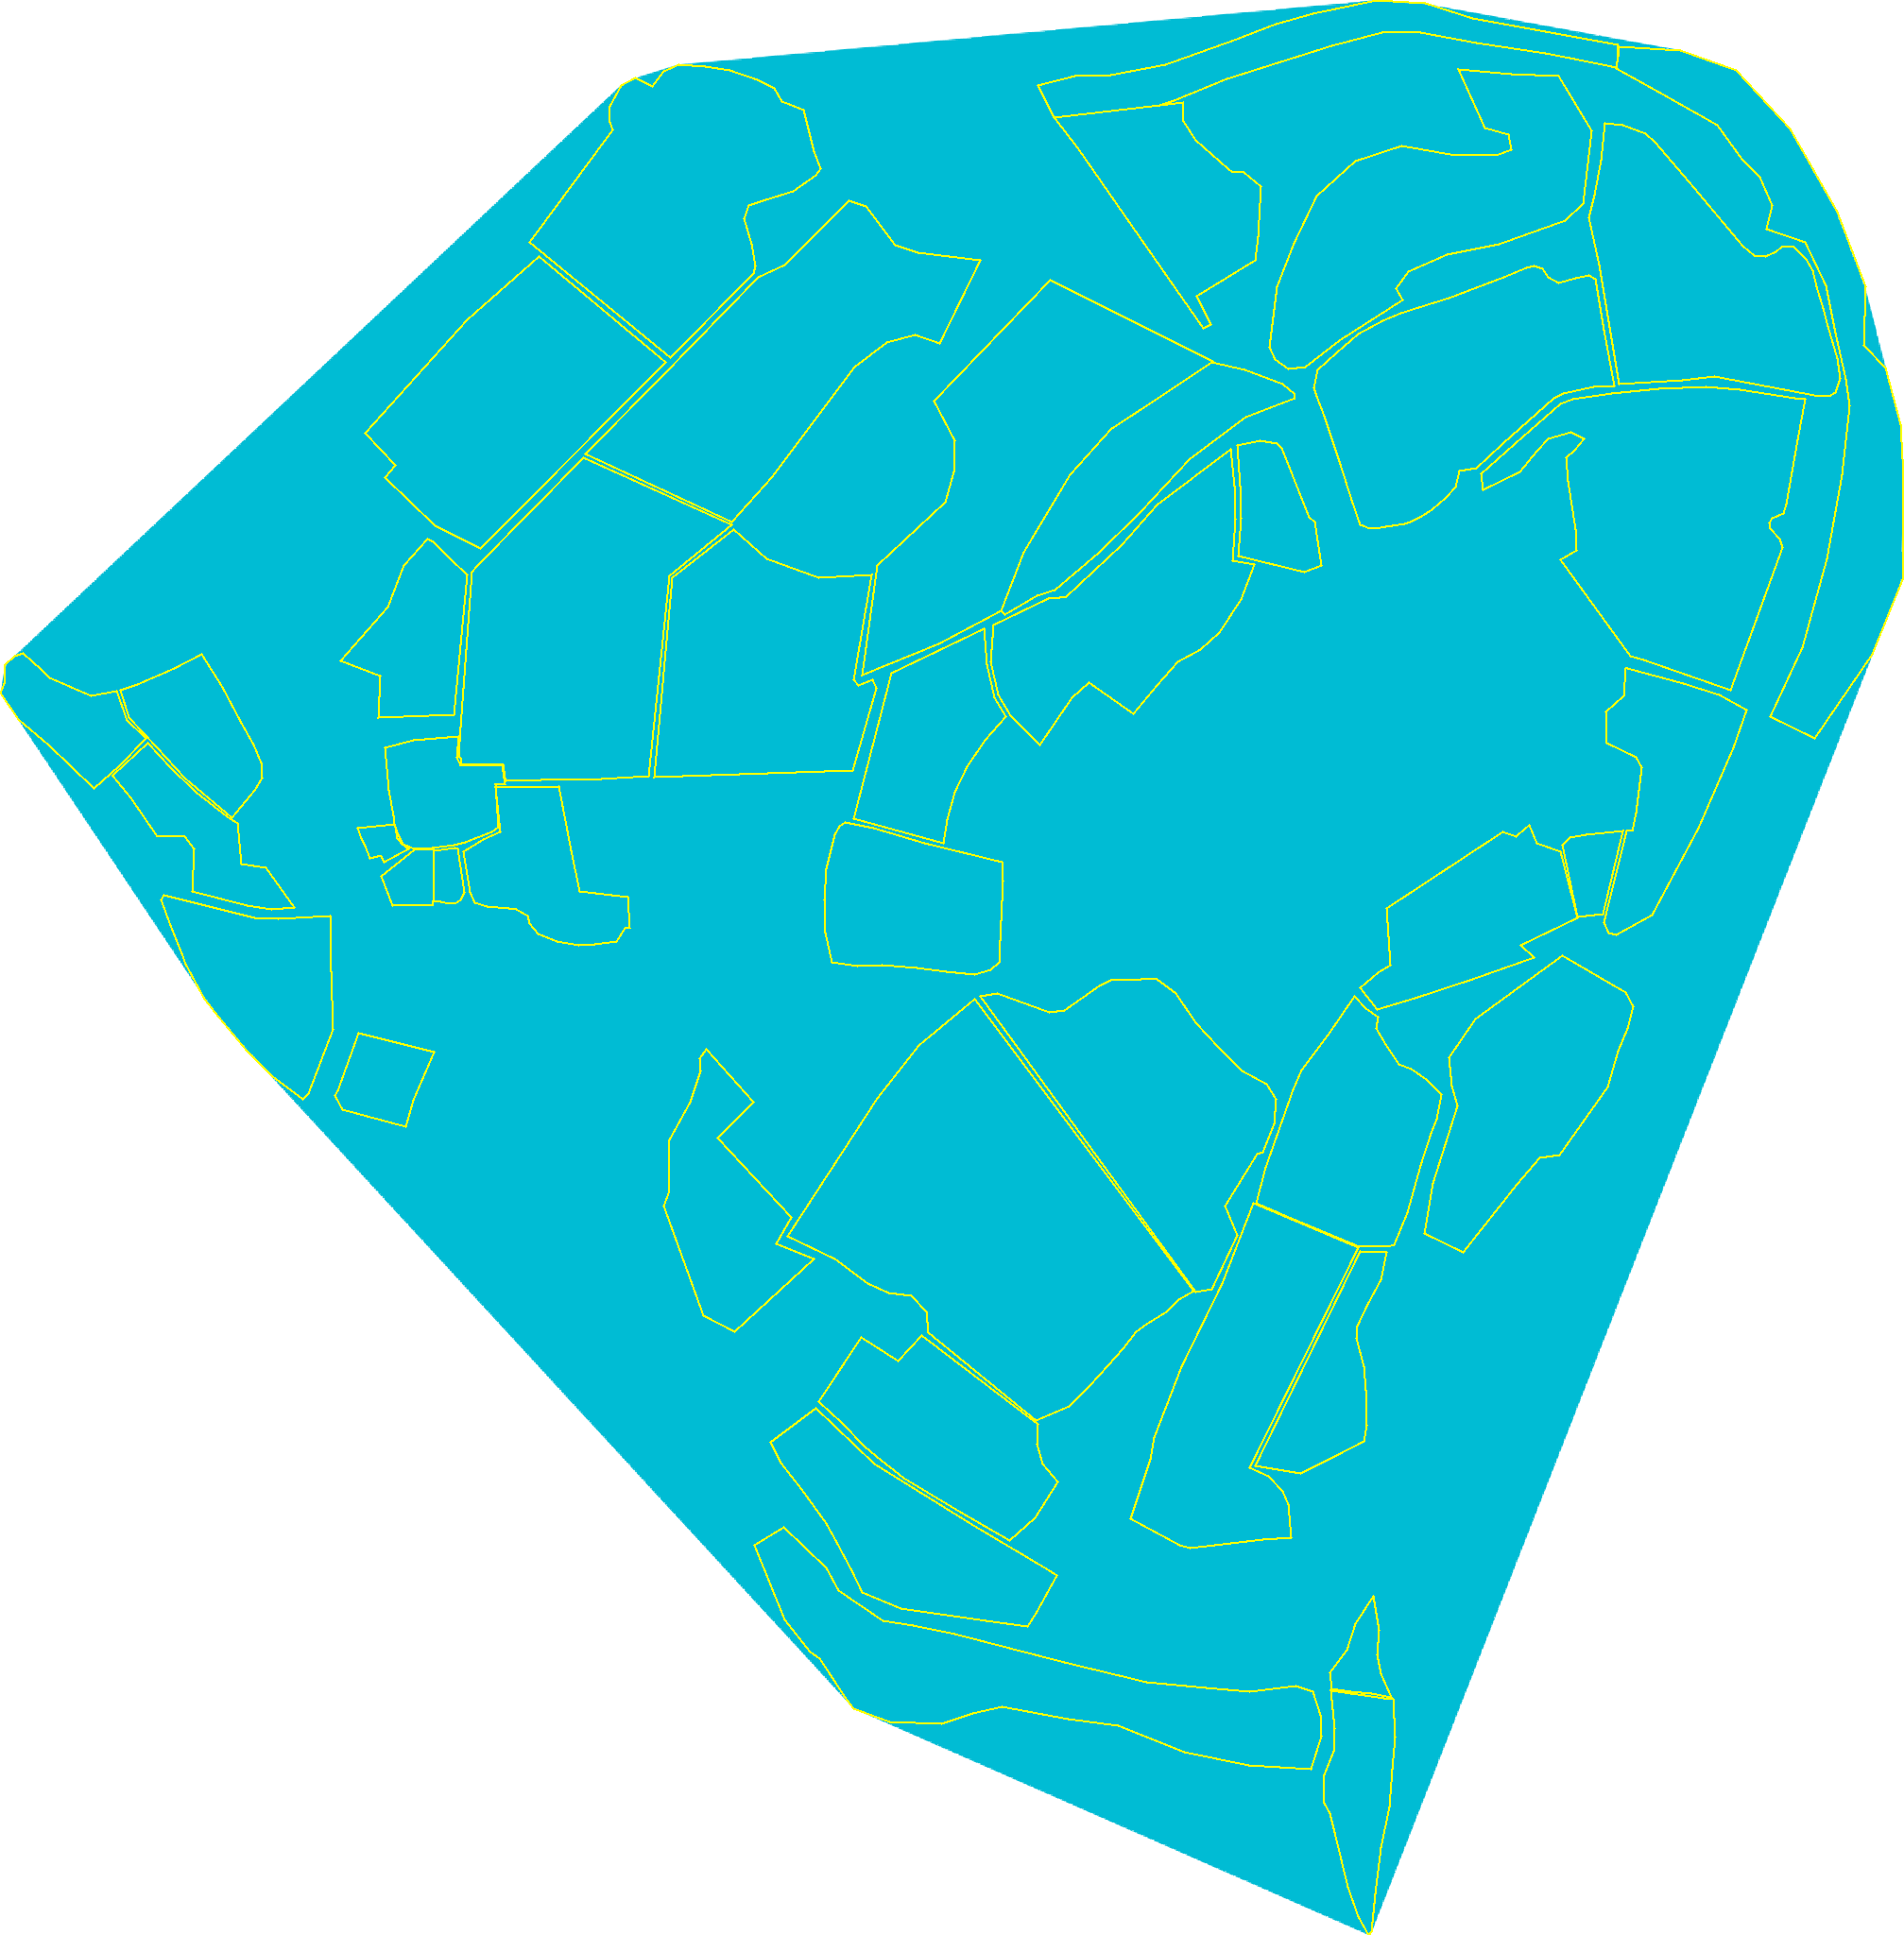
Winter hillshade: which fields sit in cold shade. Topographic Wetness Index: which fields hold water. Land Health Score over time. Radar-detected grazing and mowing events over time.
Wilder Wood Farm. The Land Health Score is calibrated on grassland and pasture, which is where this reasoning is strongest. EcoIntel detects likely grazing and ranks each field's readiness and recovery; you decide the dates and stocking and confirm what was done.

See it on your own land

The quickest way to understand this is to open it on our Wilder Wood Farm demo, no card needed.