
Deep Knowledge
Stack the map layers to understand your land
EcoIntel puts every map layer of your farm in one place: hillshade, wetness, slope, aspect, keyline zones and the Land Health Score over time.
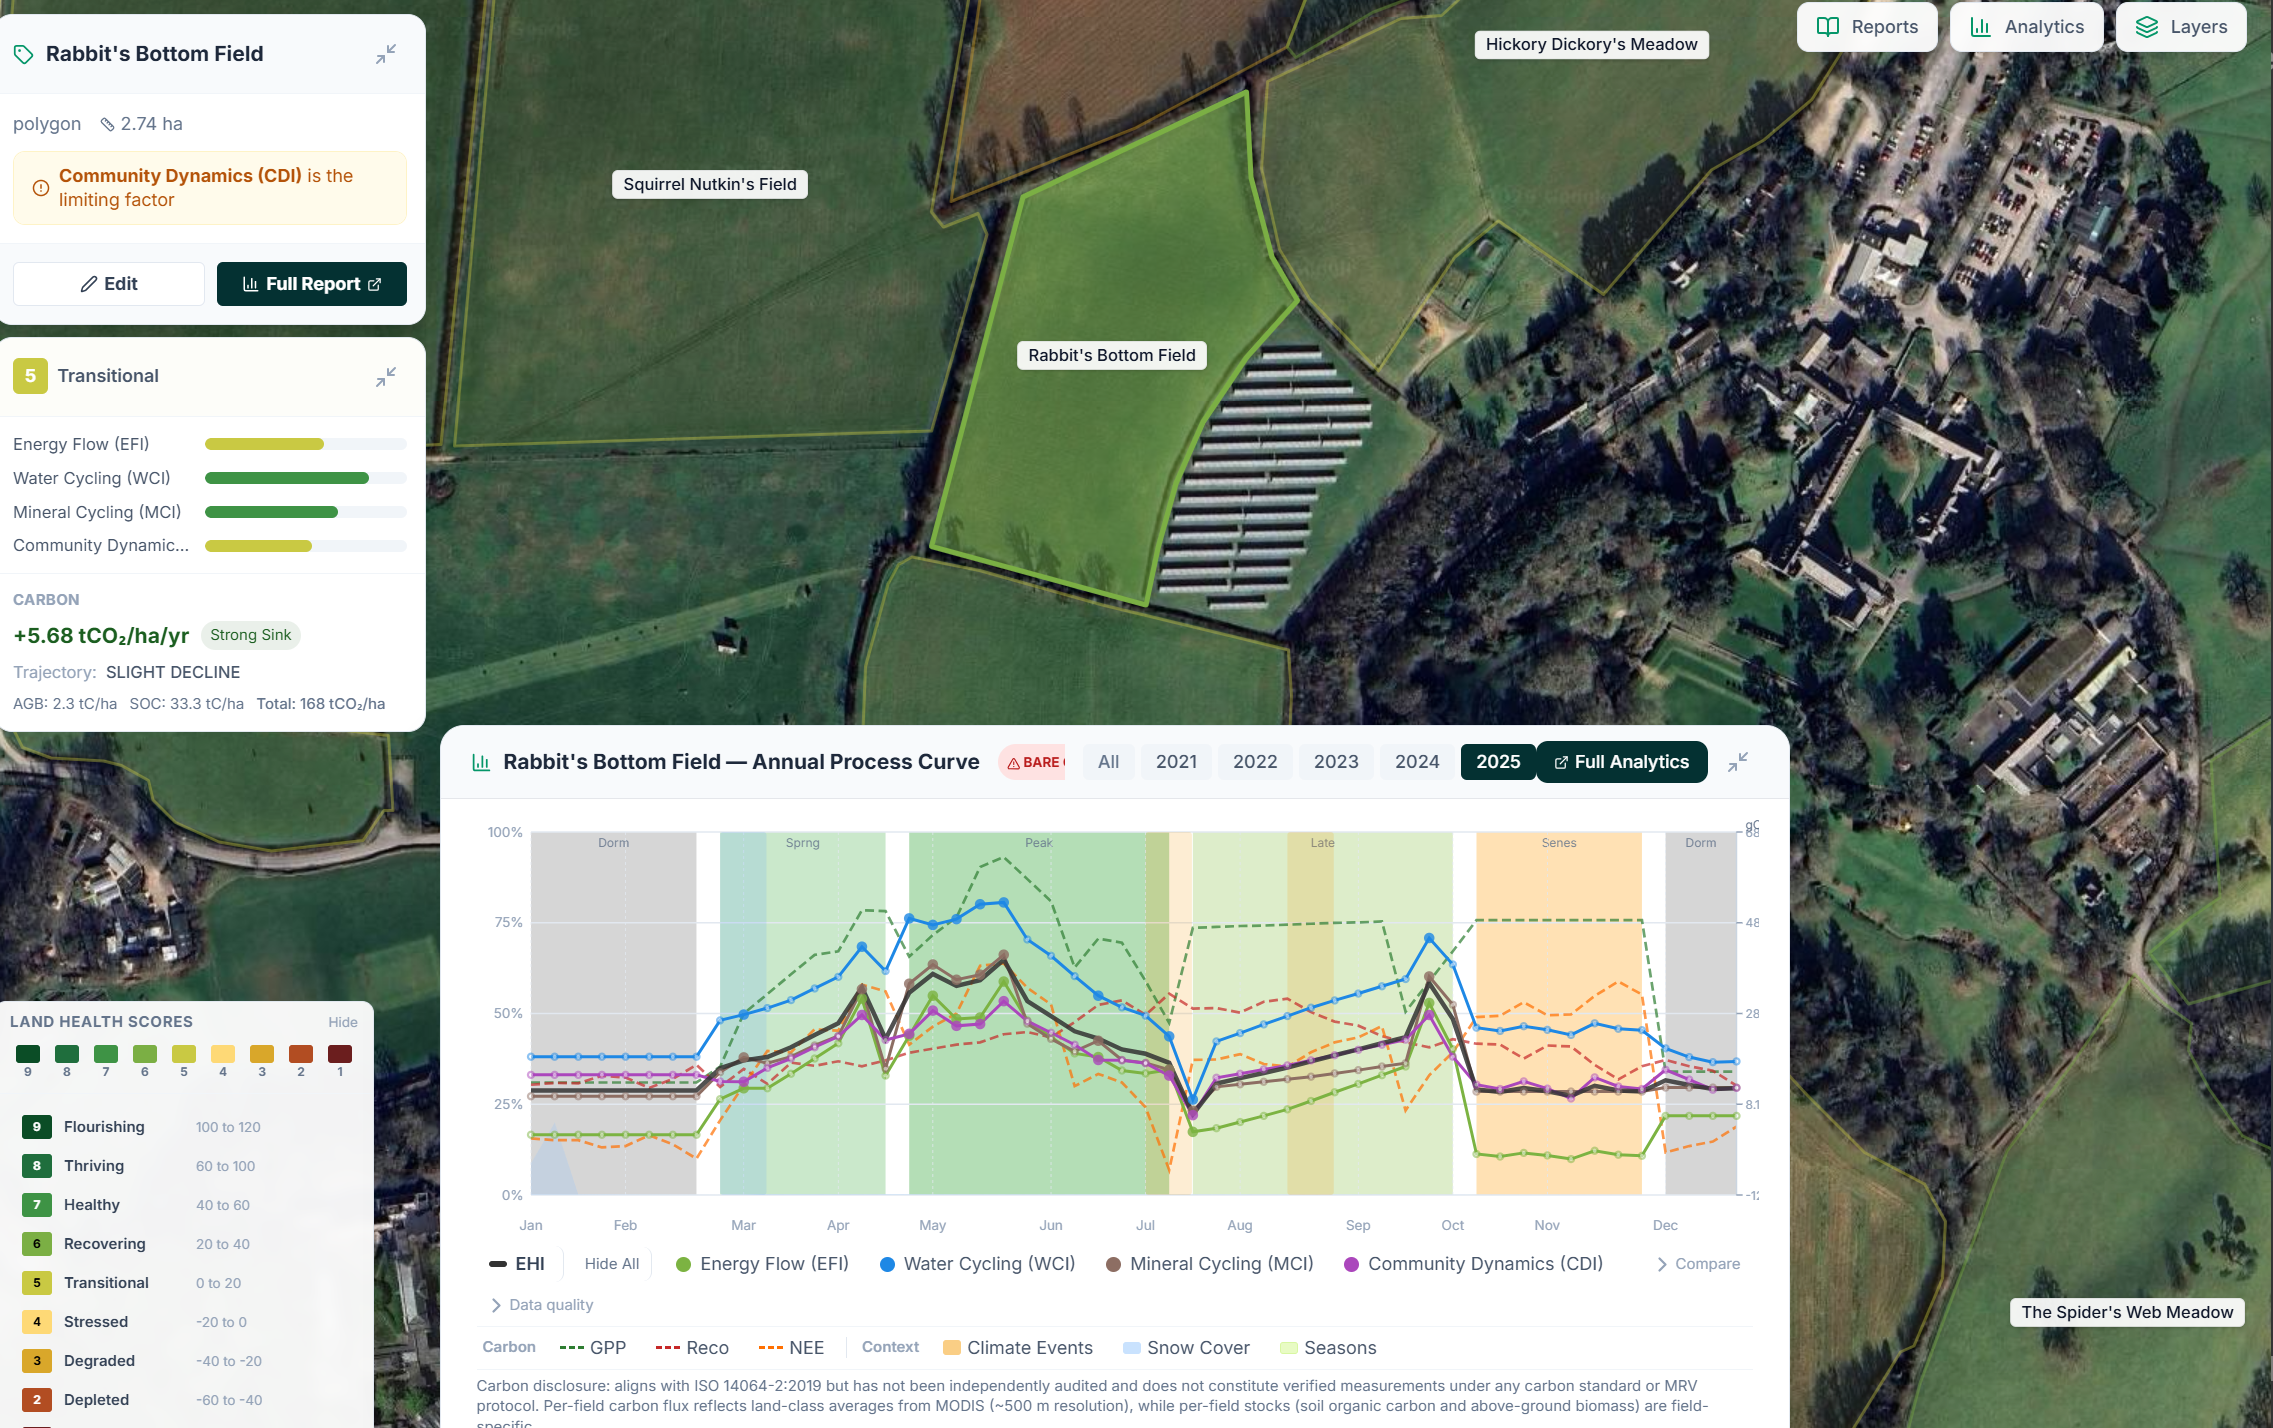
The problem: the good layers are scattered, so most people never look
Everything you need to understand a farm already exists as data. Public elevation models show every slope and hollow. Satellites pass over every few days and record how green each field is, week by week, back to 2018. From those two sources you can work out where water collects, which slopes face the sun, where the cold wet ground sits, and how each field has grown and recovered year on year.
The trouble is that these layers live in different places and different tools. Elevation sits in one dataset, satellite imagery in another. To turn them into maps you can read, you need GIS software, the right data, and the patience to reproject and style each layer by hand. That is a job for a specialist, and it takes hours for a single farm. So most land managers never see these layers at all, or they see one at a time, in a tool they had to learn.
EcoIntel builds every layer for you, styles it, and puts it on one screen. You do not download anything. You do not learn a mapping package. You open a field and read it. This article explains what the layers are, why reading two or three together is where the real value sits, and how the same layers that show you the land also score its health.
What a map layer actually is
A map layer is one view of your land that pulls out a single thing and shows it clearly. Here are the ones that matter most, in plain terms.
Hillshade shades the land as if the sun were low in the sky, so every bank, terrace, gully and old earthwork stands out. Run it with a winter sun angle and you see the shape of the ground the way frost and shade actually fall on it. Run it with a summer sun and you see it the way growth sees it.
Slope shows how steep each patch is. Aspect shows which way each patch faces: north, south, east or west. A north-facing slope stays colder and wetter and starts growing later in spring; a south-facing slope warms first.
Contours are the lines that join points at the same height. They are the reference for any track, fence, water line or tree row you want to set on the level.
The Topographic Wetness Index, or TWI, works out where water collects and where it sheds, from the shape of the ground. The wet corners and the dry ridges show up on the map before you ever walk them in the rain.
Keyline zones divide the farm into bands from ridge to valley that behave the same way for water and temperature. Valley and ridge networks trace the natural drainage lines and the high ground, which is where ponds, buffers and tree planting tend to pay back most.
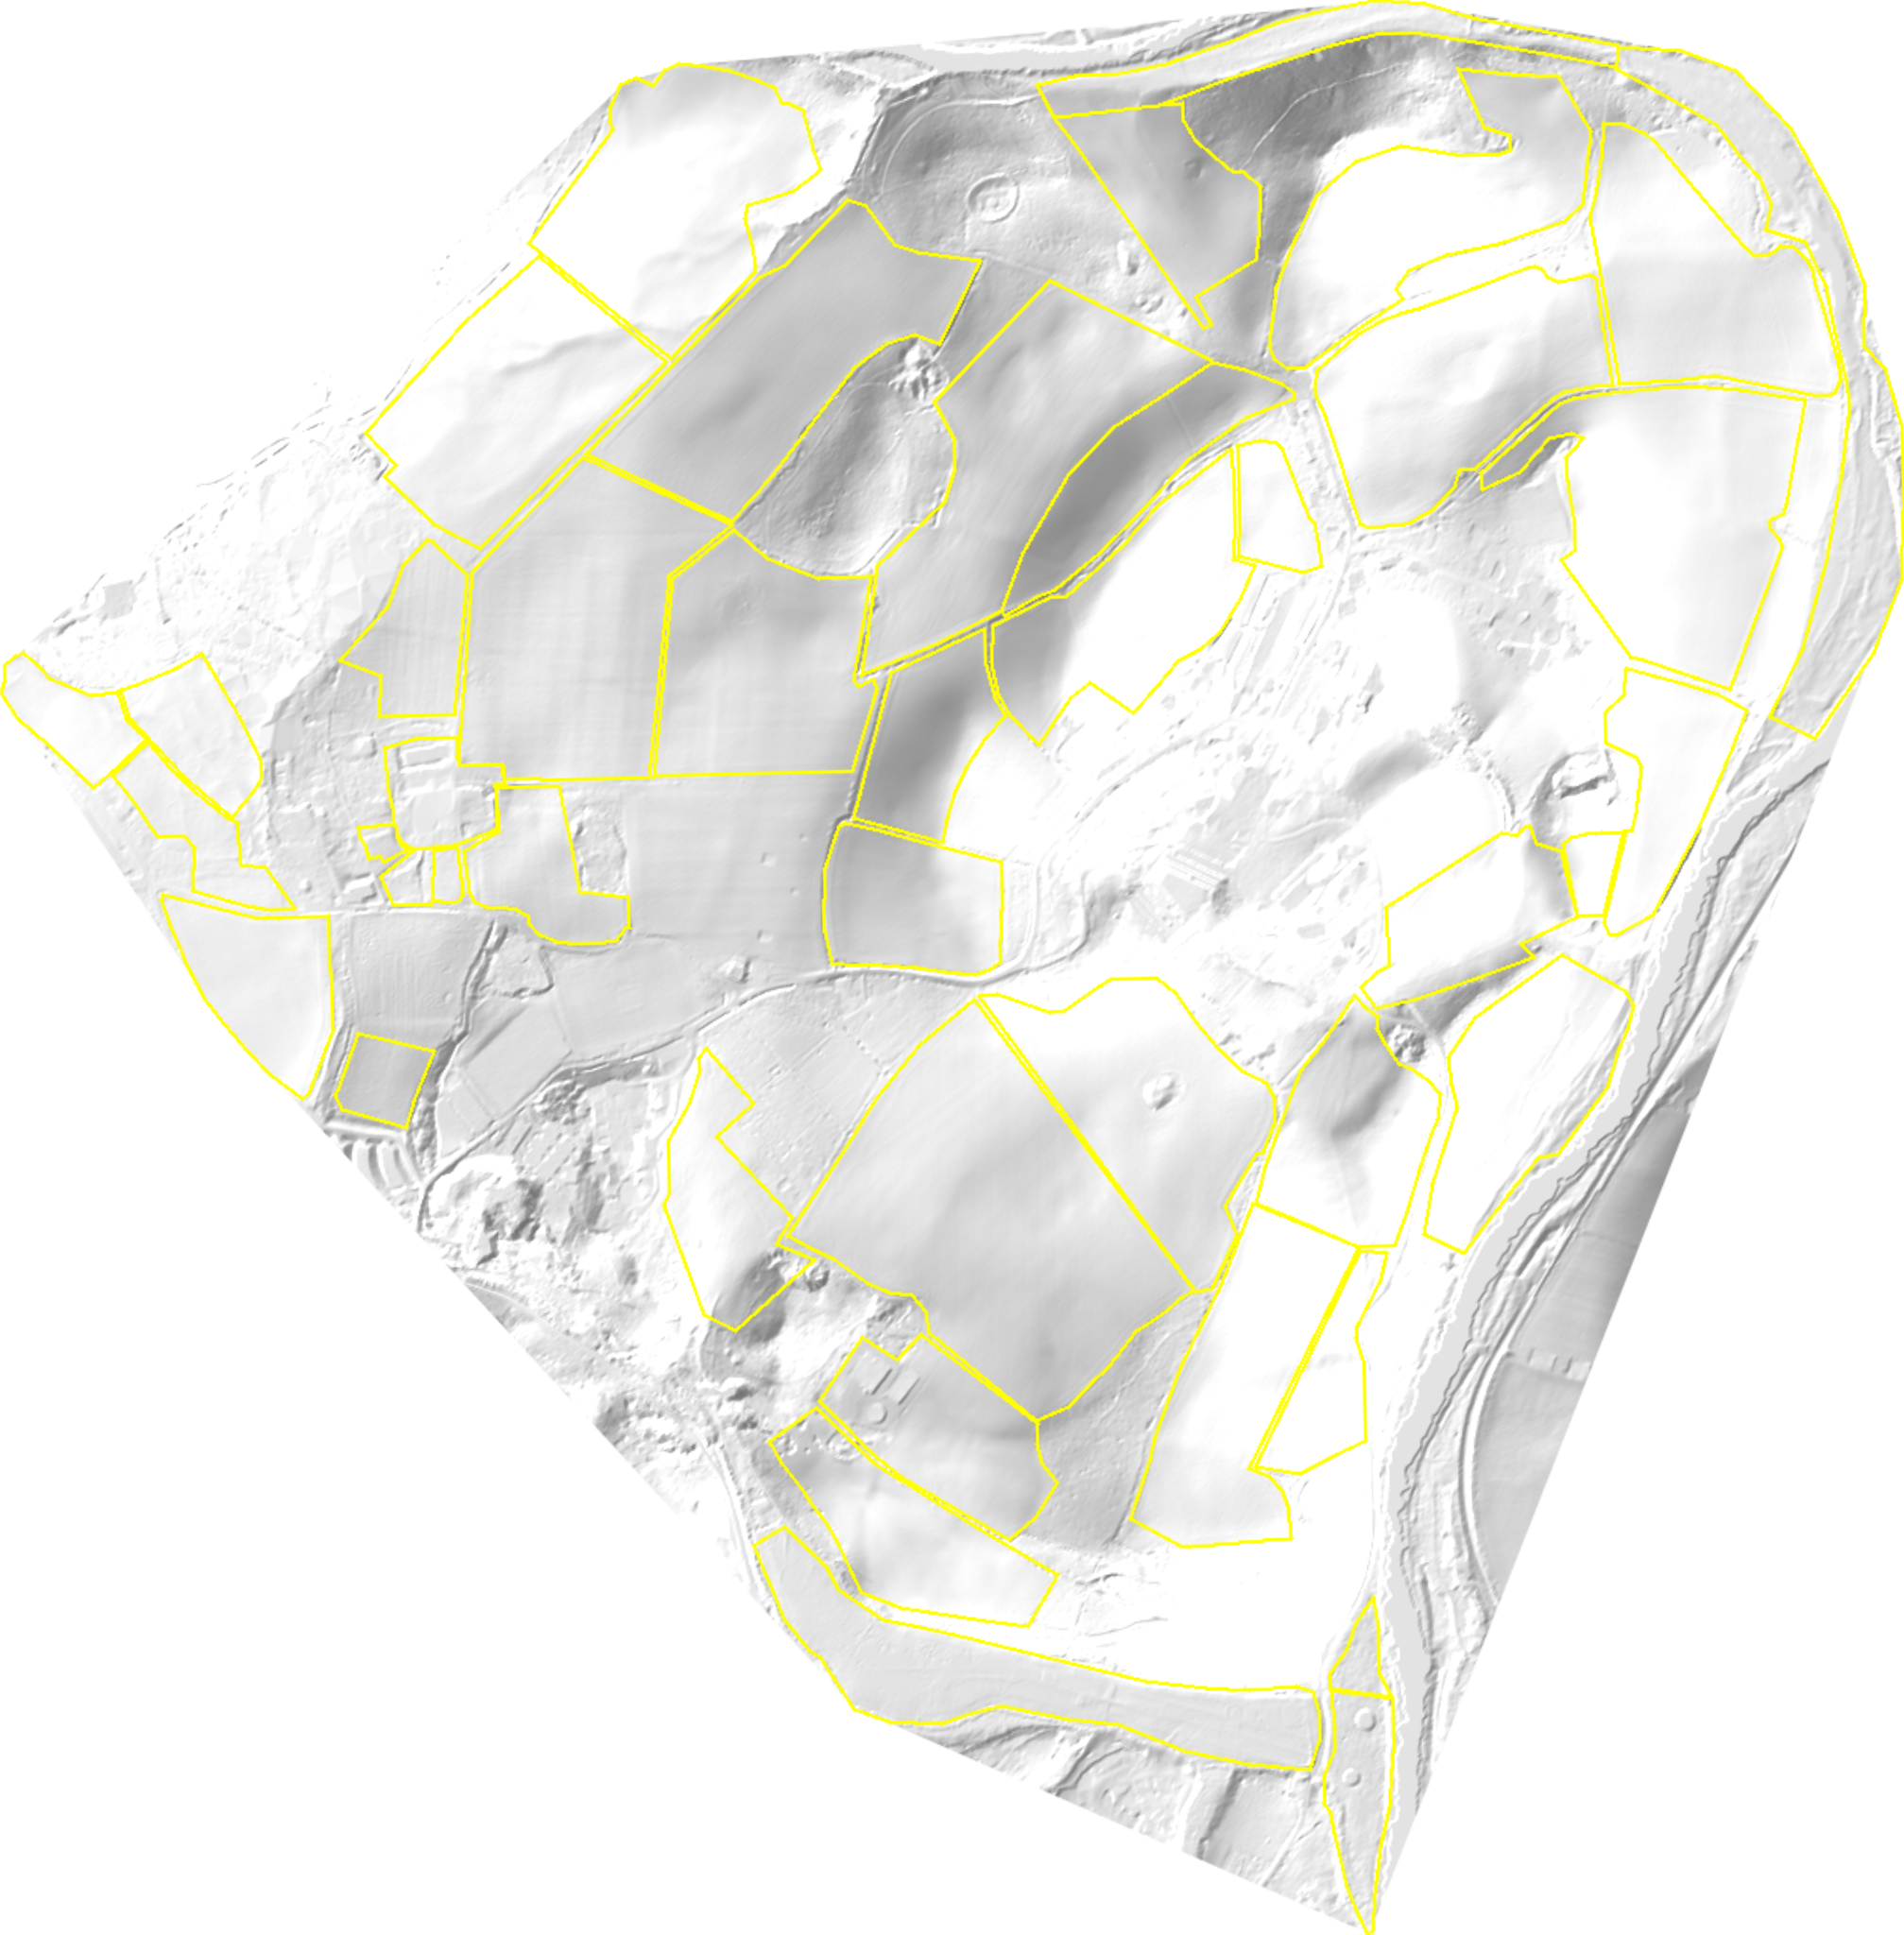
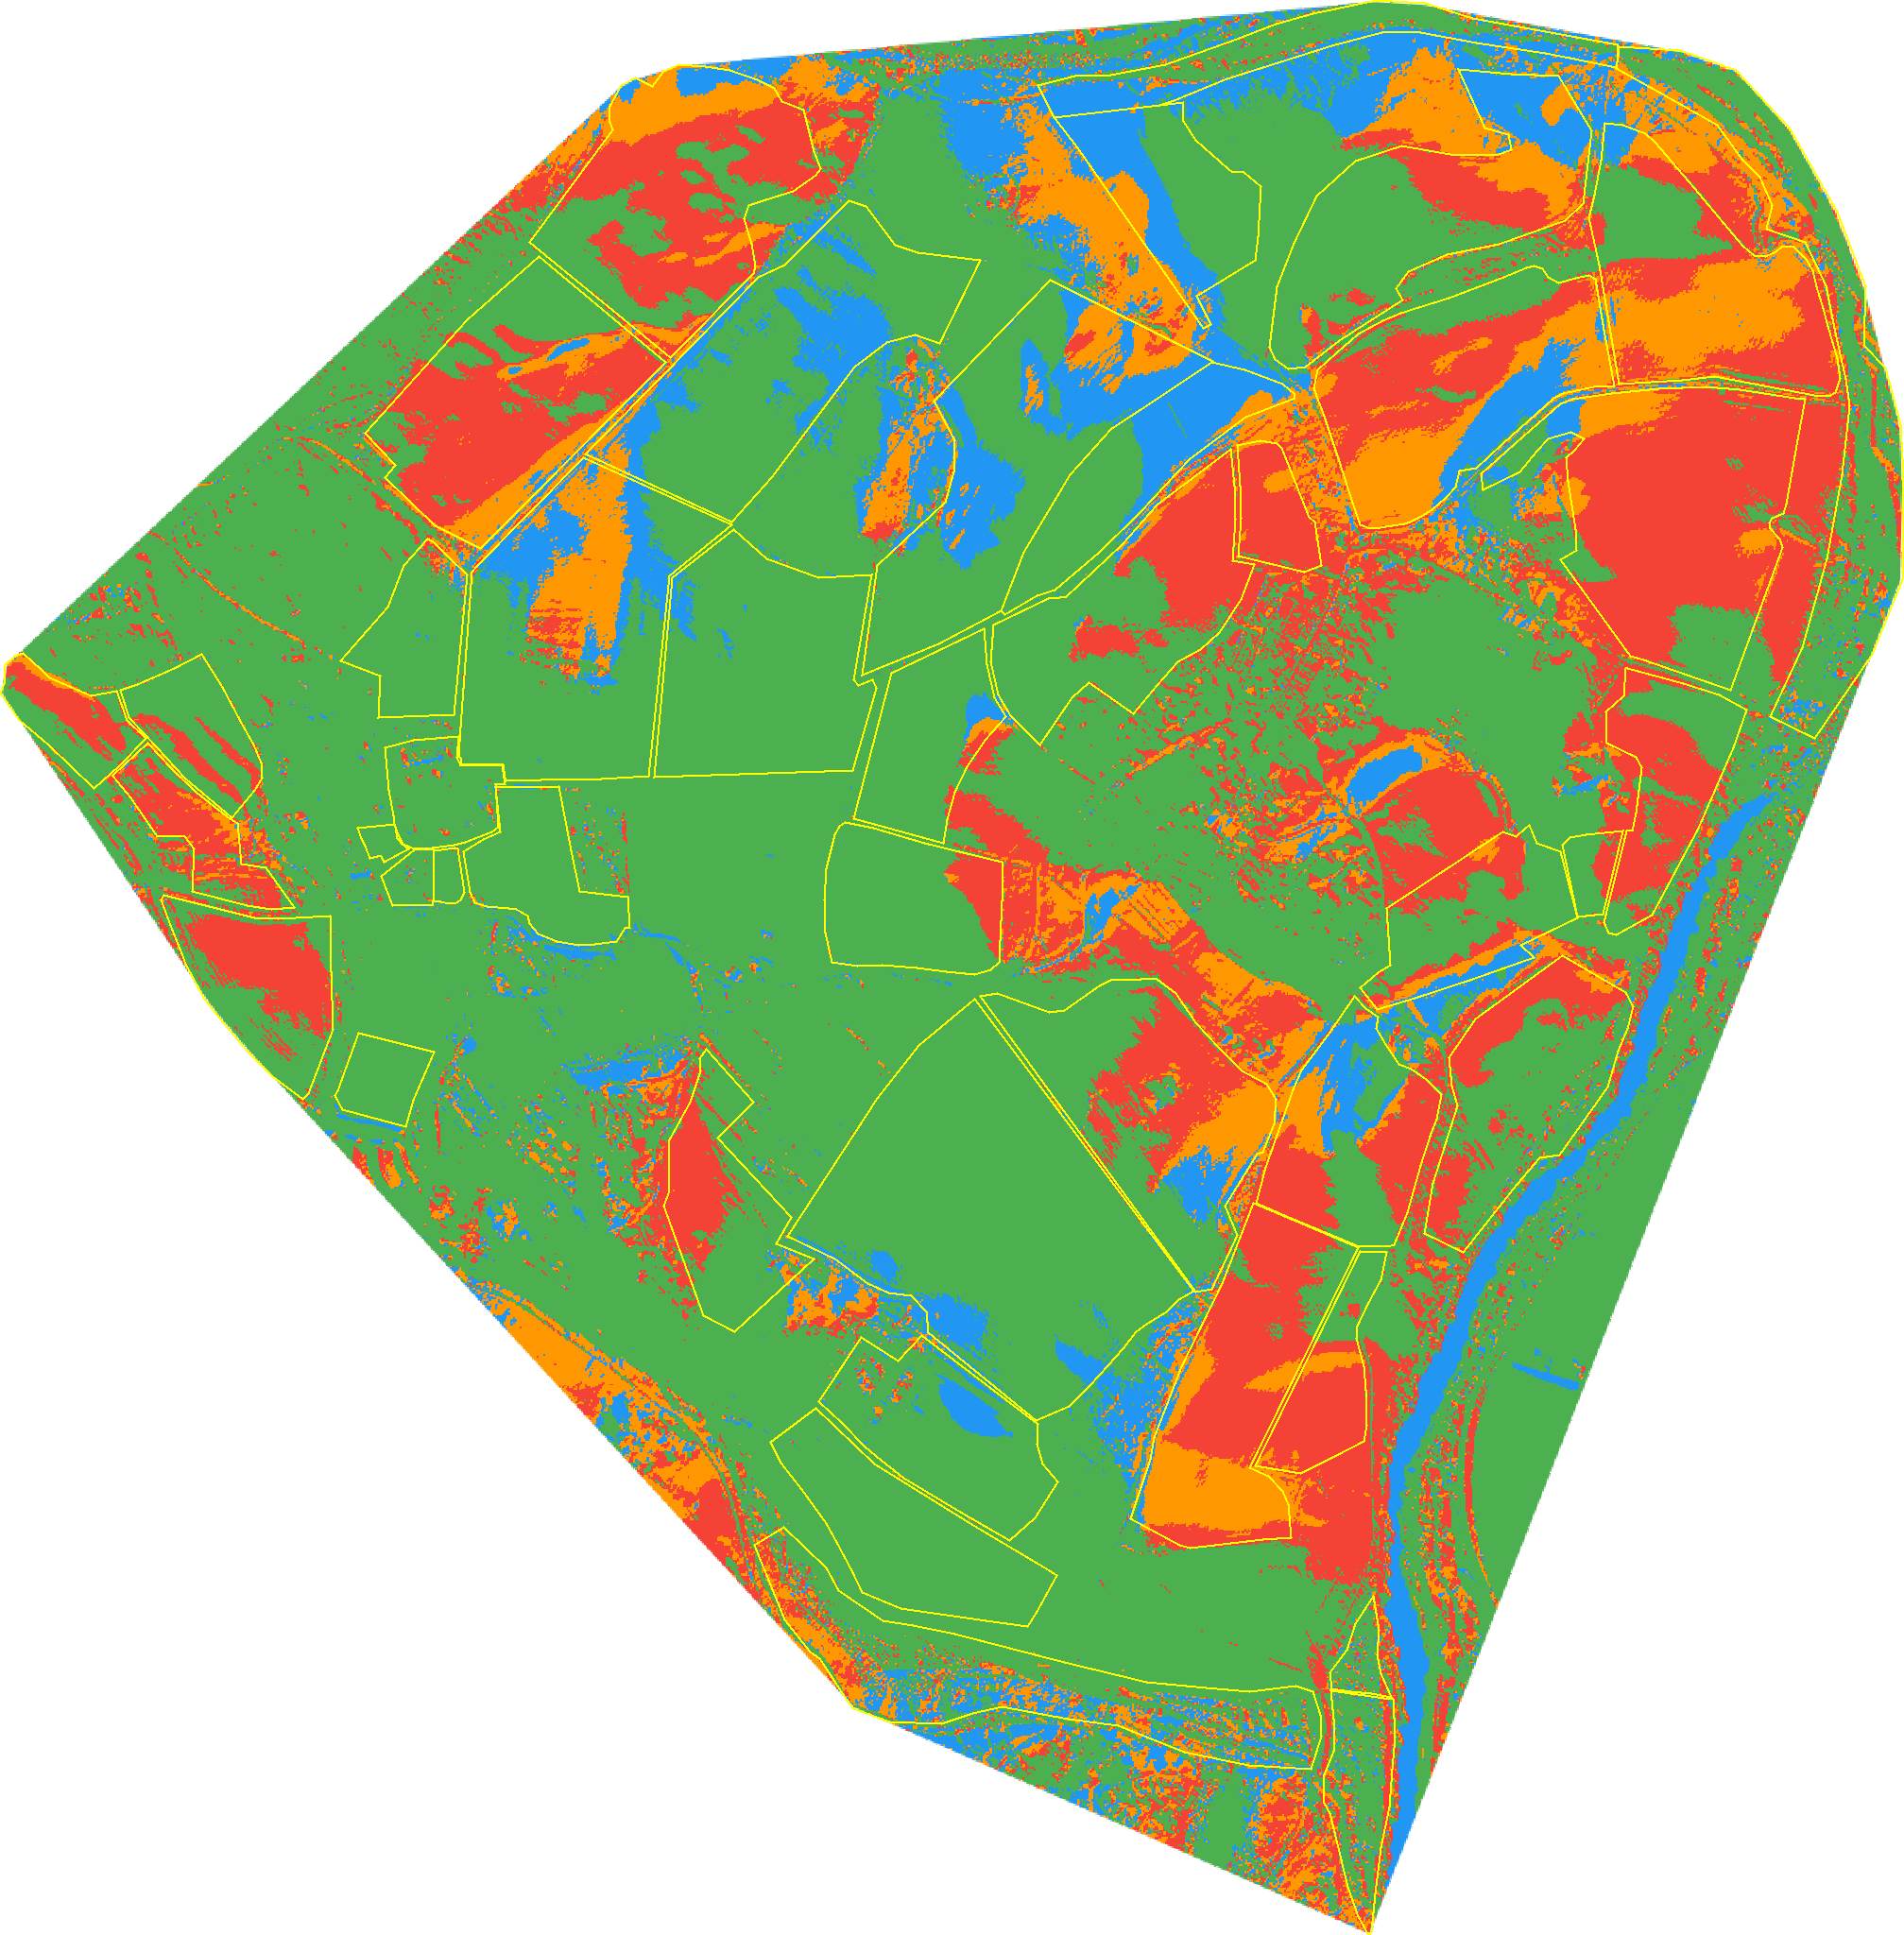
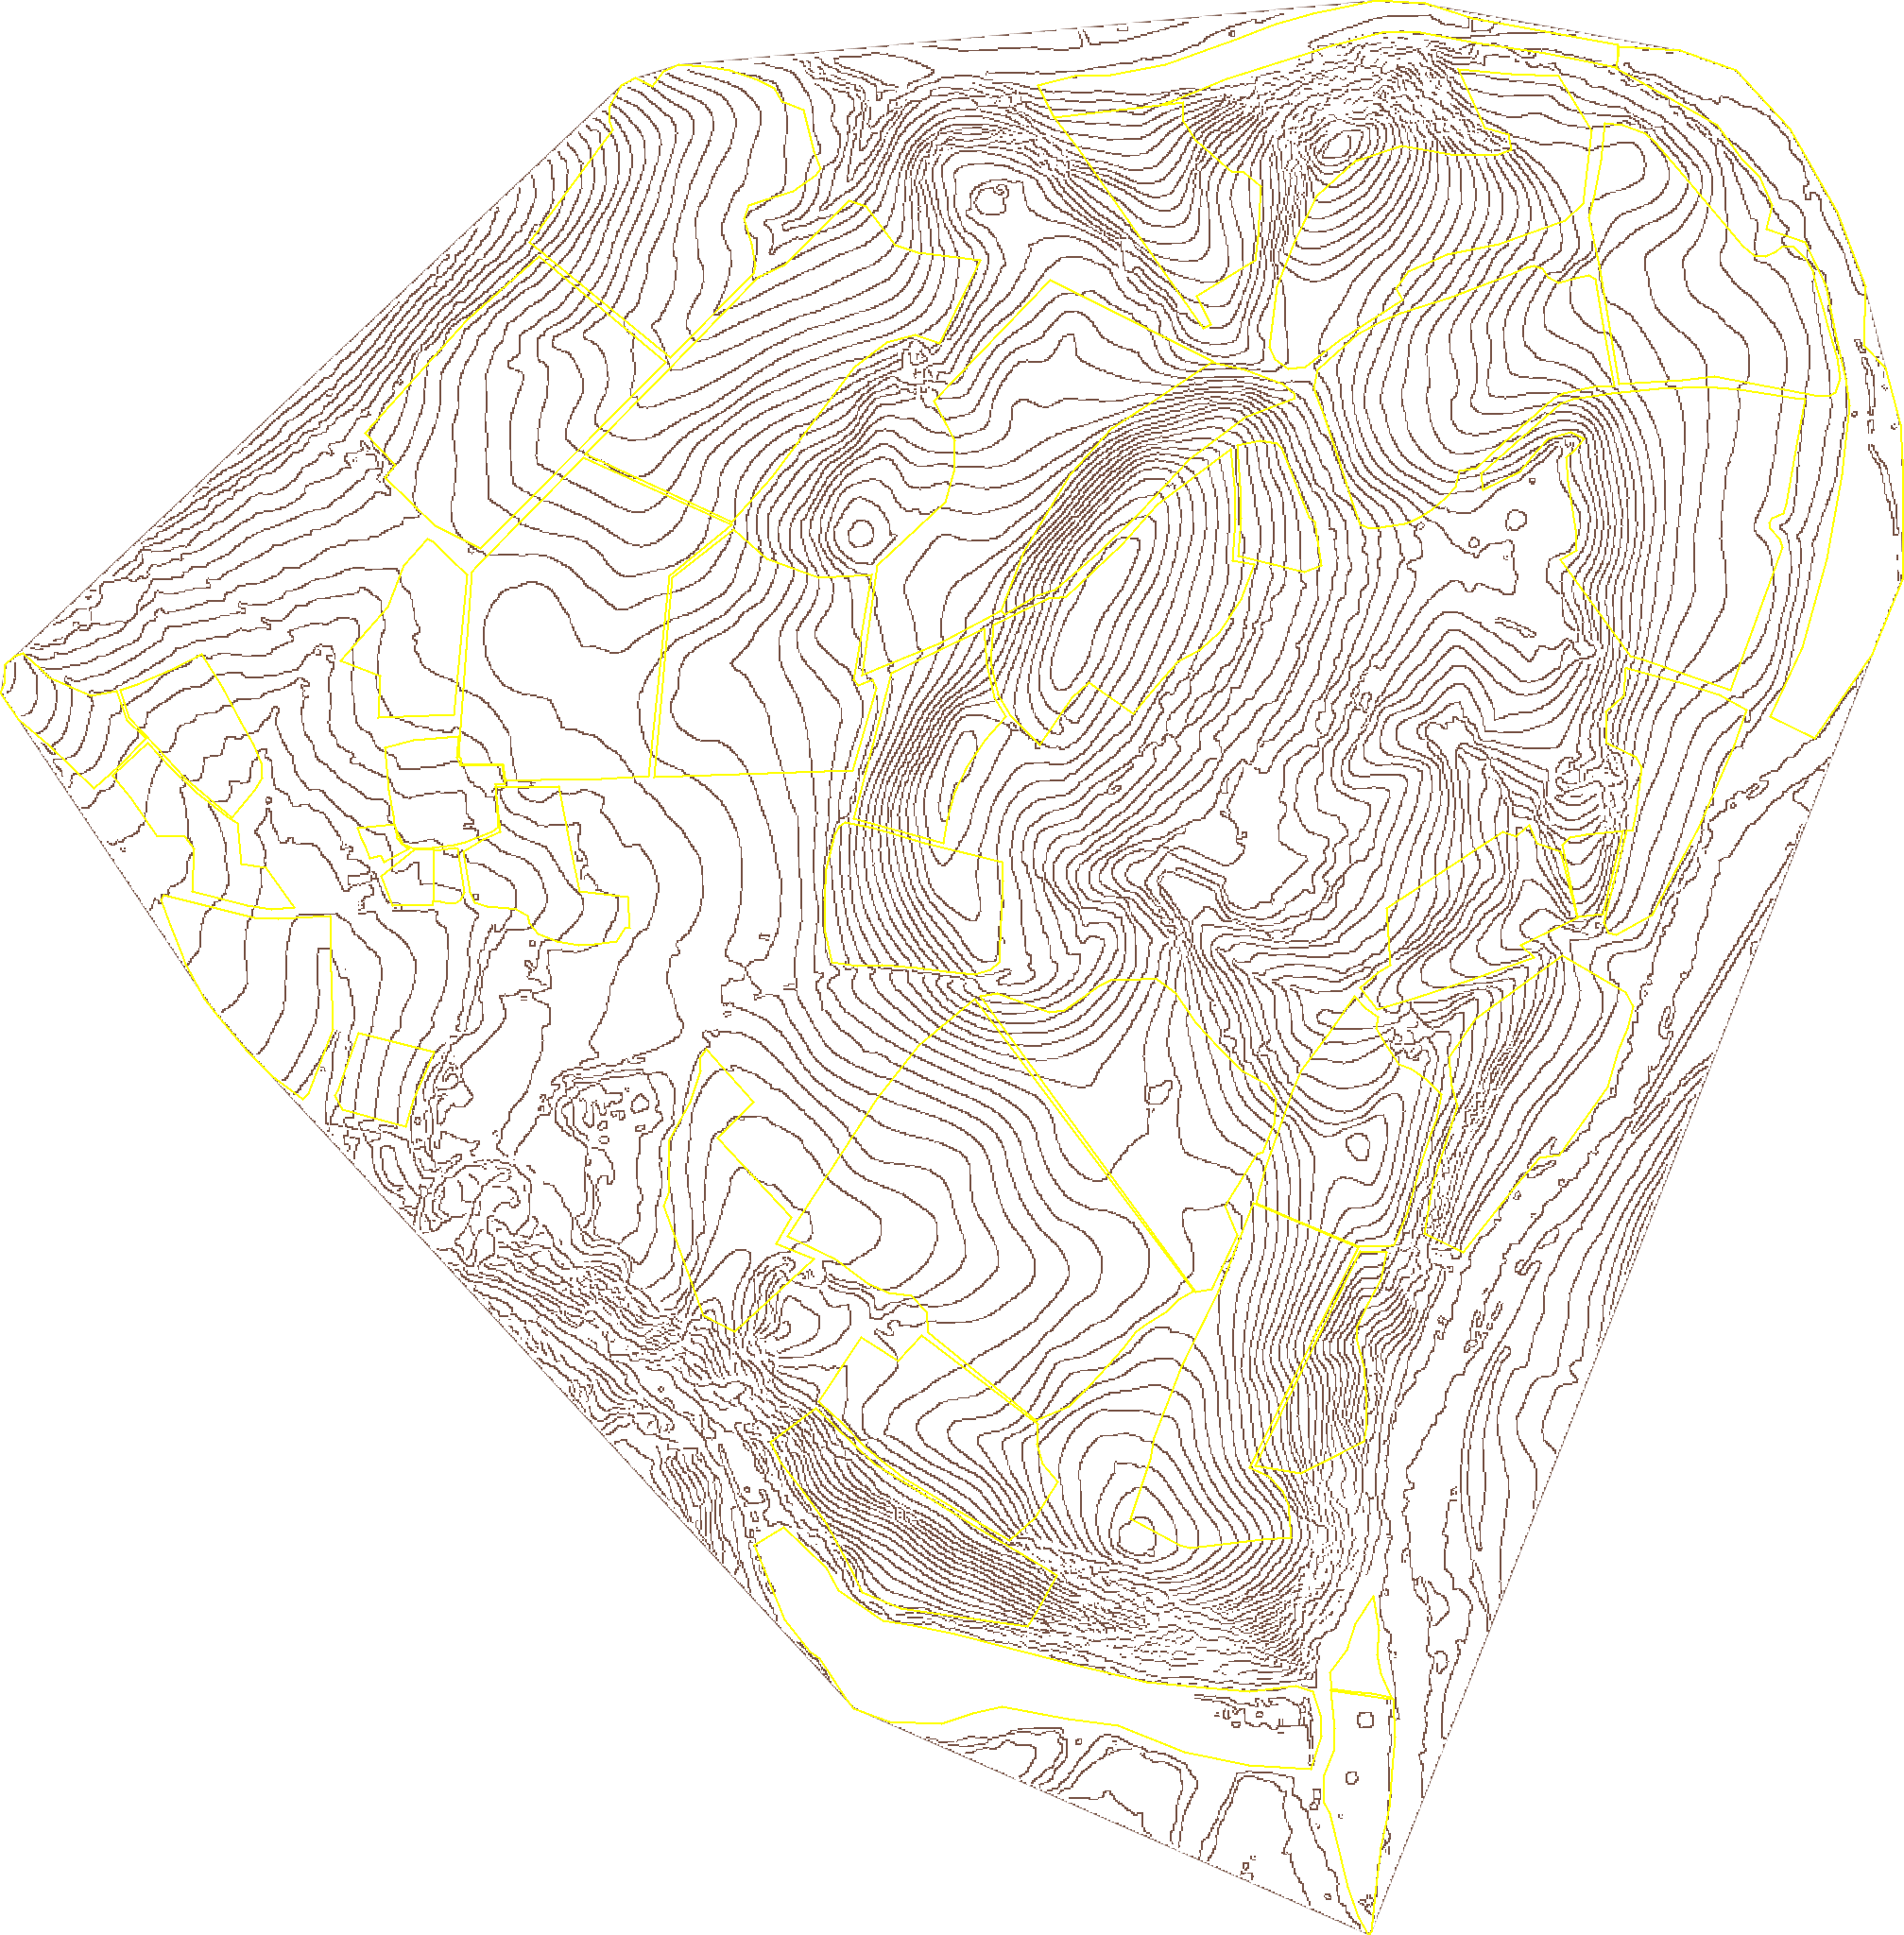
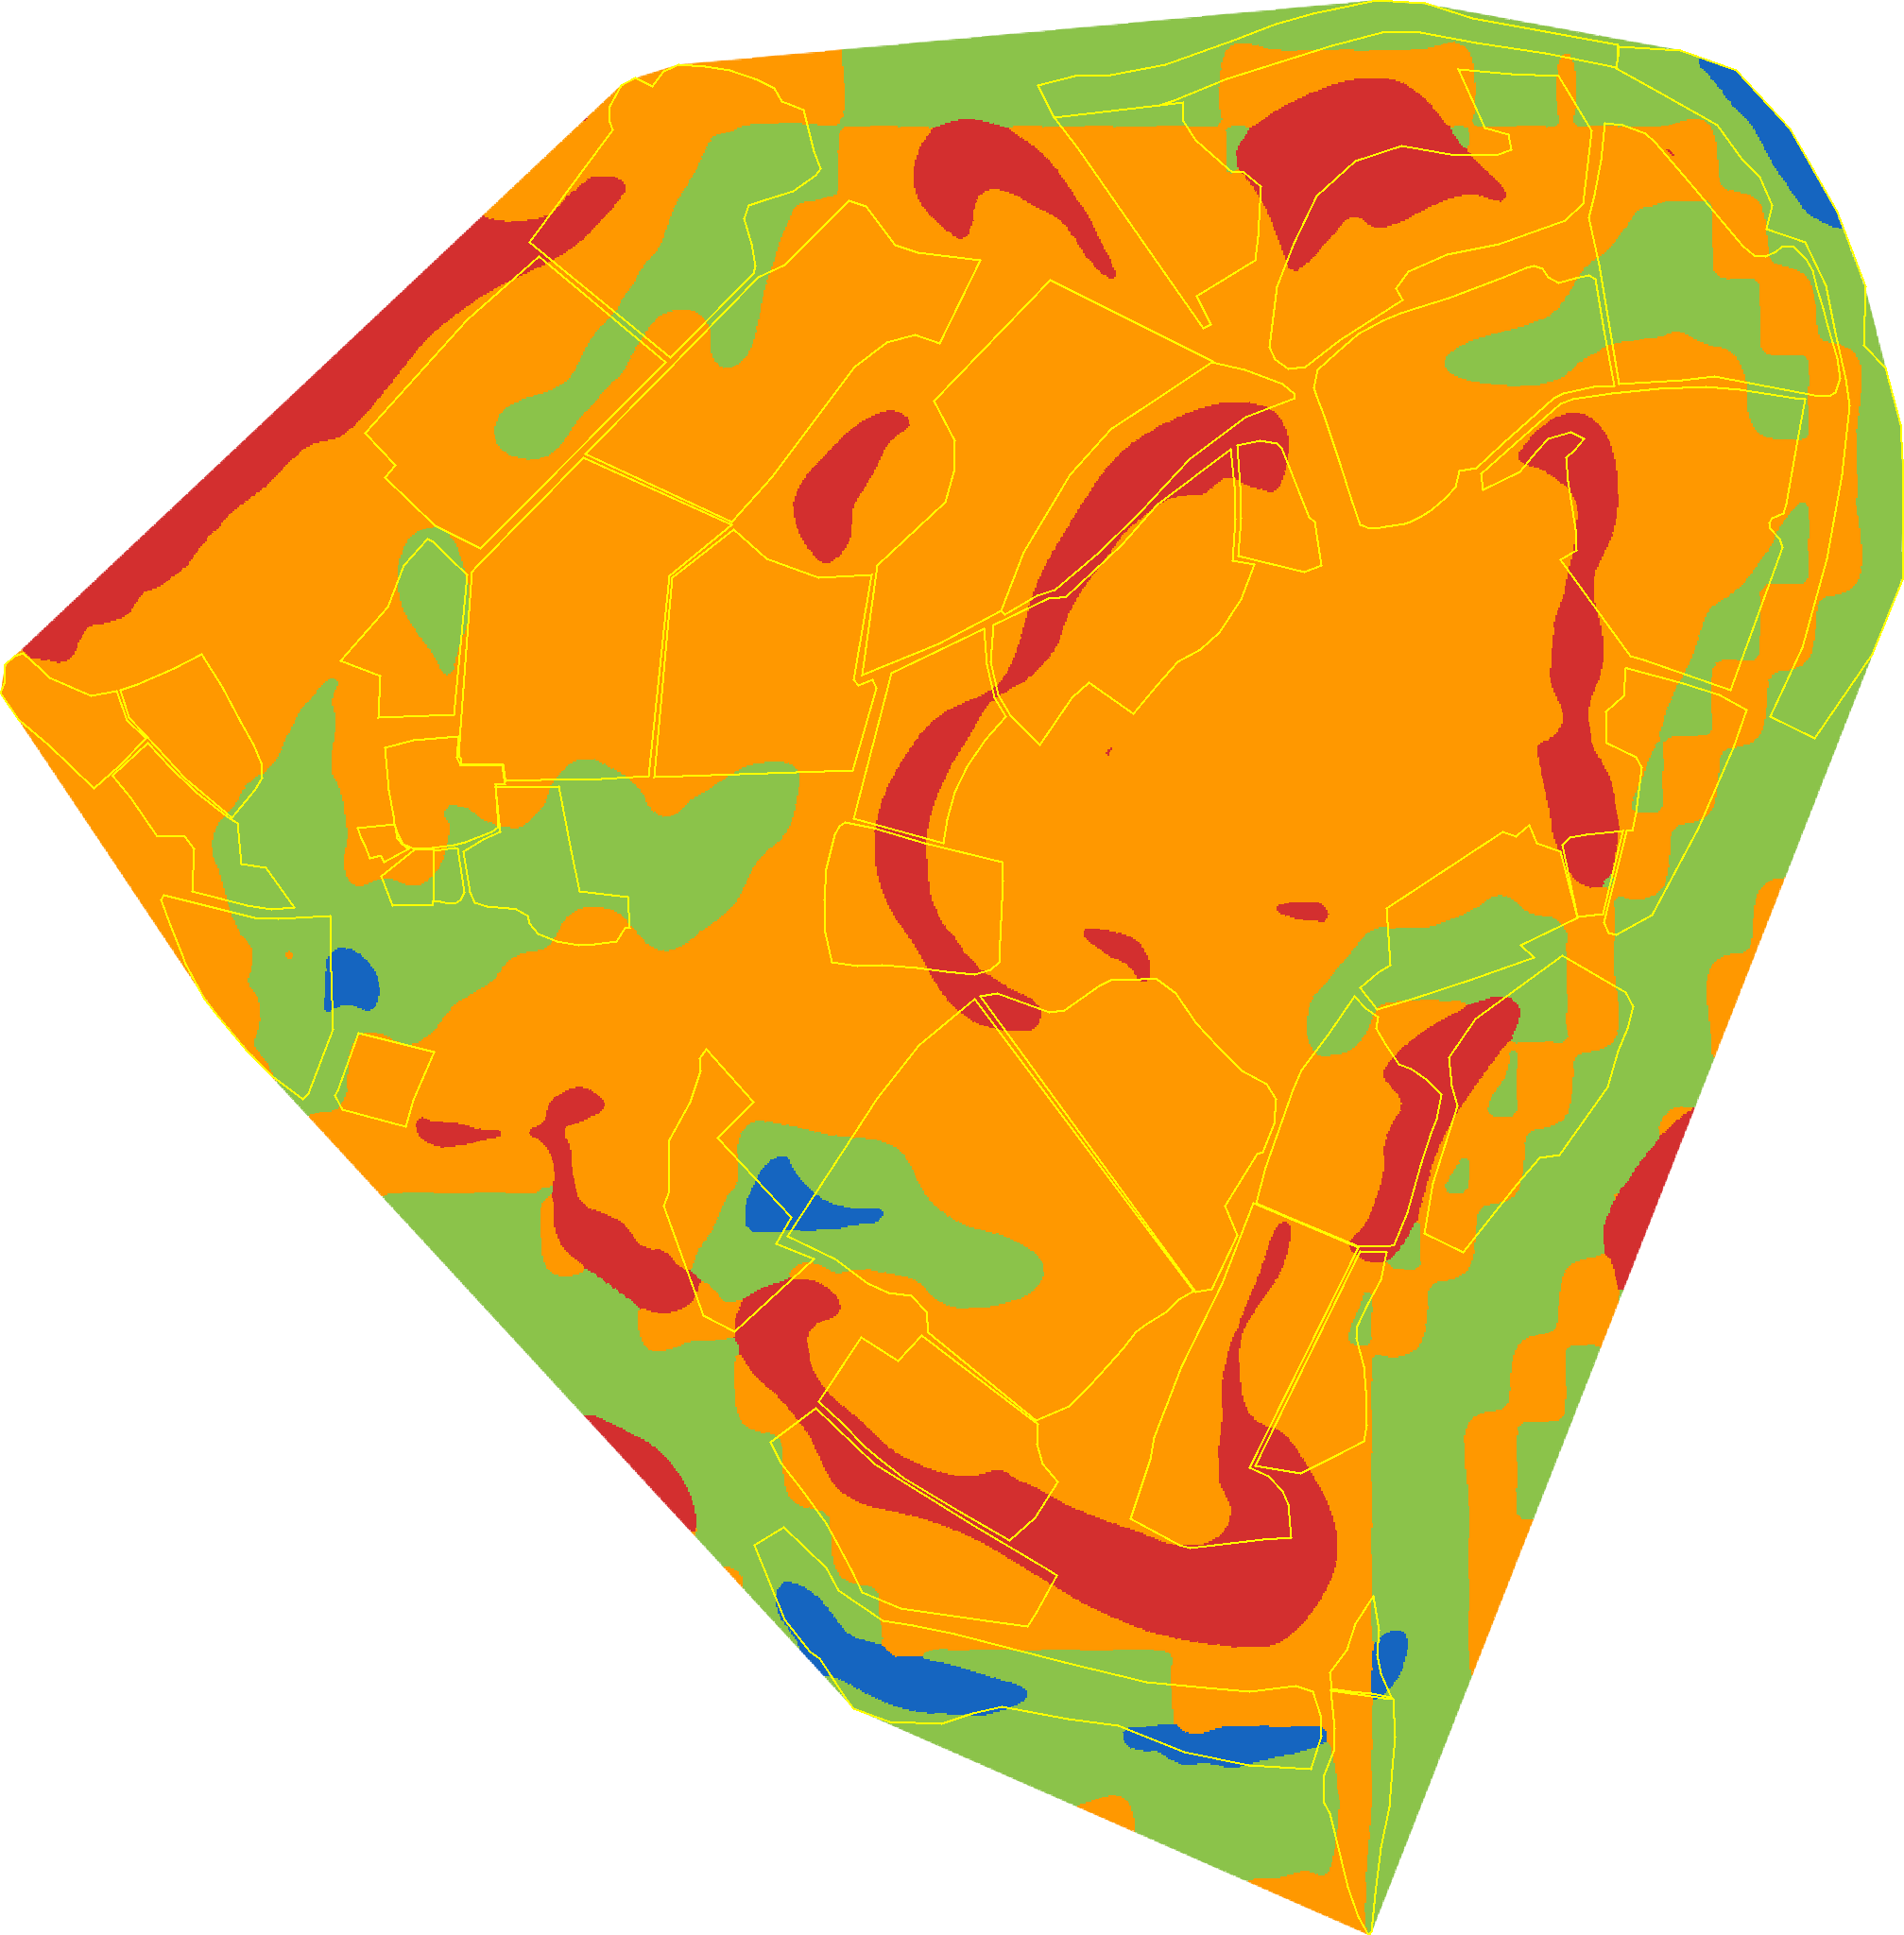
Each of these is useful on its own. None of them needs you to be a specialist to read once it is drawn and styled for you.
The layers EcoIntel builds for you
EcoIntel builds all of the above and more for every farm, from satellite data and public elevation models. Fifteen-plus of them come as full-page maps in the Visual Property Atlas, one of the reports in every plan. Across the whole system there are sixty-plus signals, from terrain to greenness to carbon.
You get them in two places.
The app map. A satellite base with a layer panel down the side. Turn layers on and off, stack up to eight at once, and click any parcel to read its scores. This is where you plan: you move between the winter hillshade, the wetness index and the field boundaries in seconds.
The Visual Property Atlas. A downloadable report that shows your land through fifteen-plus satellite layers, one clear map per page, with a short read-this-map note beside every one. This is the version you print, take to a meeting, or hand to a contractor.
Both are built for you and kept current. There is nothing to configure.
Where the value is: reading two or three layers together
One layer answers one question. The real value comes when you read two or three at once, because that is when the ground starts to explain itself.
Put the winter hillshade next to the Topographic Wetness Index. The hillshade shows you the cold, shaded corners; the wetness index shows you where water sits. Where those two overlap you have found the parts of the farm that stay cold and wet longest in spring, the parts that grow last and suffer most if you graze or travel on them early. You did not walk the farm in February to find them. You read them off two maps.
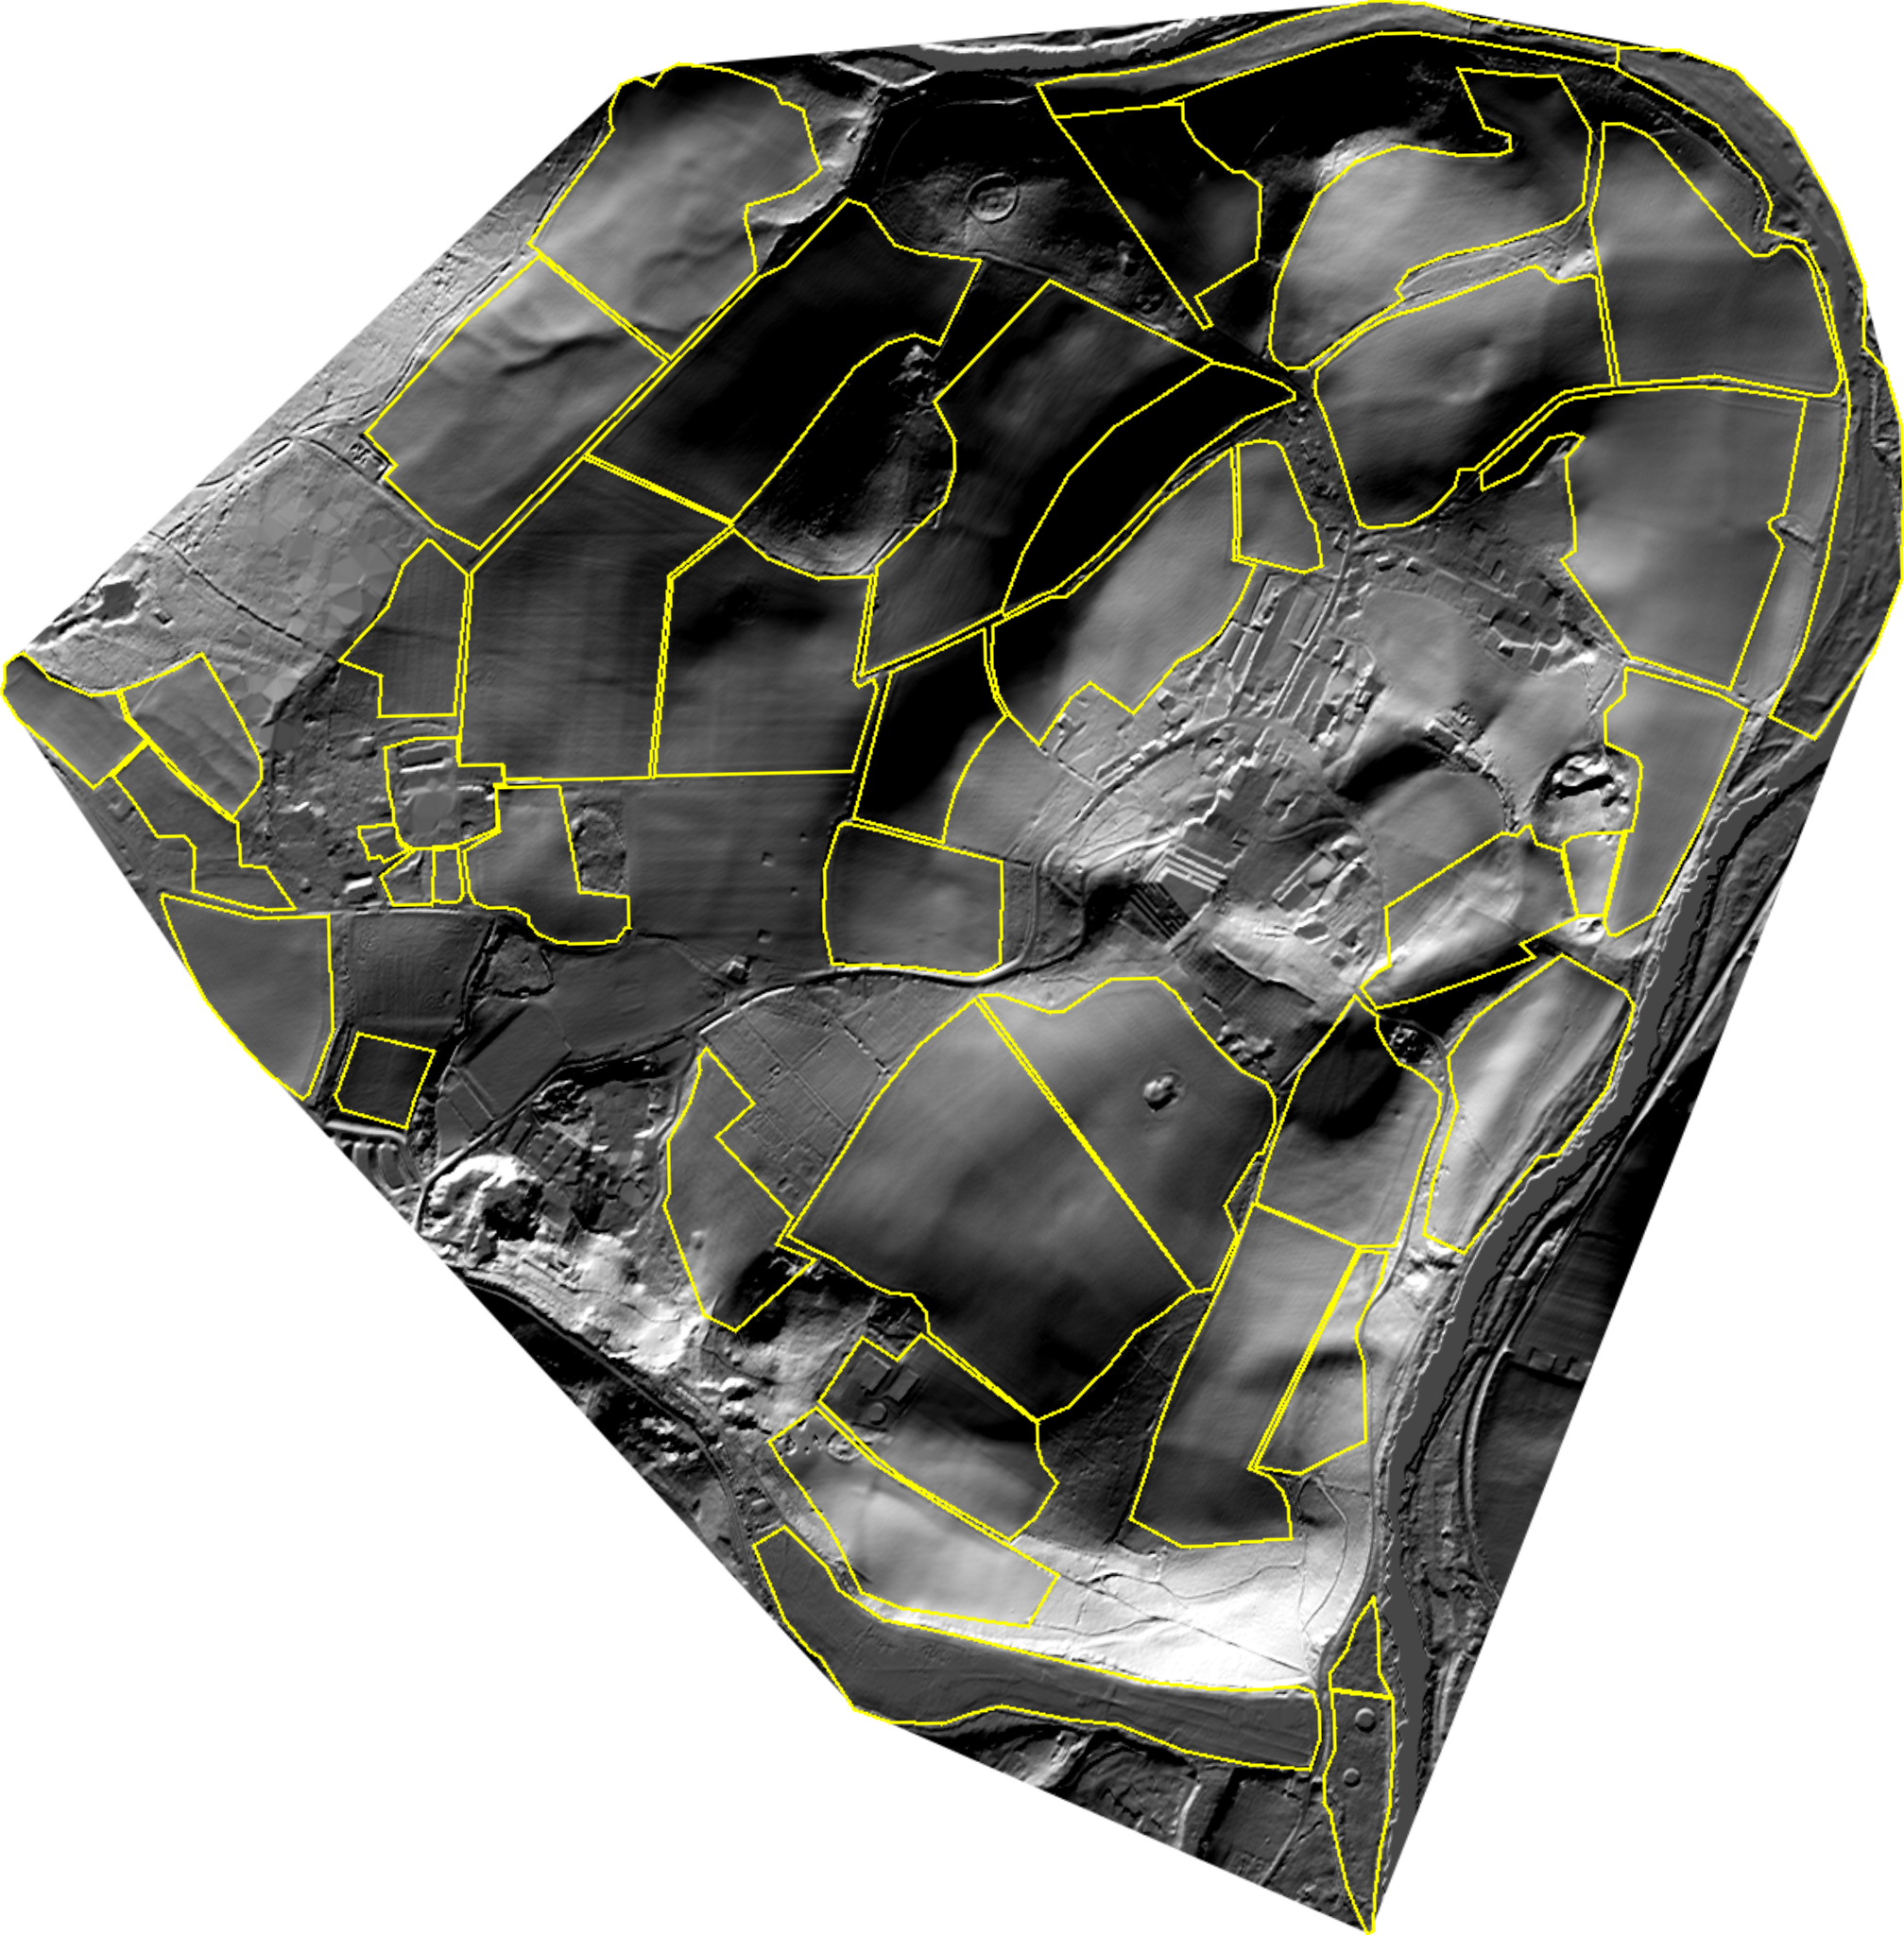
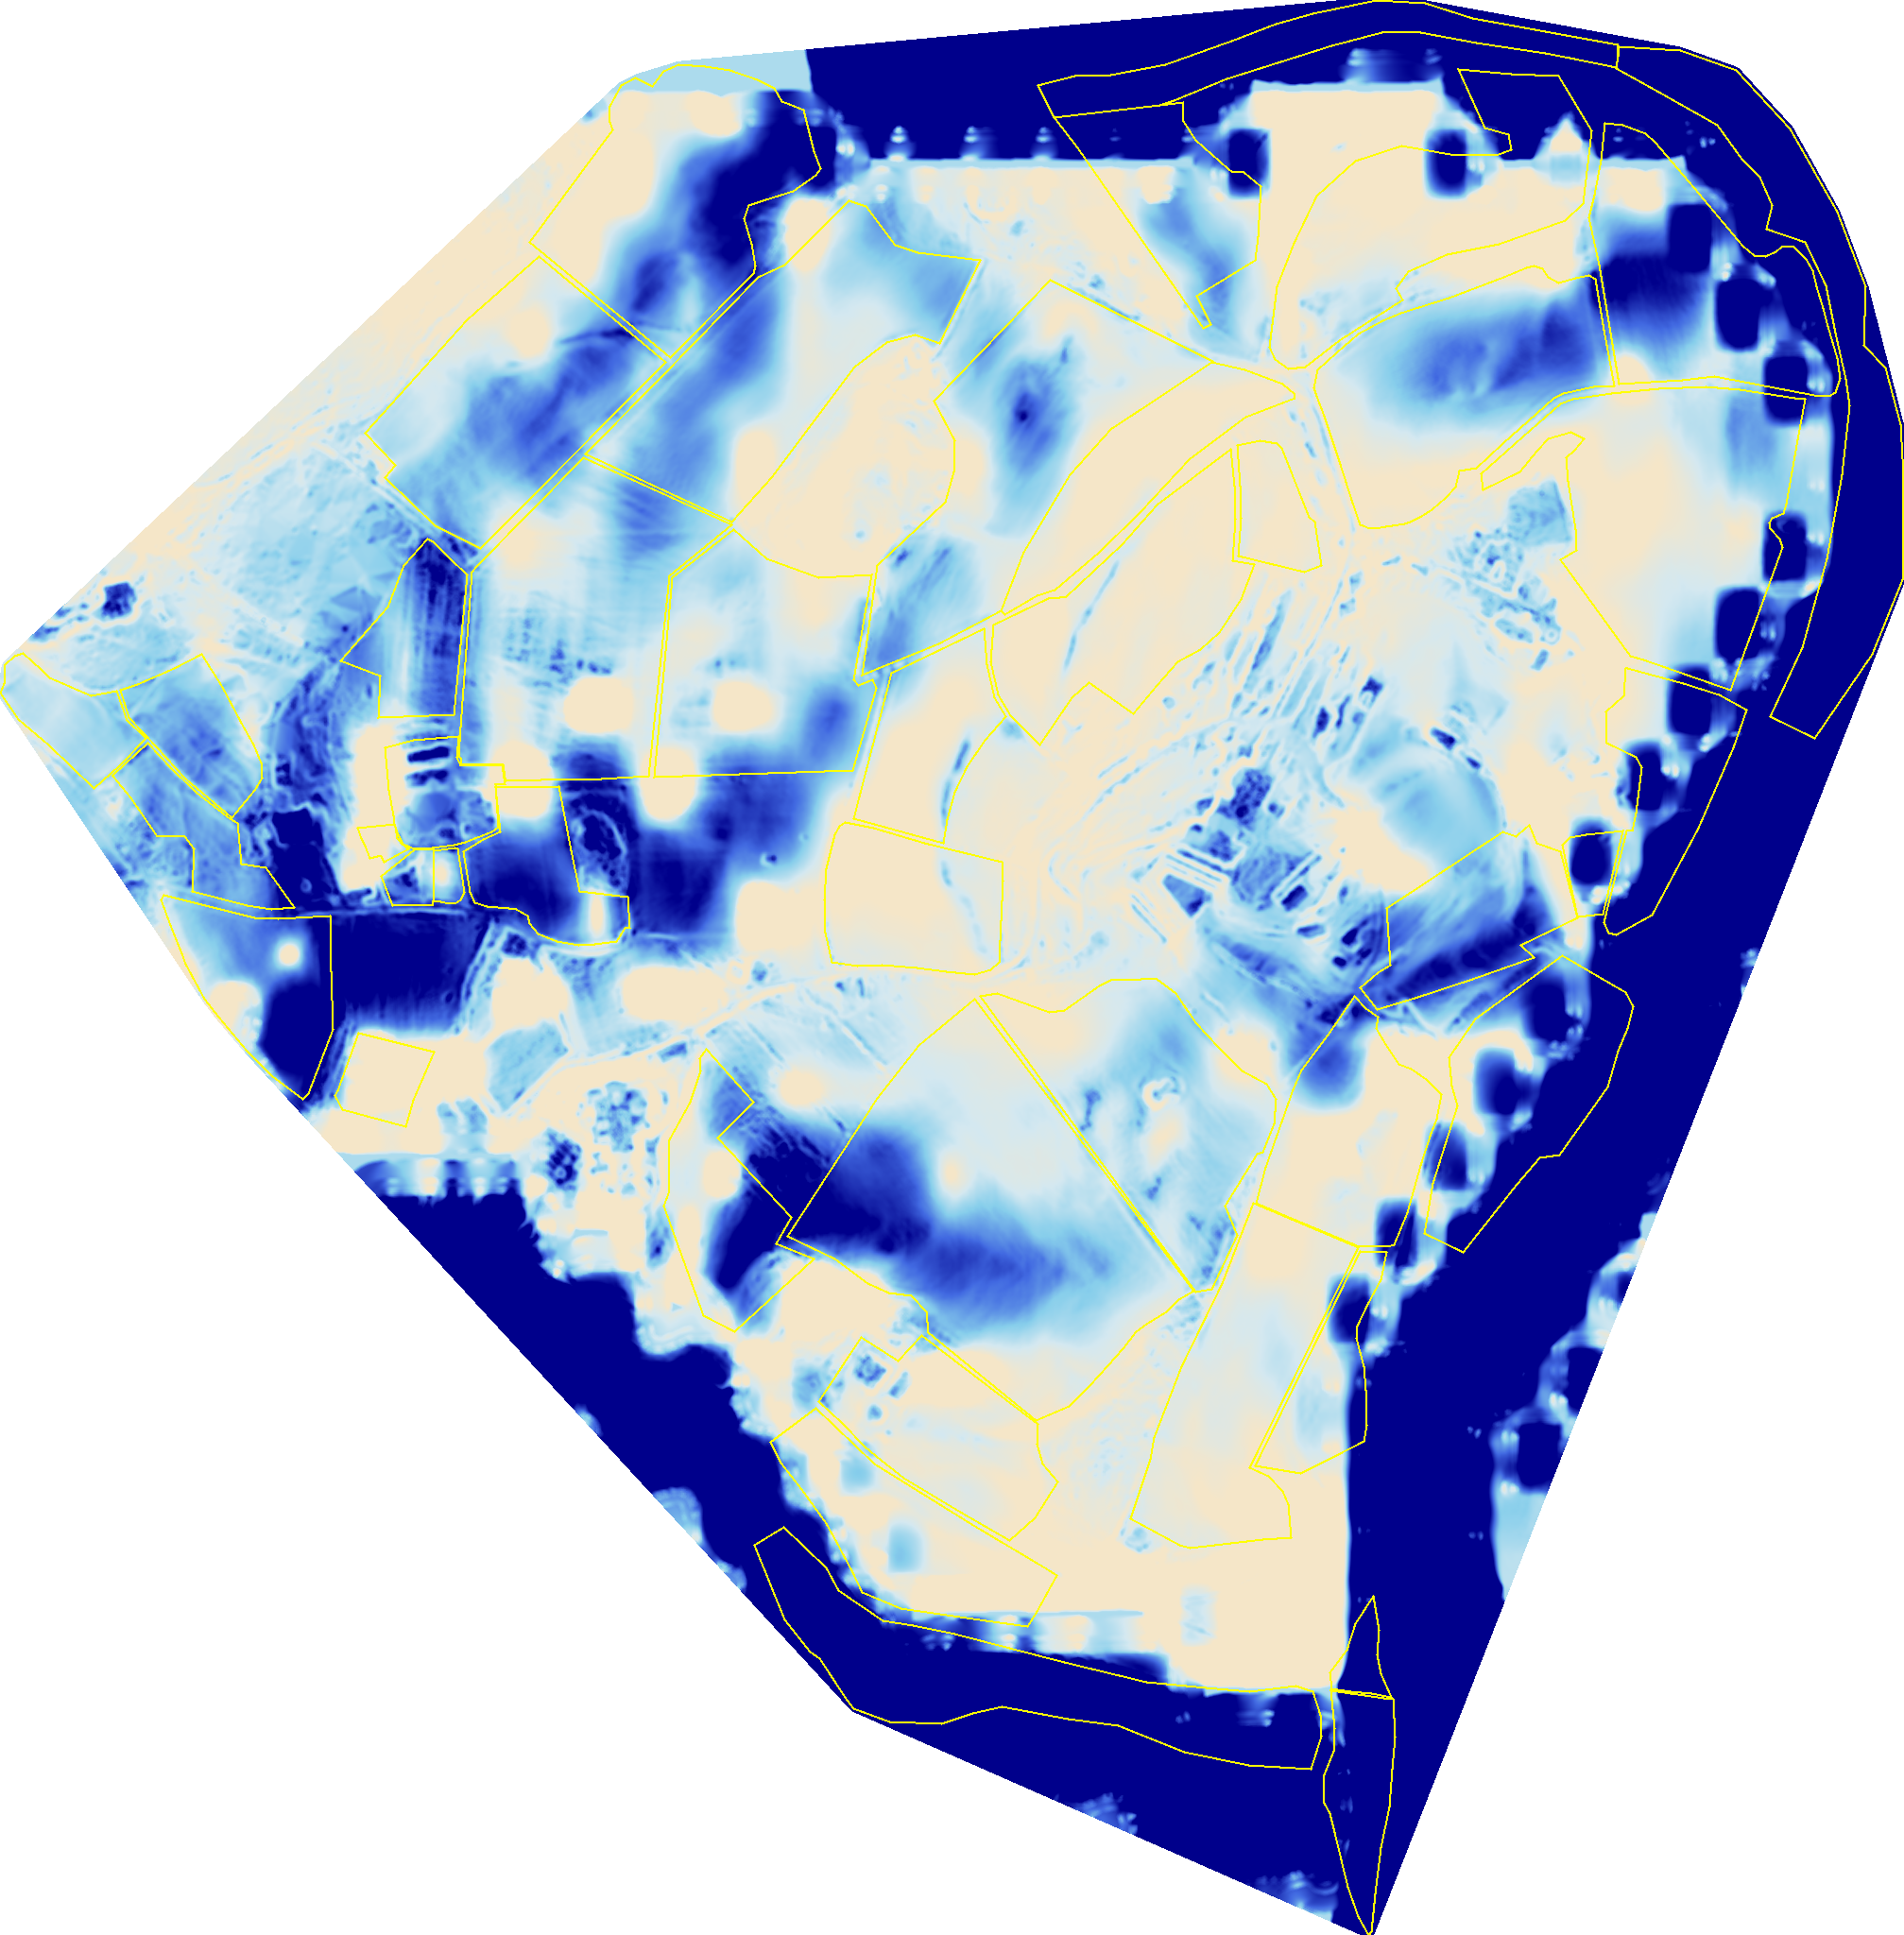
Add aspect and slope and the picture sharpens again. A steep, north-facing, wet field is a different animal from a gentle, south-facing, free-draining one, even if they sit side by side and grow the same crop. Once you can see that difference on the map, a lot of things that felt like bad luck start to make sense.
A worked example: were the cattle out too early?
What if, for every field and parcel on your farm, you had its aspect, its winter and summer shade fractions, its slope and its Topographic Wetness Index, the week it starts growing and the week it peaks, radar detection of every grazing and mowing event and the recovery time that followed, and its water and energy cycles quarter by quarter, all read from satellite and elevation data and ready the moment you open the map, to build the grazing plan that works for the cattle and for the ecosystem? EcoIntel reads all of it for you, for every field, at once.
That is exactly what the report’s Field Seasonal Profile does. Here is how it works on Wilder Wood.
Start with the ground that does not change. On the winter hillshade and the aspect layer, some fields face north and sit in shade; others face south and catch the sun. On the Topographic Wetness Index, some hold water and some drain. So before any growth data, EcoIntel has the fields sorted: a north-facing, shaded, wet field is the slow-to-warm one that grows late and needs the longest rest, and a south-facing, dry field is the one that warms and grows first.
Now it adds time. For every field, EcoIntel reads the week it starts growing in spring, the week its biomass peaks, from radar, and how long its season runs. It ranks the fields by green-up, so the earliest south-facing fields come up as the first turnout fields and the cold shaded fields come up as the ones to hold back.
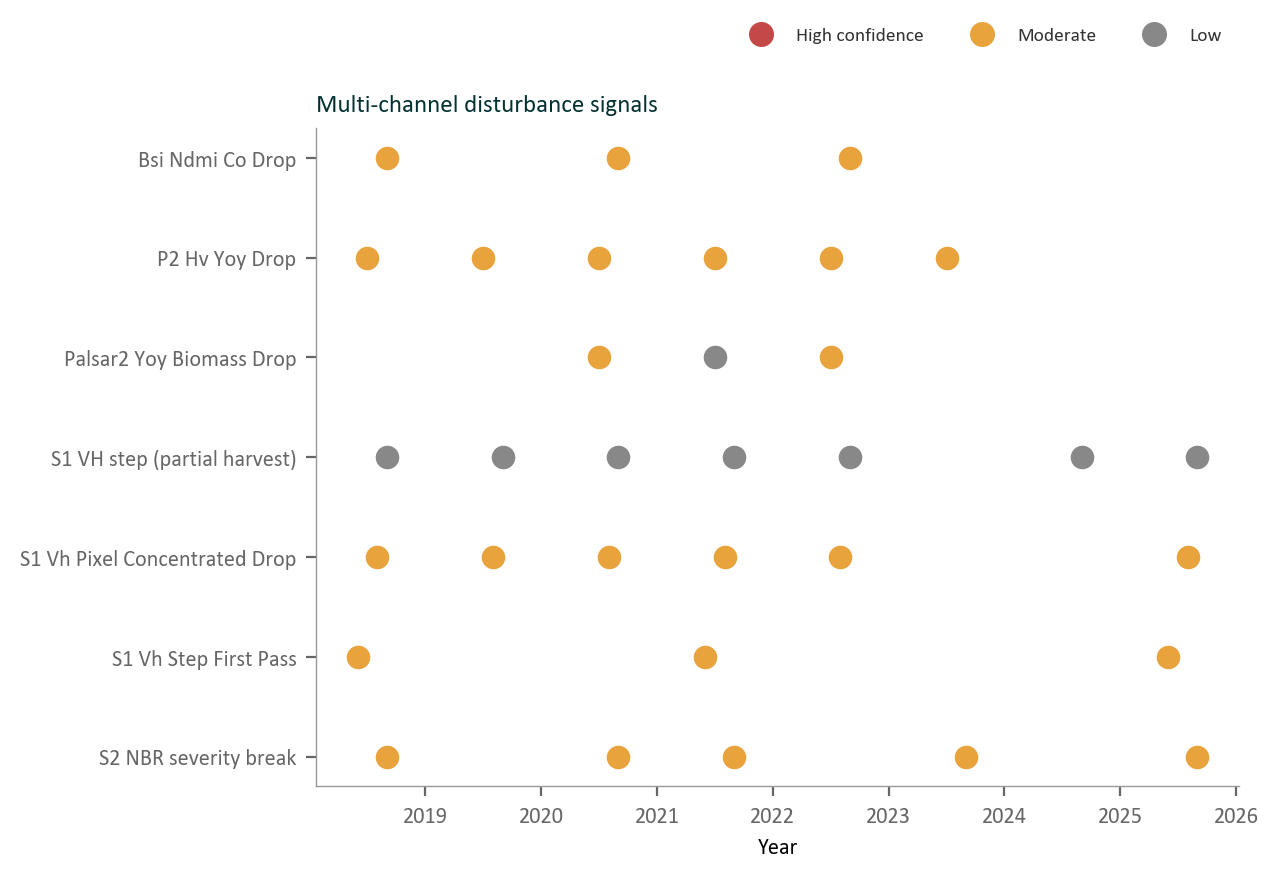
Then it reads what happened on the ground. EcoIntel picks up grazing and mowing from radar, a step drop in the Sentinel-1 signal, and measures how many weeks each field took to recover its biomass afterwards. The pattern to watch is a late peak or a slow recovery on a slow-to-warm field: it means the field was grazed before it was ready, and its growth stayed low for the rest of the season. On Wilder Wood the report says it plainly for a real field: an east-facing field on cooler ridge ground greens up in the second half of the spring window, and grazing it too early costs energy capture for the rest of the year.
The report turns this into a turnout order: start the spring rotation on the early south-facing fields, hold the cold shaded ones for later and give them the longest rest, and move stock to the wetter, cooler fields when the free-draining ground dries out in summer. Where a field has been grazed too often for its recovery, it says so. What it does not do is name the date you turned out or tell you that you got it wrong. It ranks the fields, measures the recovery, and lays out the reasoning; you and your advisor make the turnout call and confirm what actually happened on the ground. That is a decision you could not make confidently from one map, or from memory.
The layers also score the land
Most farm maps draw the land and stop there. EcoIntel goes one step further: it reads the same layers to score the land.
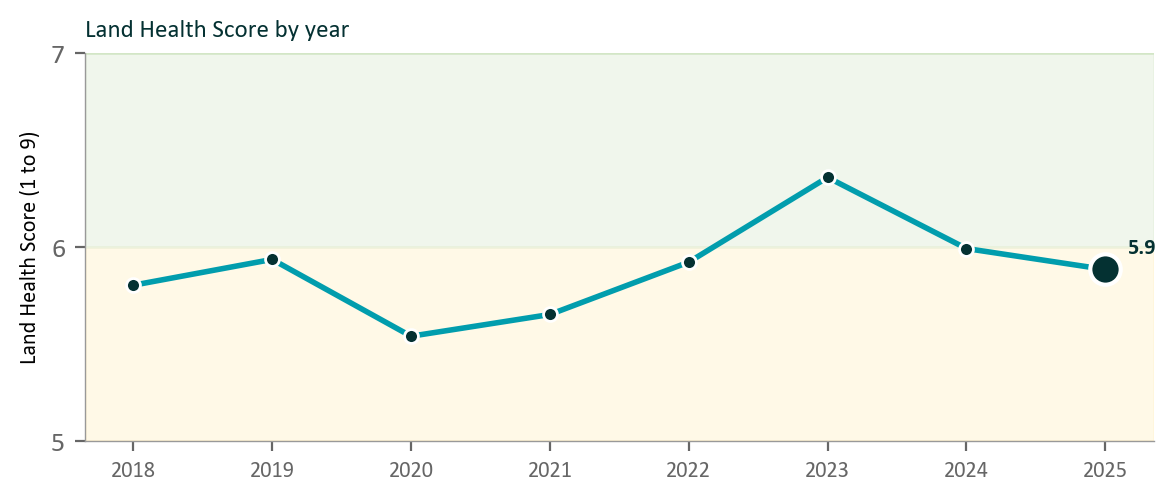
The greenness and terrain signals that make the maps also feed the diagnosis. EcoIntel rates each field on the four ecosystem processes, water, energy, minerals and community, and combines them into a Land Health Score from 1 to 9. Because the scoring uses public satellite data going back to 2018, and corrects for weather, the score tells you whether a field is improving or declining from what management actually did, not from a wet year or a dry one.
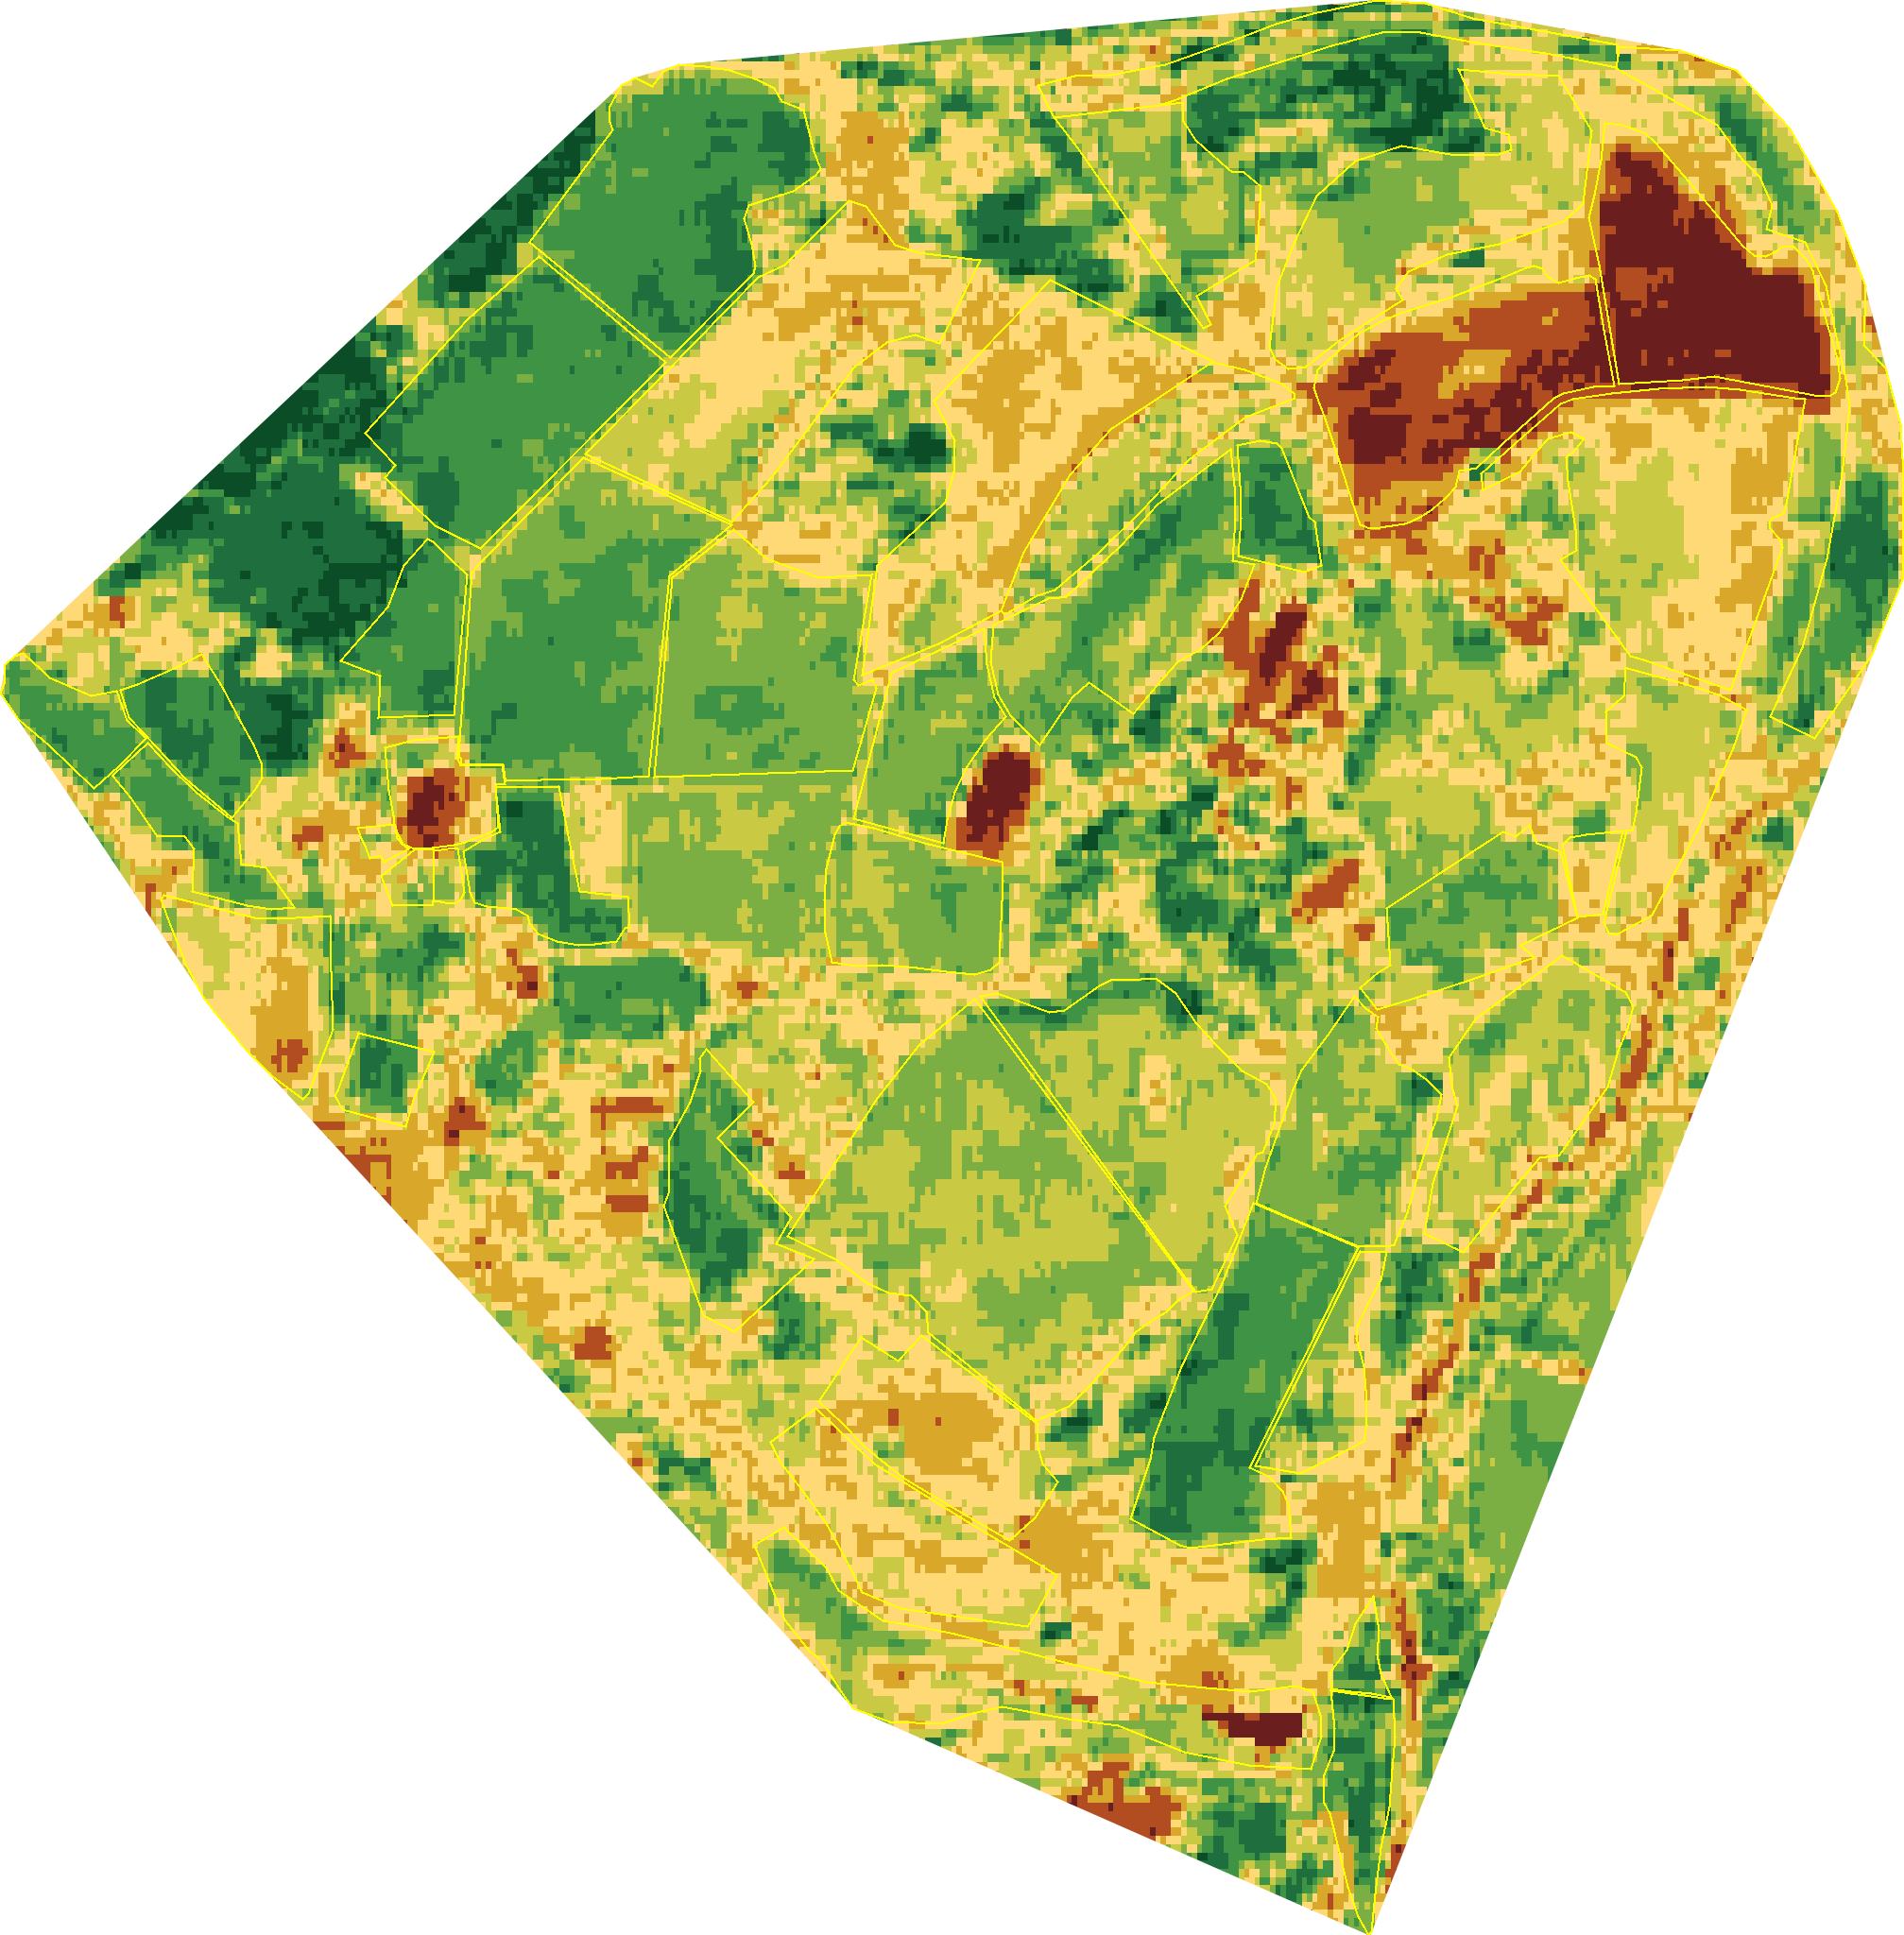
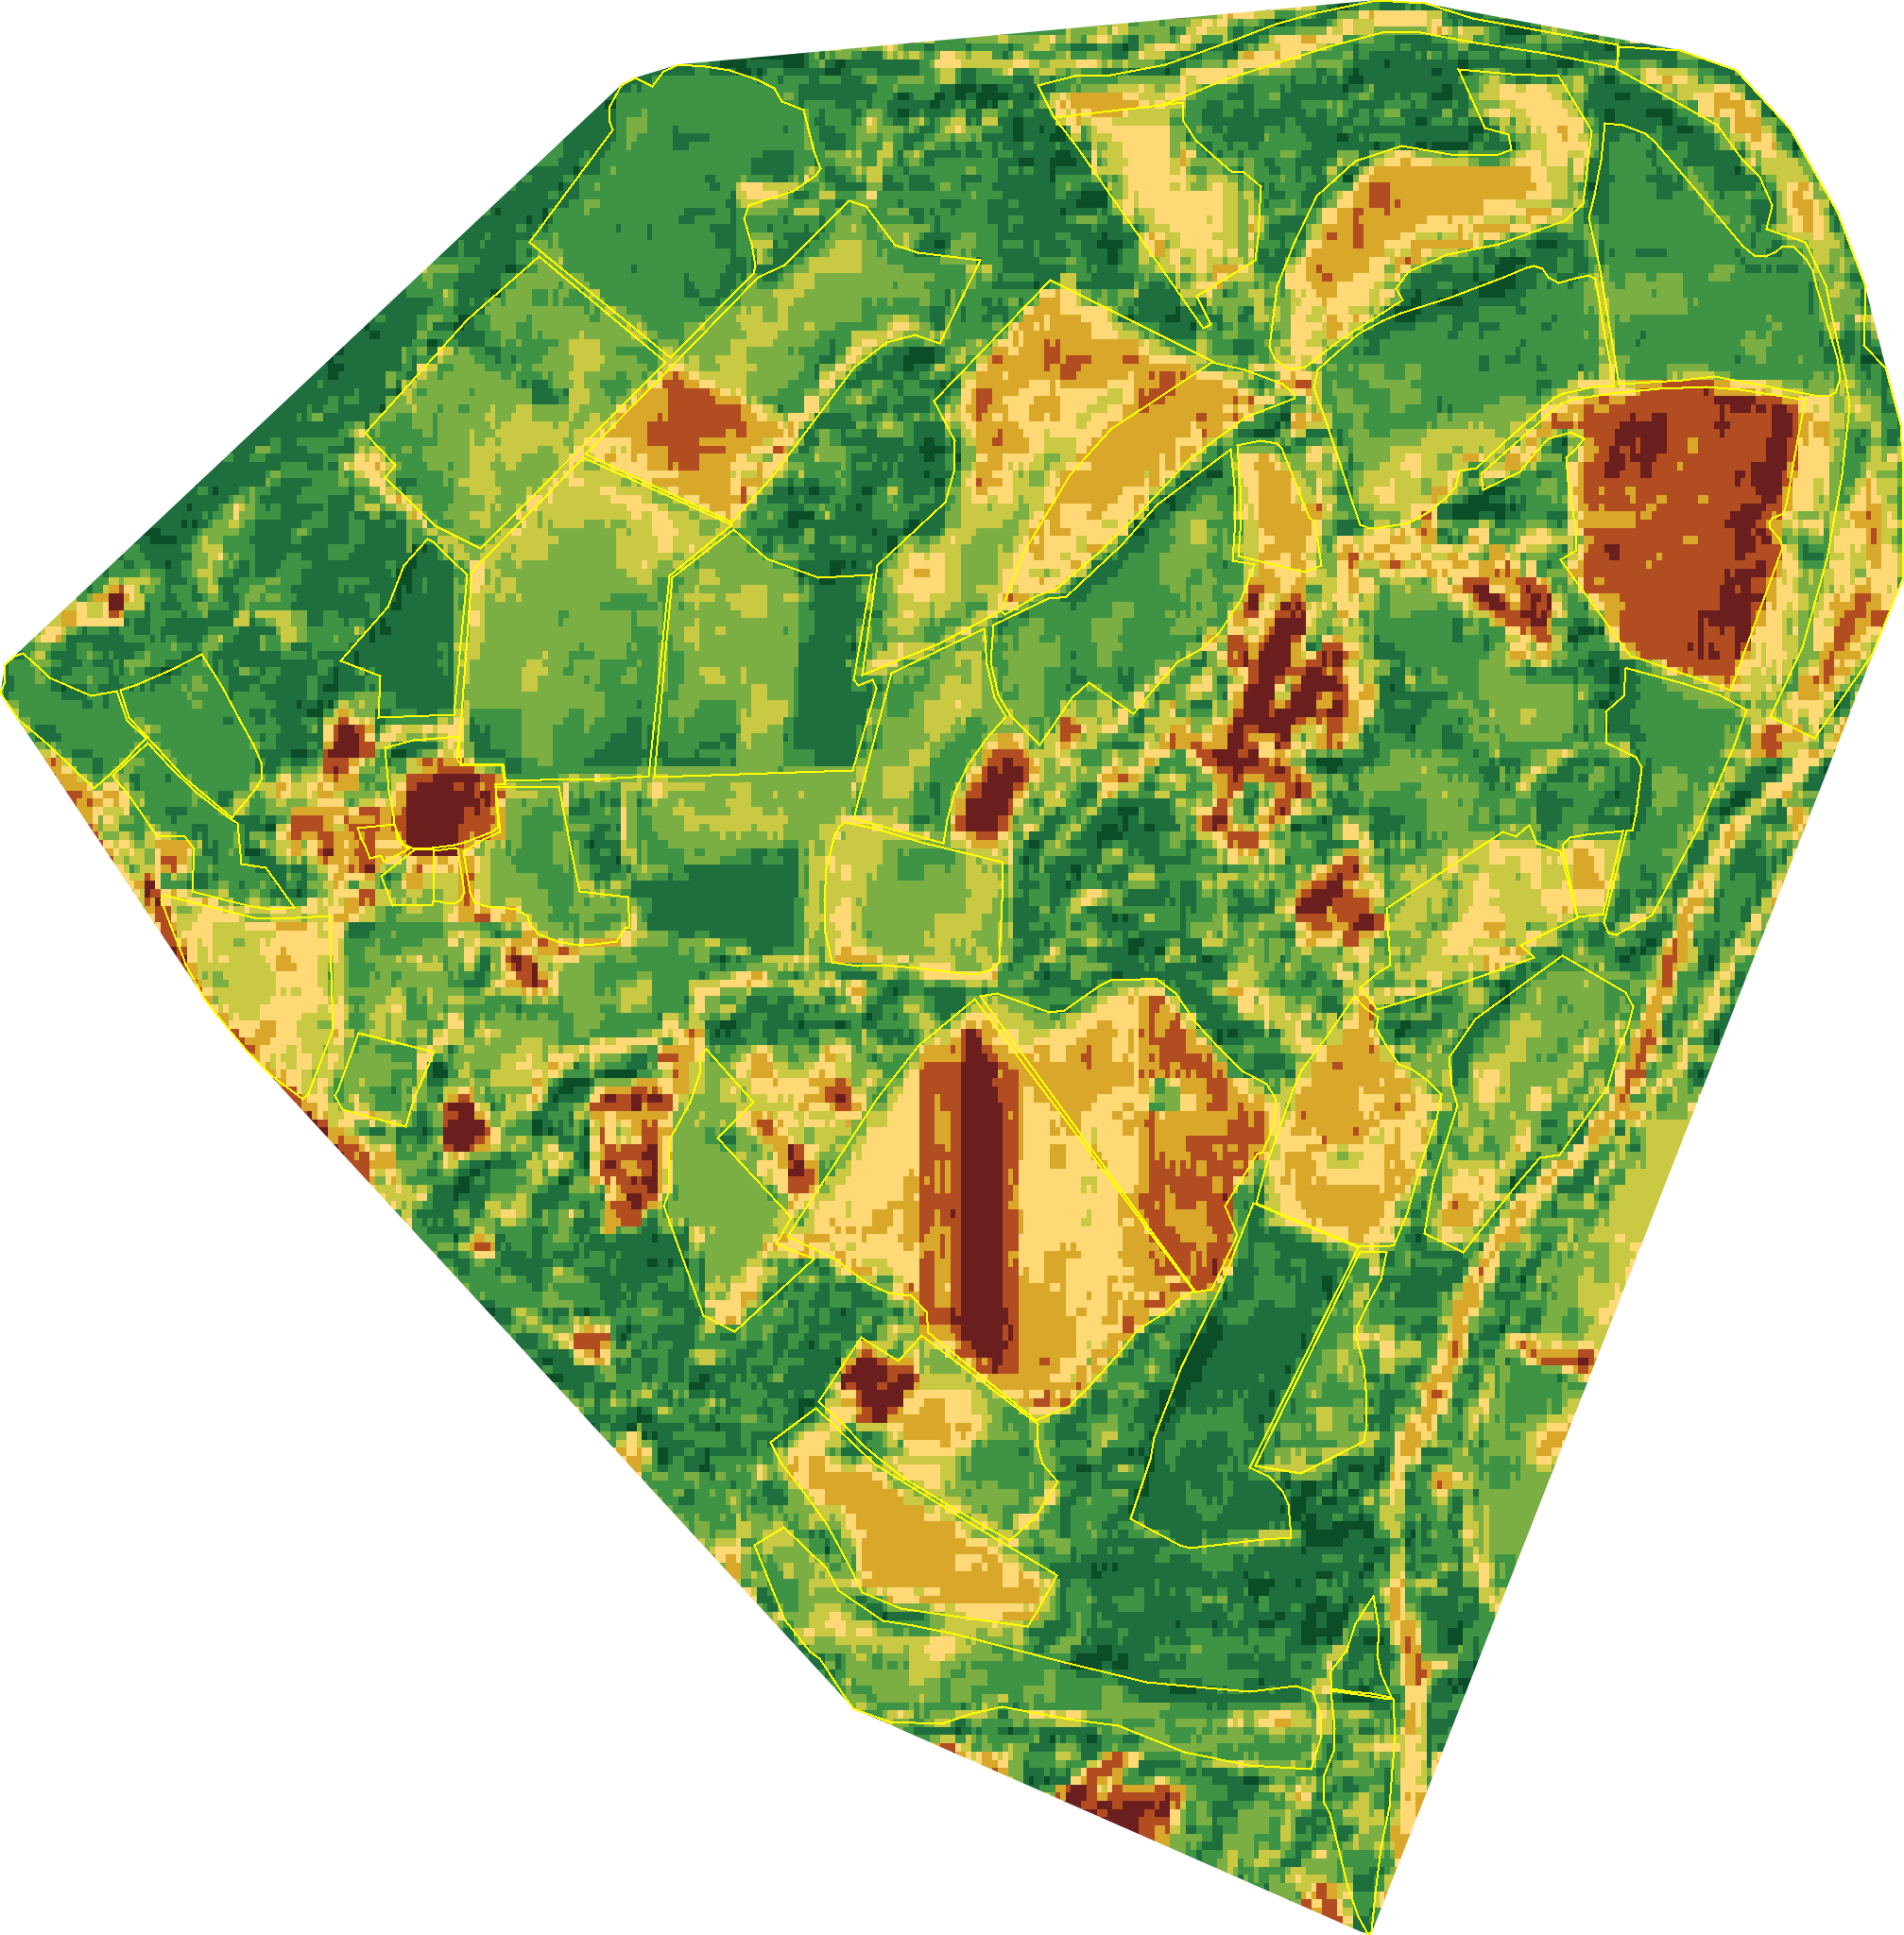
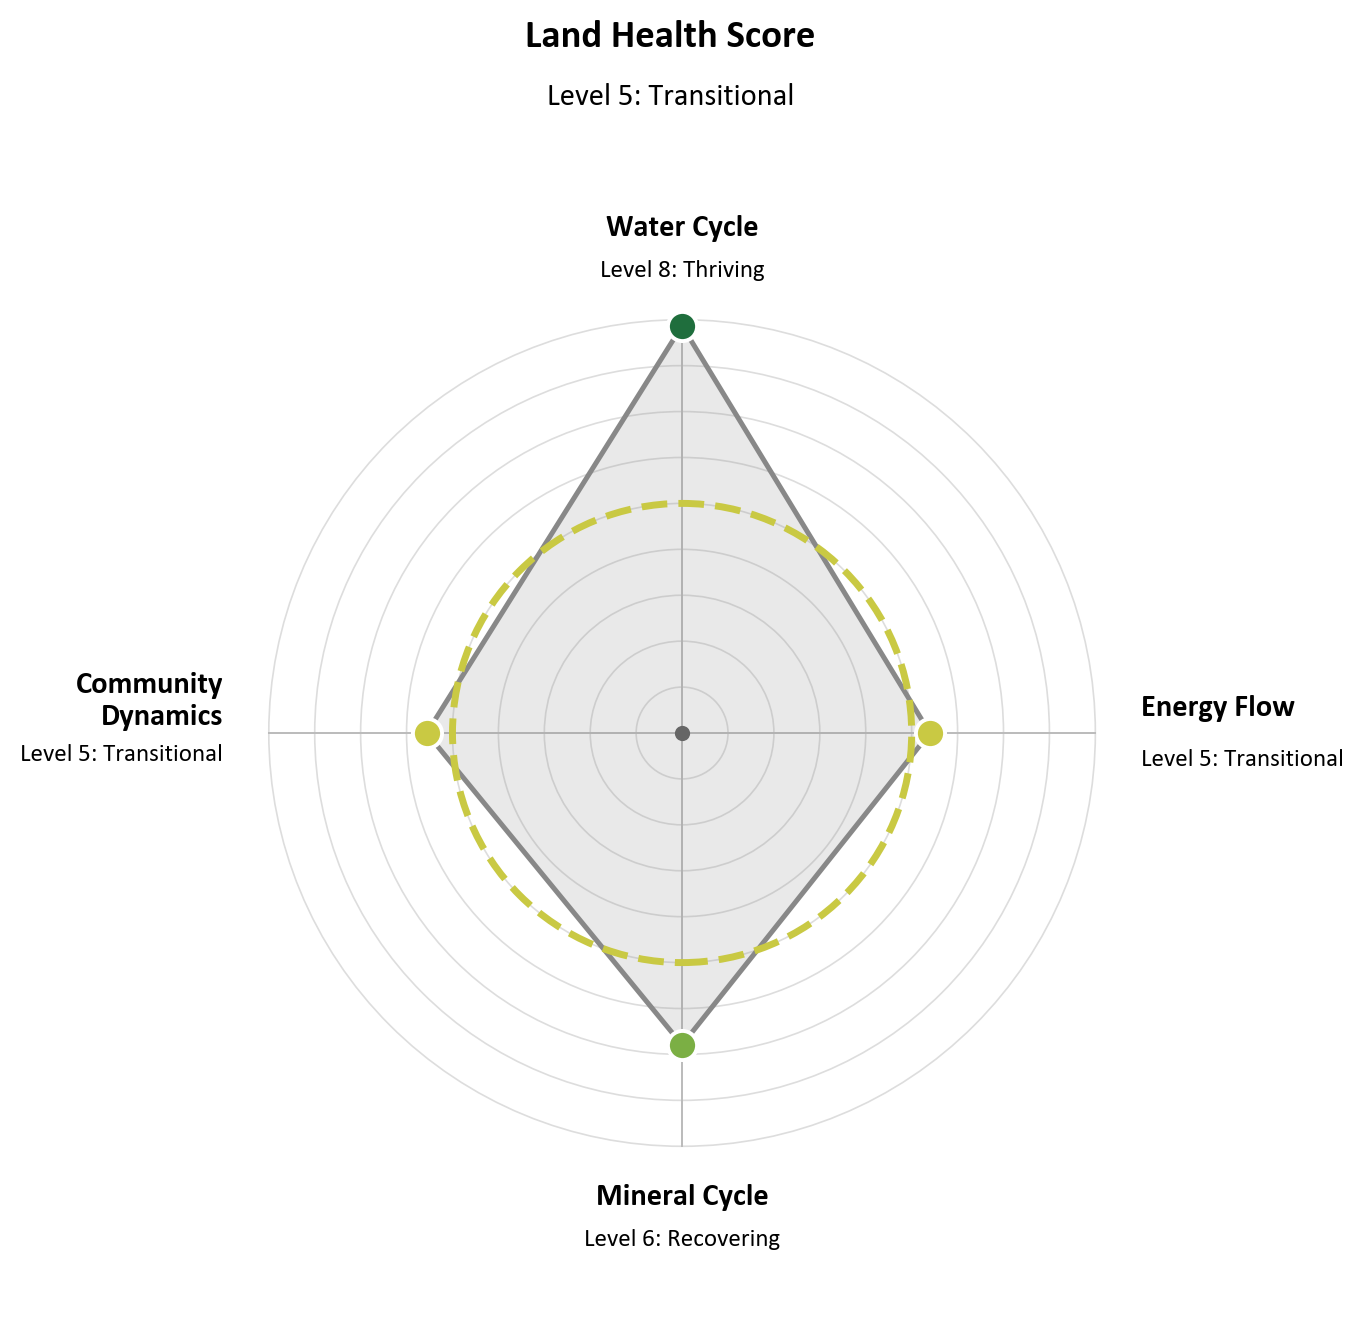
This is why the mapping and the diagnosis belong together. The map you browse to plan a fence line and the score you act on to change a grazing plan are built from one set of layers. They never disagree, because they are the same data seen two ways.
Where to start
If you are new to this, start with three layers and one question.
- Open the winter hillshade and the Topographic Wetness Index together and find your cold, wet ground. Walk one of those spots to check it matches what you see. It will.
- Open the Land Health Score for a field you know well and follow it across two or three springs. See whether it climbs early or late, and whether it drops after you graze.
- Pick one field where the score behaves worse than you expected, and read its aspect, slope and wetness. Often the ground itself is the reason, and once you know that, you manage the field for what it is.
From there, the Atlas gives you the full set of layers to plan tracks, water, shelter and tree planting on the level and in the right places.
What this does not do
Two honest limits. First, EcoIntel supplies the layers and the scores; you supply the judgement. The maps show you the cold wet corner and the field that dropped after grazing. Deciding what to do about it is your call and your advisor’s, made with knowledge of the farm the satellite does not have.
Second, the Land Health Score is calibrated on grassland and pasture, which is where it is strongest. The terrain and mapping layers work anywhere, but the scoring is built and tested for grazing systems.
Within those limits, the point stands. The layers that explain your land already exist. EcoIntel builds them for you, puts them in one place, and reads them together so you can see the farm in ways you never have.
Ready to look? See the mapping tools, or open the free demo on our Wilder Wood Farm site and turn the layers on yourself.
Frequently asked
What map layers does EcoIntel build for a farm?
Winter and summer hillshade, slope and aspect at 10 m resolution, contours from 1 m to 25 m, the Topographic Wetness Index, keyline zones, valley and ridge networks, keypoint locations, an aerial basemap with field boundaries, and enterprise-suitability layers. Fifteen-plus map layers sit in the Visual Property Atlas, and sixty-plus signals run across the whole system. You do not build any of them; EcoIntel pulls the data, runs the analysis and styles every layer for you.
Do I need GIS software or GIS skills?
No. Reproducing these layers yourself would mean pulling elevation data, running hillshade and wetness in QGIS, loading Sentinel imagery in Google Earth, then reprojecting and styling each layer by hand. That takes real GIS skill and hours per farm. EcoIntel does all of it and keeps it current. You open a field and read it.
How do I use several map layers together?
The value comes from reading two or three at once. Put winter hillshade next to the Topographic Wetness Index and you find the cold, wet, shaded corners. Add the Land Health Score for each field over time, and the grazing dates, and you can see whether a field was grazed before it had recovered. EcoIntel lays the layers side by side; you and your advisor reach the conclusion.
Is EcoIntel just a mapping tool?
No. The same layers that show you the land also score it. EcoIntel reads them to rate each field on the four ecosystem processes and to give it a Land Health Score from 1 to 9, week by week, back to 2018. Mapping and diagnosis run on one set of layers, so what you browse for planning and what you act on stay consistent.