
Deep Knowledge
You cannot sample the past, or can you? How EcoIntel assesses a farm's ecosystem condition back to 2018
A soil core taken today cannot tell you where the land was in 2018. See how a satellite record assesses ecosystem condition backwards, year by year.
A soil core taken today cannot tell you where the land was in 2018. That sounds obvious, and it is, but it sits under one of the hardest problems in regenerative farming. We ask farmers to prove their land is improving, and we often ask them to prove it against a starting point that nobody measured at the time. You cannot dig a hole in the past.
I want to make the case that, for the satellite era at least, you can read the past, and that doing so changes the conversation about proof, about carbon, and about who the evidence is for. Every figure and picture below comes from Wilder Wood Farm, our 175 hectare demonstration farm, read every year from 2018 to 2025.
The trend is the truth, and the trend needs a past
Anyone serious about measurement says the same thing: the honest signal is the direction over several years. One flattering set of figures or one set of bad results proves little. Also, soil carbon can vary within a few metres in the same field, so sample readings carry far less certainty than the market often asks of them. What you can trust is the trajectory, read the same way, year after year.
But a trajectory needs a past to run from. If your first measurement is the day you enrol, you have a point, not a line, and you will wait years before the line means anything. Worse, the farmer who has already been rebuilding their land for a decade gets no credit for it, because the work happened before anyone was counting.
This is the gap a satellite record closes. Public satellites have been recording every field on Earth every few days for years. Read that archive properly and you can reconstruct where a farm’s land health already was in 2018, and every year since, before you ever visit.
Reading a farm’s condition, not just its practices
The thing being read here is ecosystem condition: whether the land is functioning. It is the quality of the land, scored against the healthy reference for its own place, and it is the term the nature-disclosure frameworks have settled on. We explain it in full separately; the short version is that EcoIntel reads four ecosystem processes from satellite, weather-corrects them, and scores them against each site’s ecoregion reference as a Land Health Score from 1 to 9.
Most of agriculture has not met this idea yet. The trade is wedded, understandably, to what you can touch: a soil test, a worm count, a sward stick. Those are real and they matter. But they are point-in-time, they are expensive, and they cannot be run on every field every year. Ecosystem condition is a different and bigger view. It tells the land steward how the whole place is functioning and which way it is heading, and it does so on a grid, back to 2018, for the relatively small cost of software.
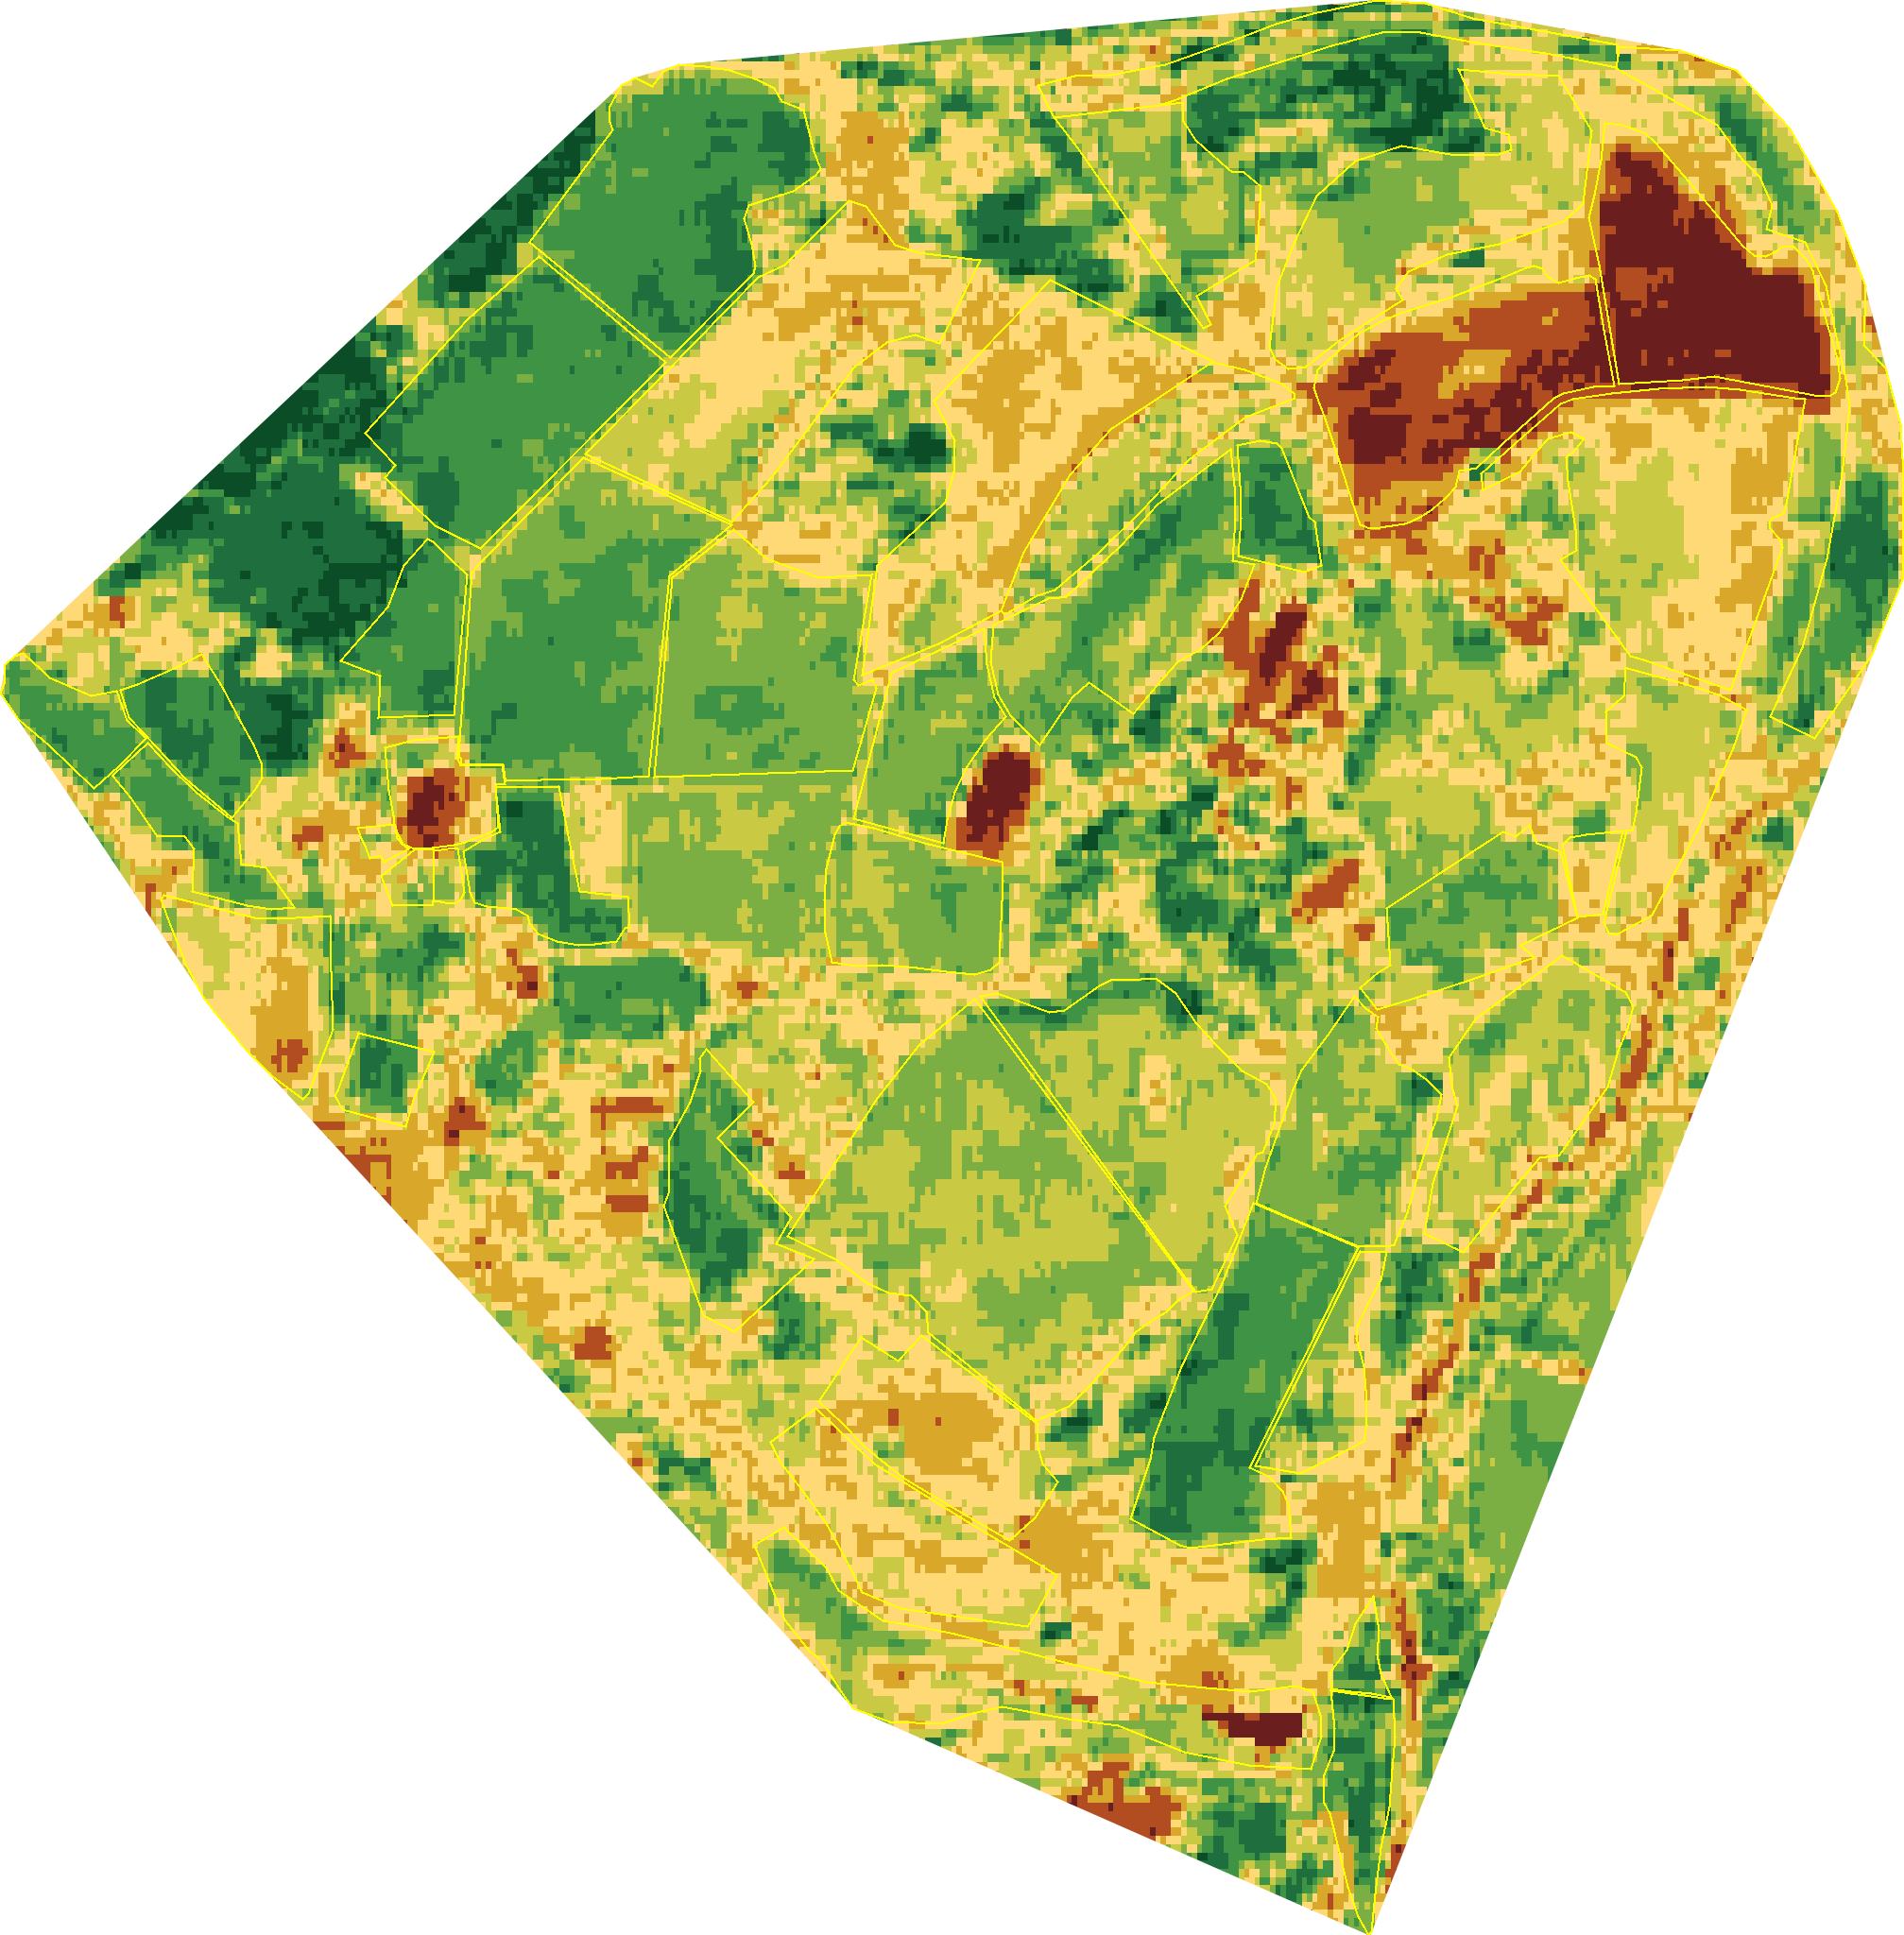
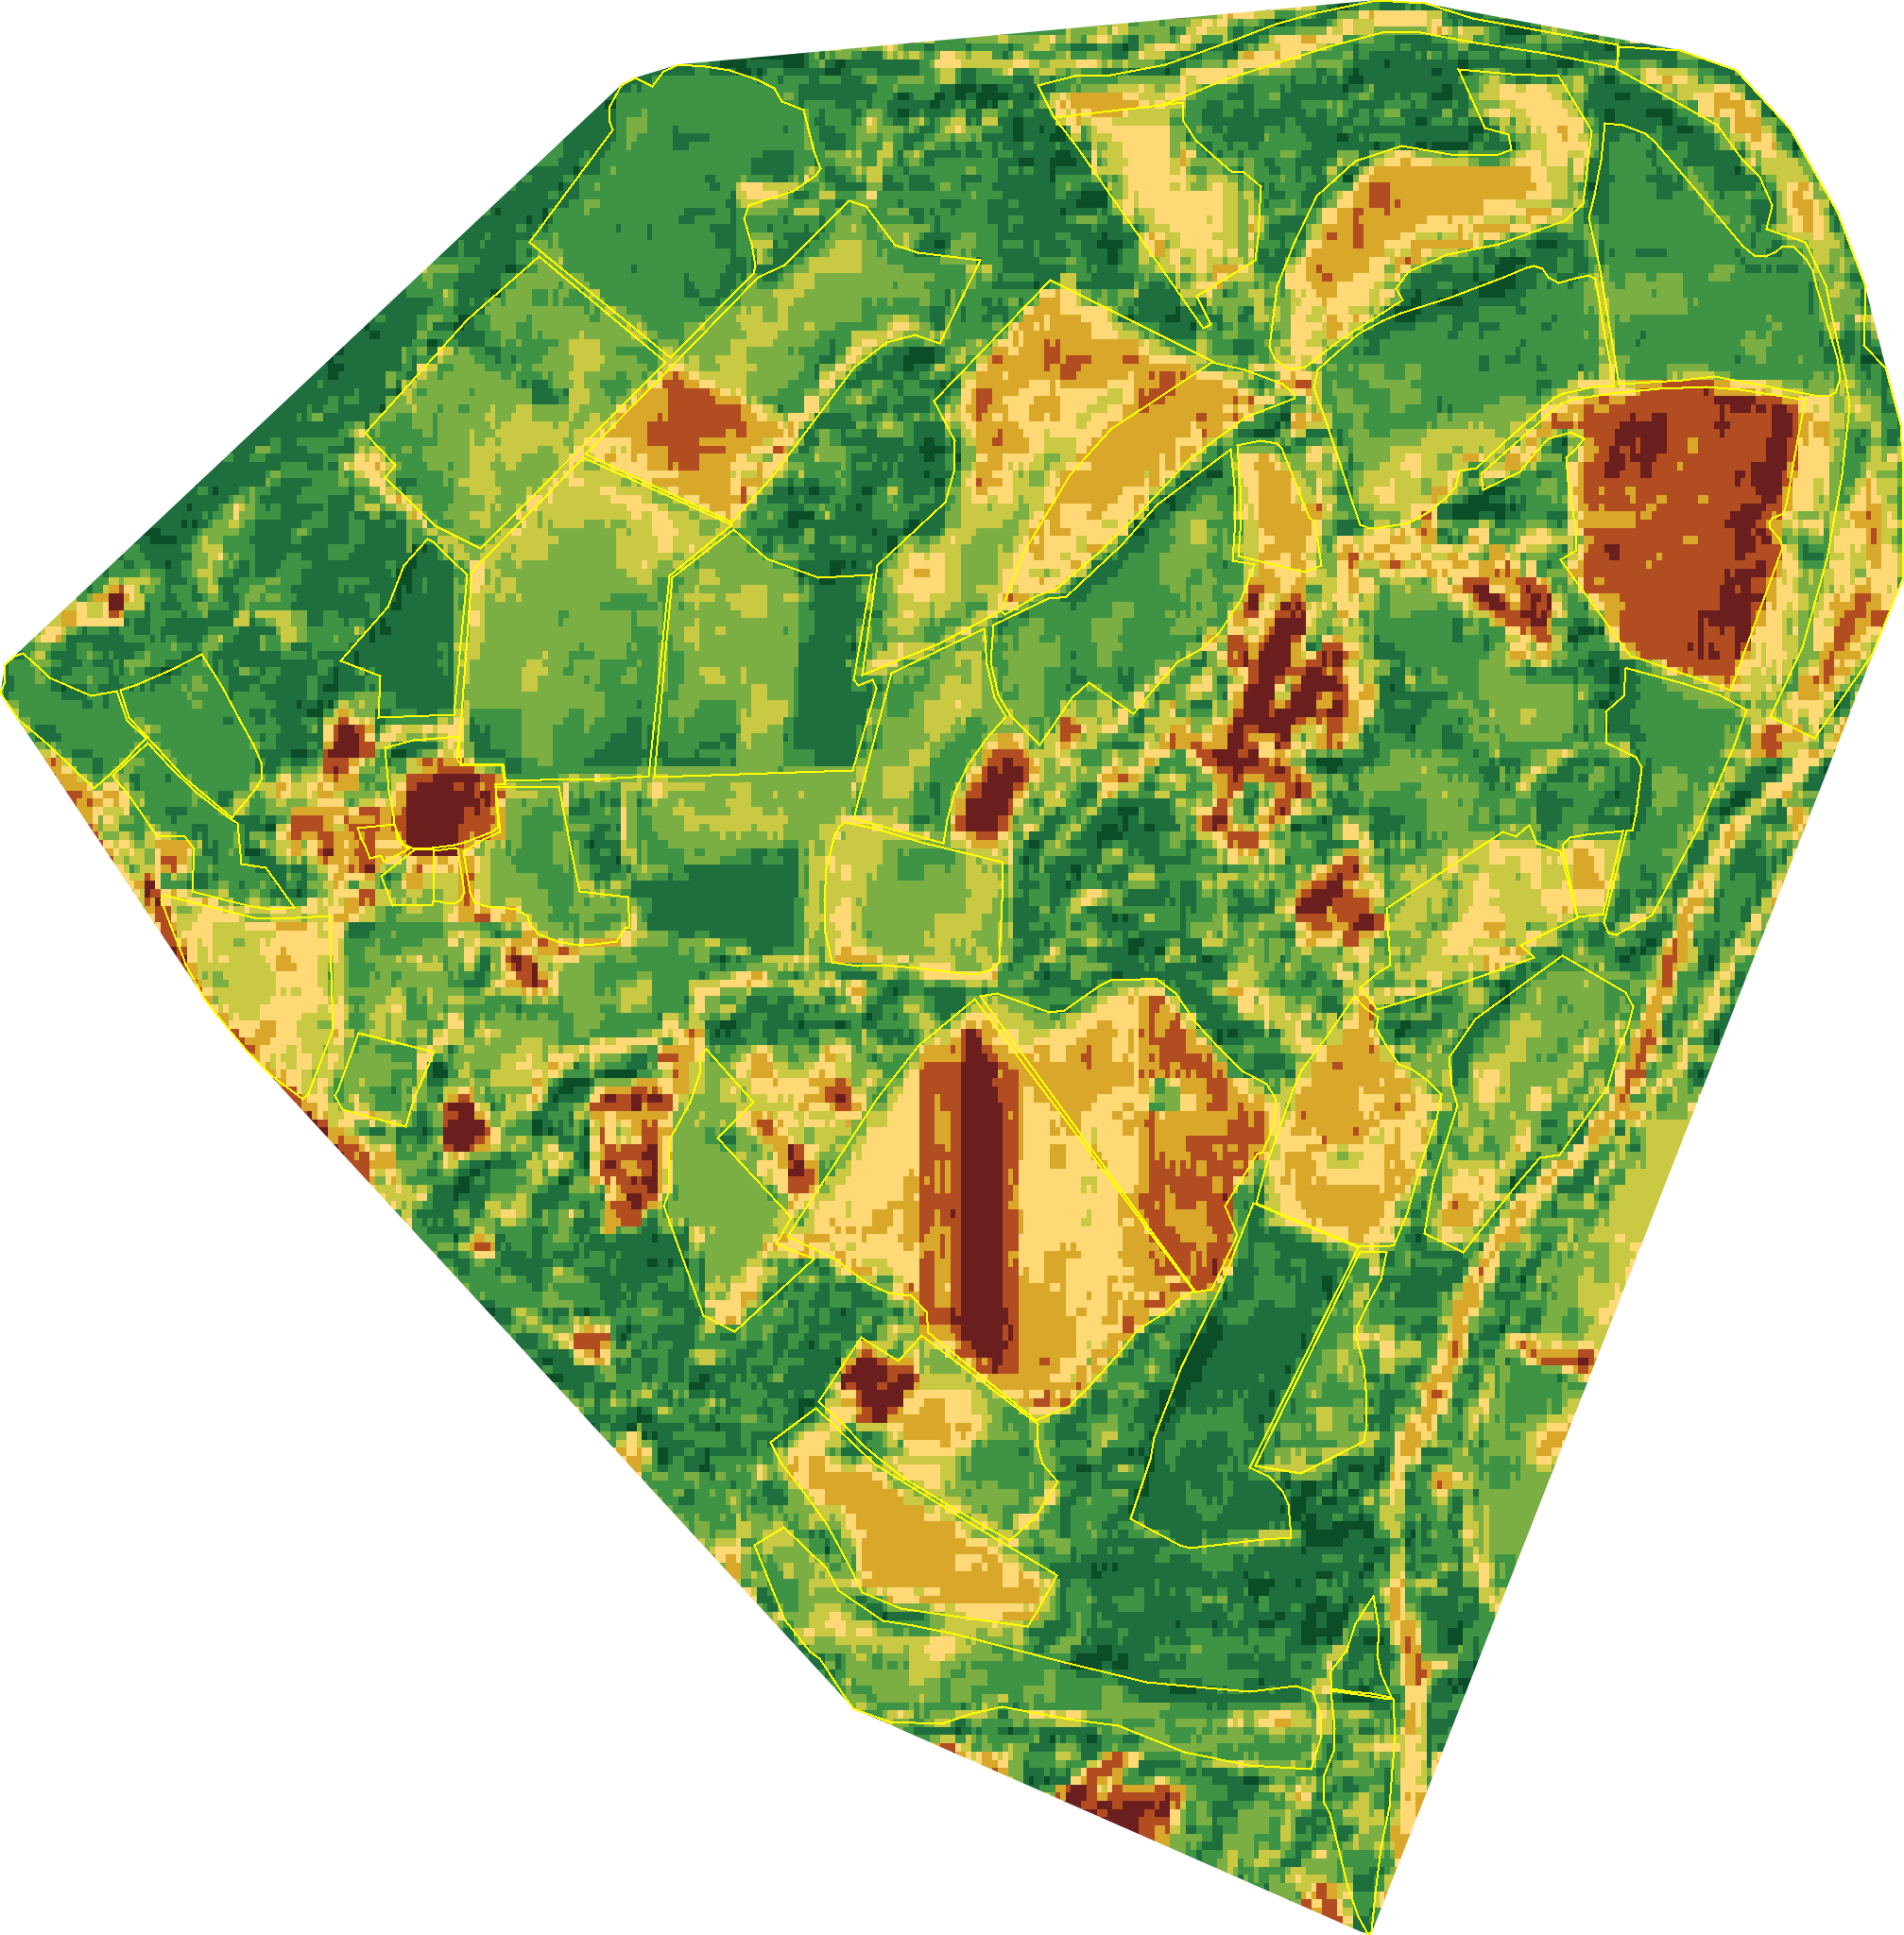
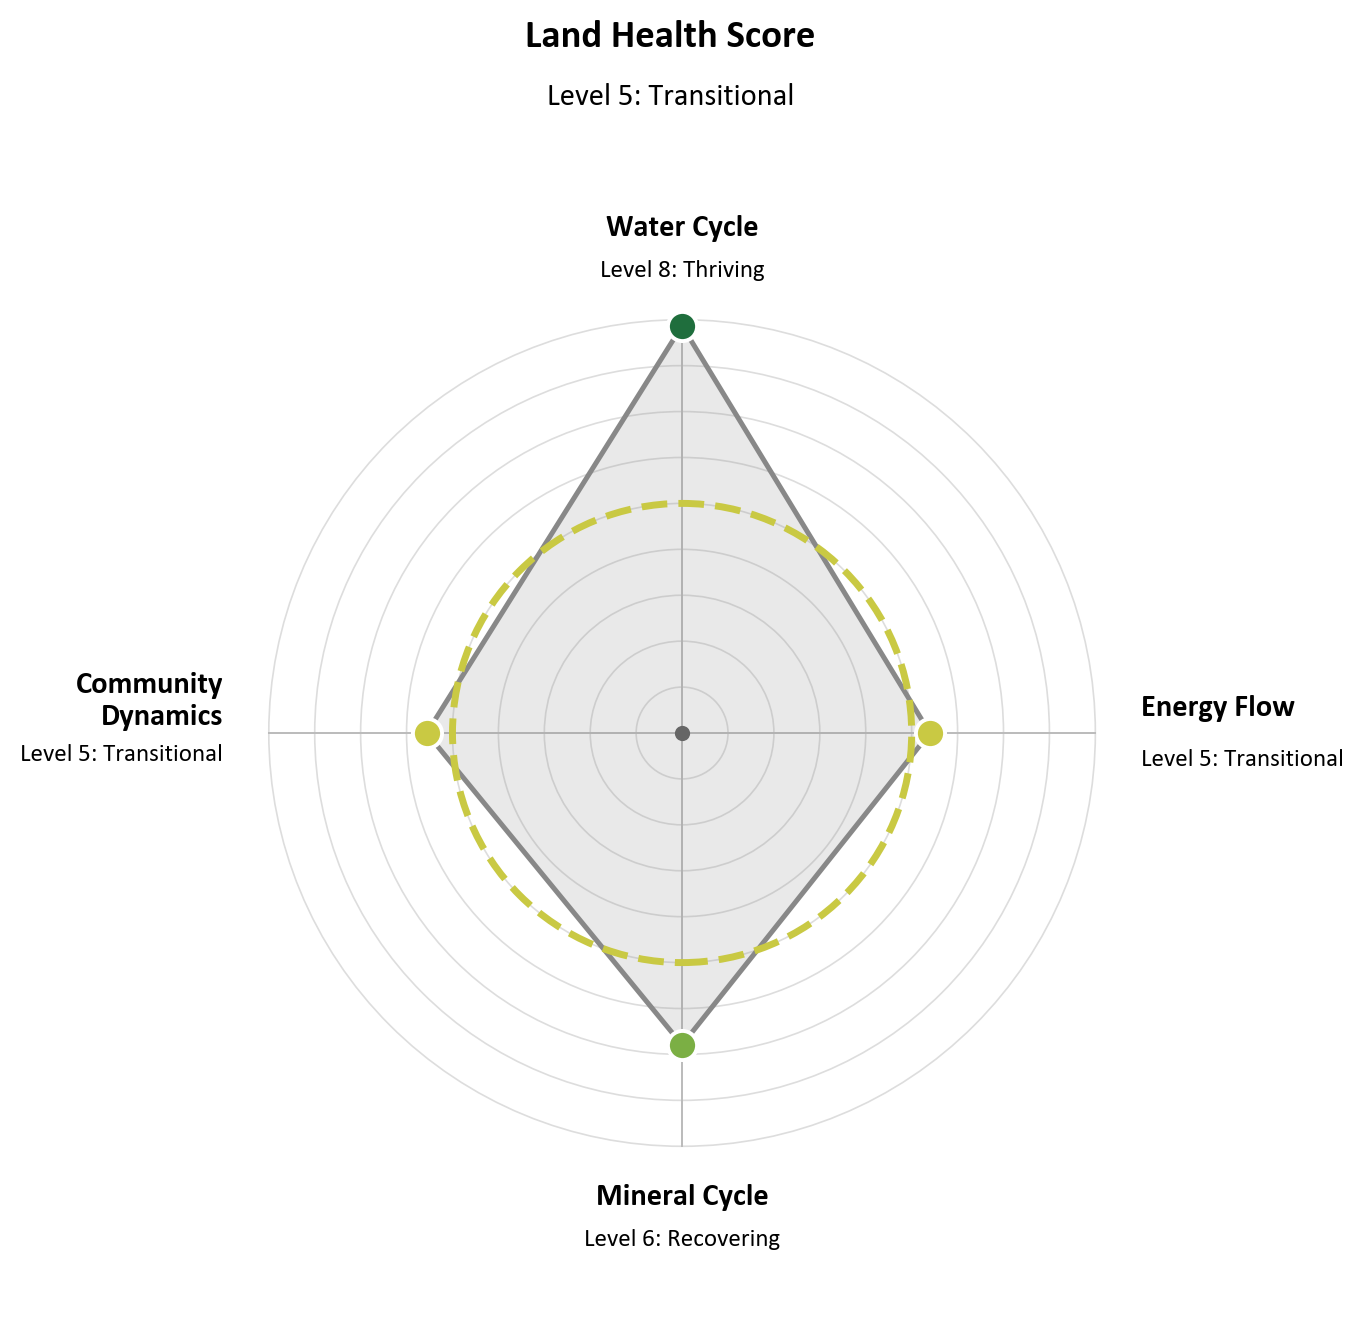
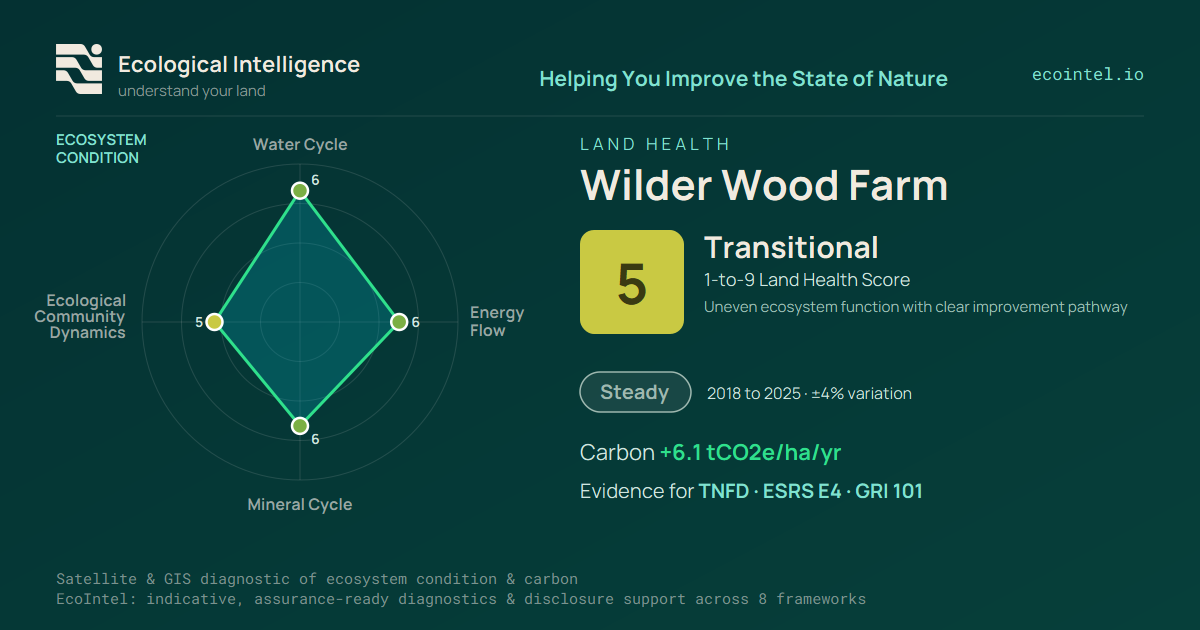
On Wilder Wood the four processes read like this: water cycling is strong at 83 percent of reference, minerals cycle well at 66 percent, energy capture is holding at 63 percent, and the ecological community index is the weakest process at 54 percent. That same ranking repeats on almost every grassland field. It is the classic signature of a farm whose grazing has restored the water and nutrient cycles, while the mix of plants in the sward has yet to catch up.
Weather-corrected, so the trend belongs to the management
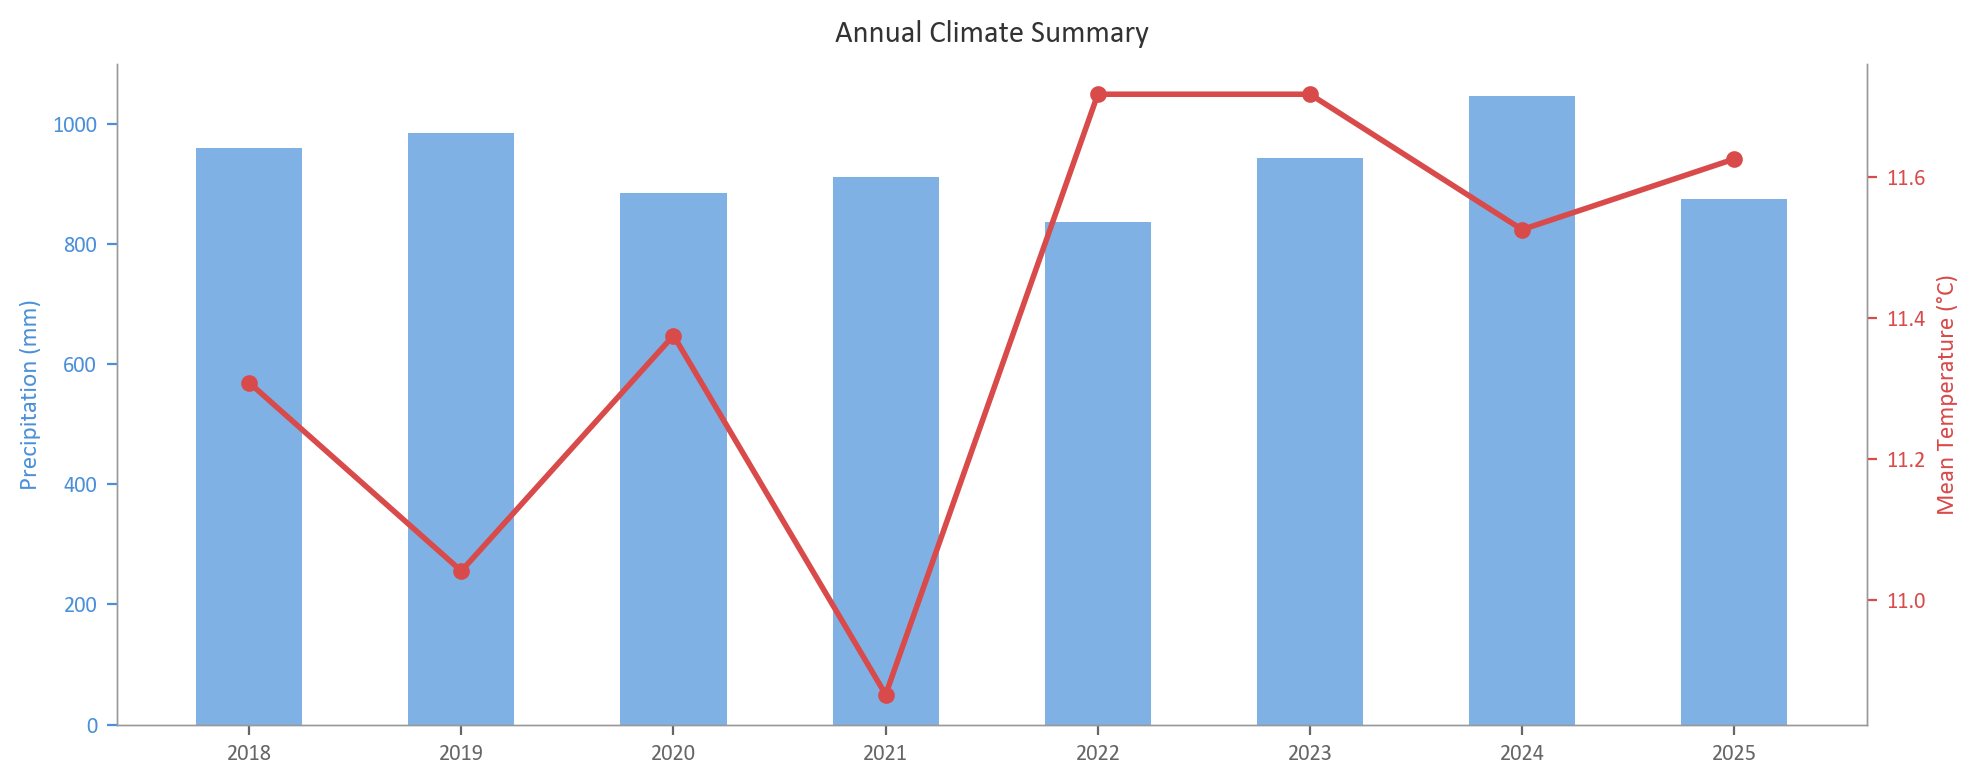
A read backwards is only worth having if it separates what the farmer did from the weather. A dry summer pulls every score down whether the grazing was good or bad. EcoIntel is capable of differentiating ecosystem health from good and bad weather.
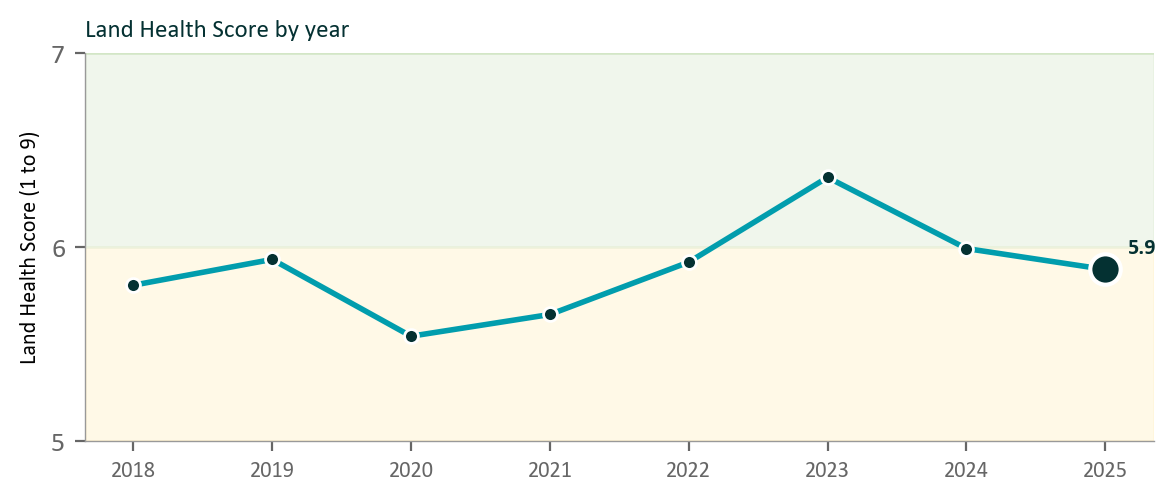
You can see it working. The Wilder Wood farm climbed from 58 percent in 2018 to a peak of nearly 64 percent in 2023, dipped in 2020, which was the driest and most stressed year on the farm, and settled at 59 percent in 2025 after a warm, dry growing season. The small drop from 2024 to 2025 is recognised as being due to the weather, not management. The underlying line since 2018 points up. That is what genuine regeneration looks like in the data: direction up, individual years knocked about by rainfall and heat.
Not an accredited MRV, and that is a strength
Here is the point I most want to land. EcoIntel is not an accredited Measurement, Reporting and Verification scheme, and it does not try to be. That is a deliberate choice, and it is one of the tool’s real strengths.
An accredited carbon MRV certifies a single number against a recognised method. That is exactly what you need to issue a tradable credit, and it is the right tool for that job. But a single certified number, resting on one method with known field-sampling variability, is a narrow thing to hang a farm’s reputation on. If the certification system is discredited, so is the good work of the farm.
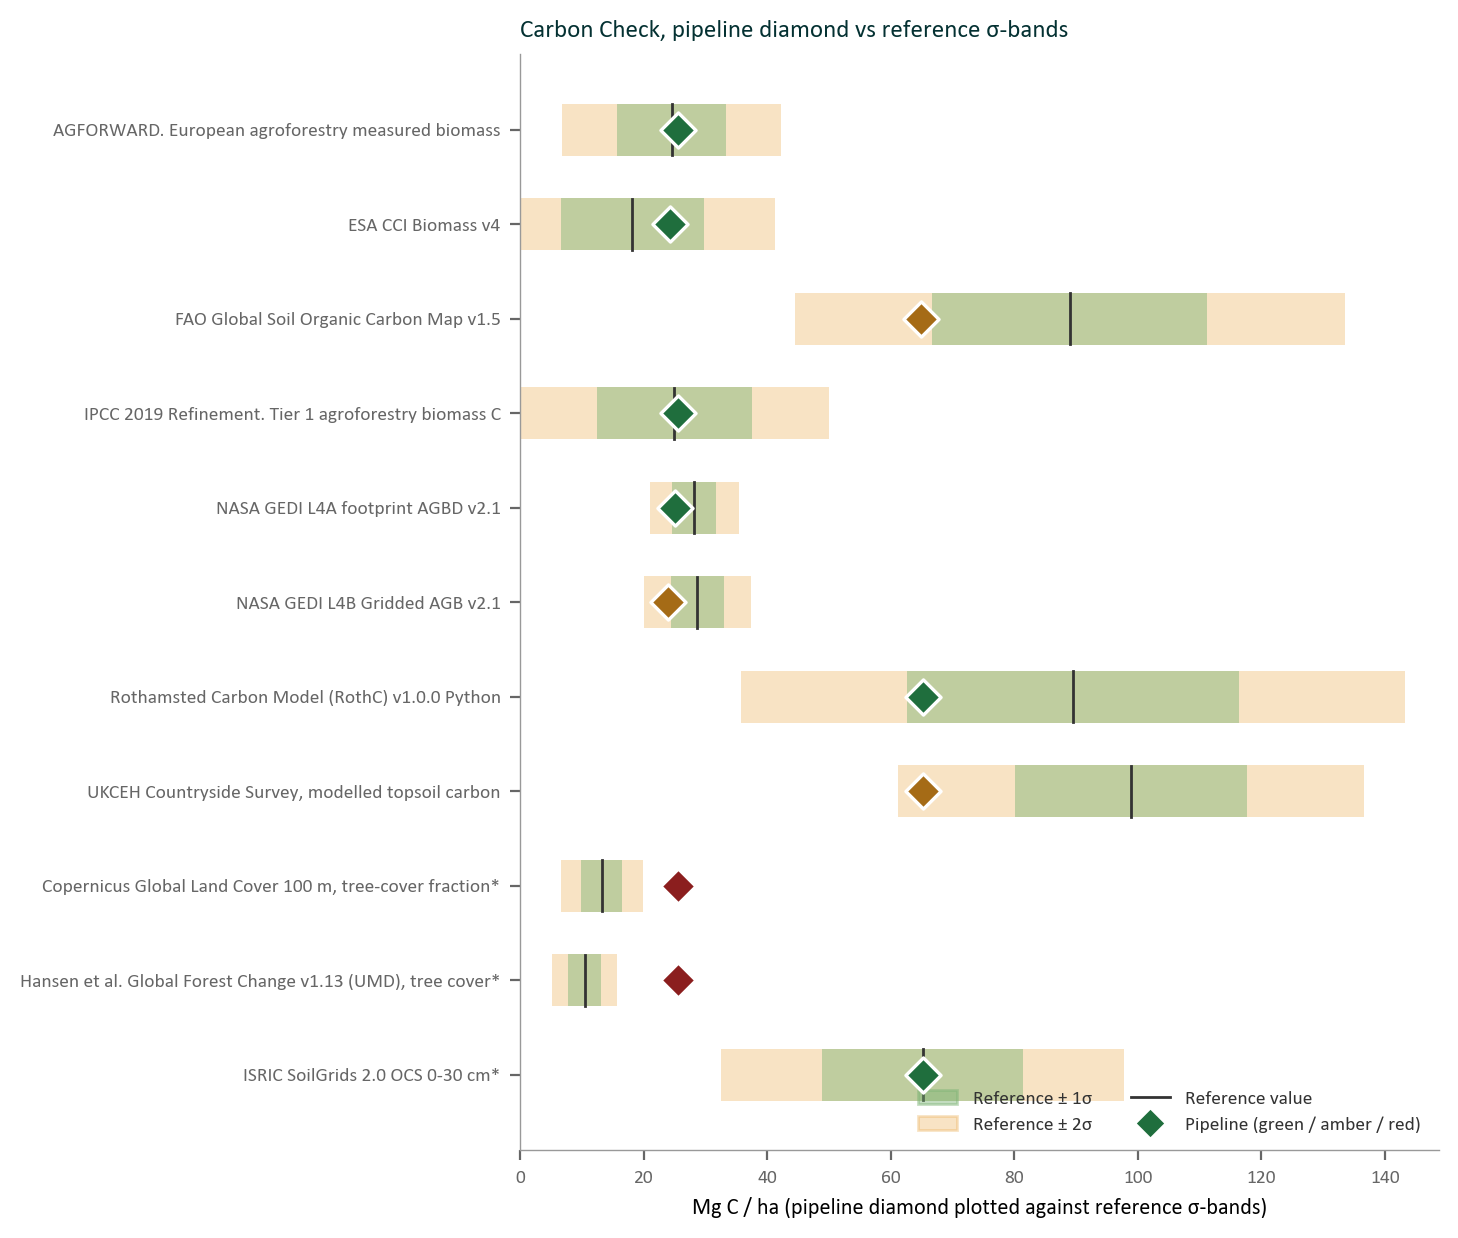
EcoIntel takes the opposite discipline. Every carbon figure is checked, parcel by parcel, against a library of independent published reference datasets: ESA’s global biomass product, NASA’s GEDI forest structure, ISRIC’s SoilGrids, the FAO global soil-carbon map, IPCC default factors and Rothamsted’s RothC soil model, among others. Each reference gets a verdict on a published confidence band, and wherever our figure and a reference disagree by more than expected, the report shows both numbers side by side, with the reason for the gap and what we would do about it. The instruction to the reader is plain: treat our figure as the working number and the reference as the corroboration.
That is far more scrutiny. On Wilder Wood, for instance, one global land-cover product reads the biomass of the wooded strips at half our figure, and the report explains exactly why: that product’s canopy-to-biomass curve is built for closed forest and does not fit trees scattered through pasture, and its 100 metre pixel blends narrow tree lines into the grass around them. A single certified number would have hidden that disagreement. Our approach surfaces it and explains it.
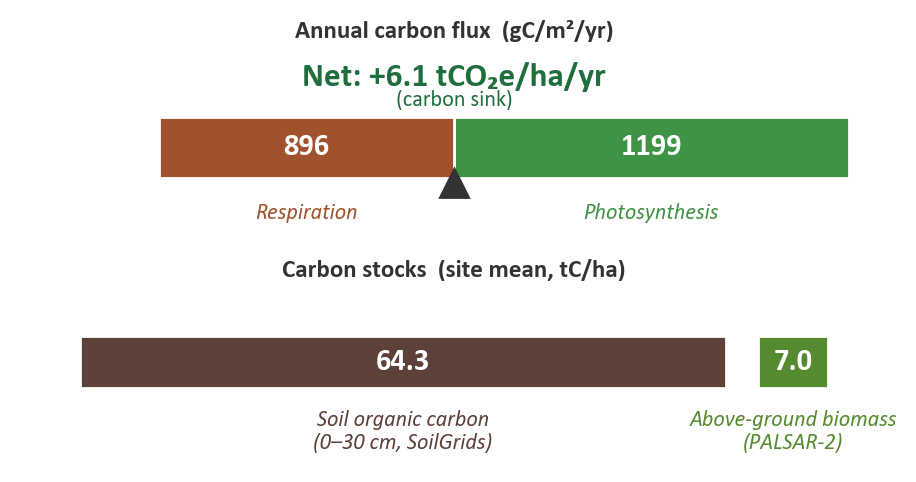
And because it is honest about what it is, it is safe to build on. The carbon figures are indicative, for direction of travel and internal management. They are not for sale, retirement or offsetting. For that you still need an accredited third party. Saying so plainly is what lets a serious person trust the rest.
One measure, many readers
Once you have a defensible read of ecosystem condition, look at how many people can use it.
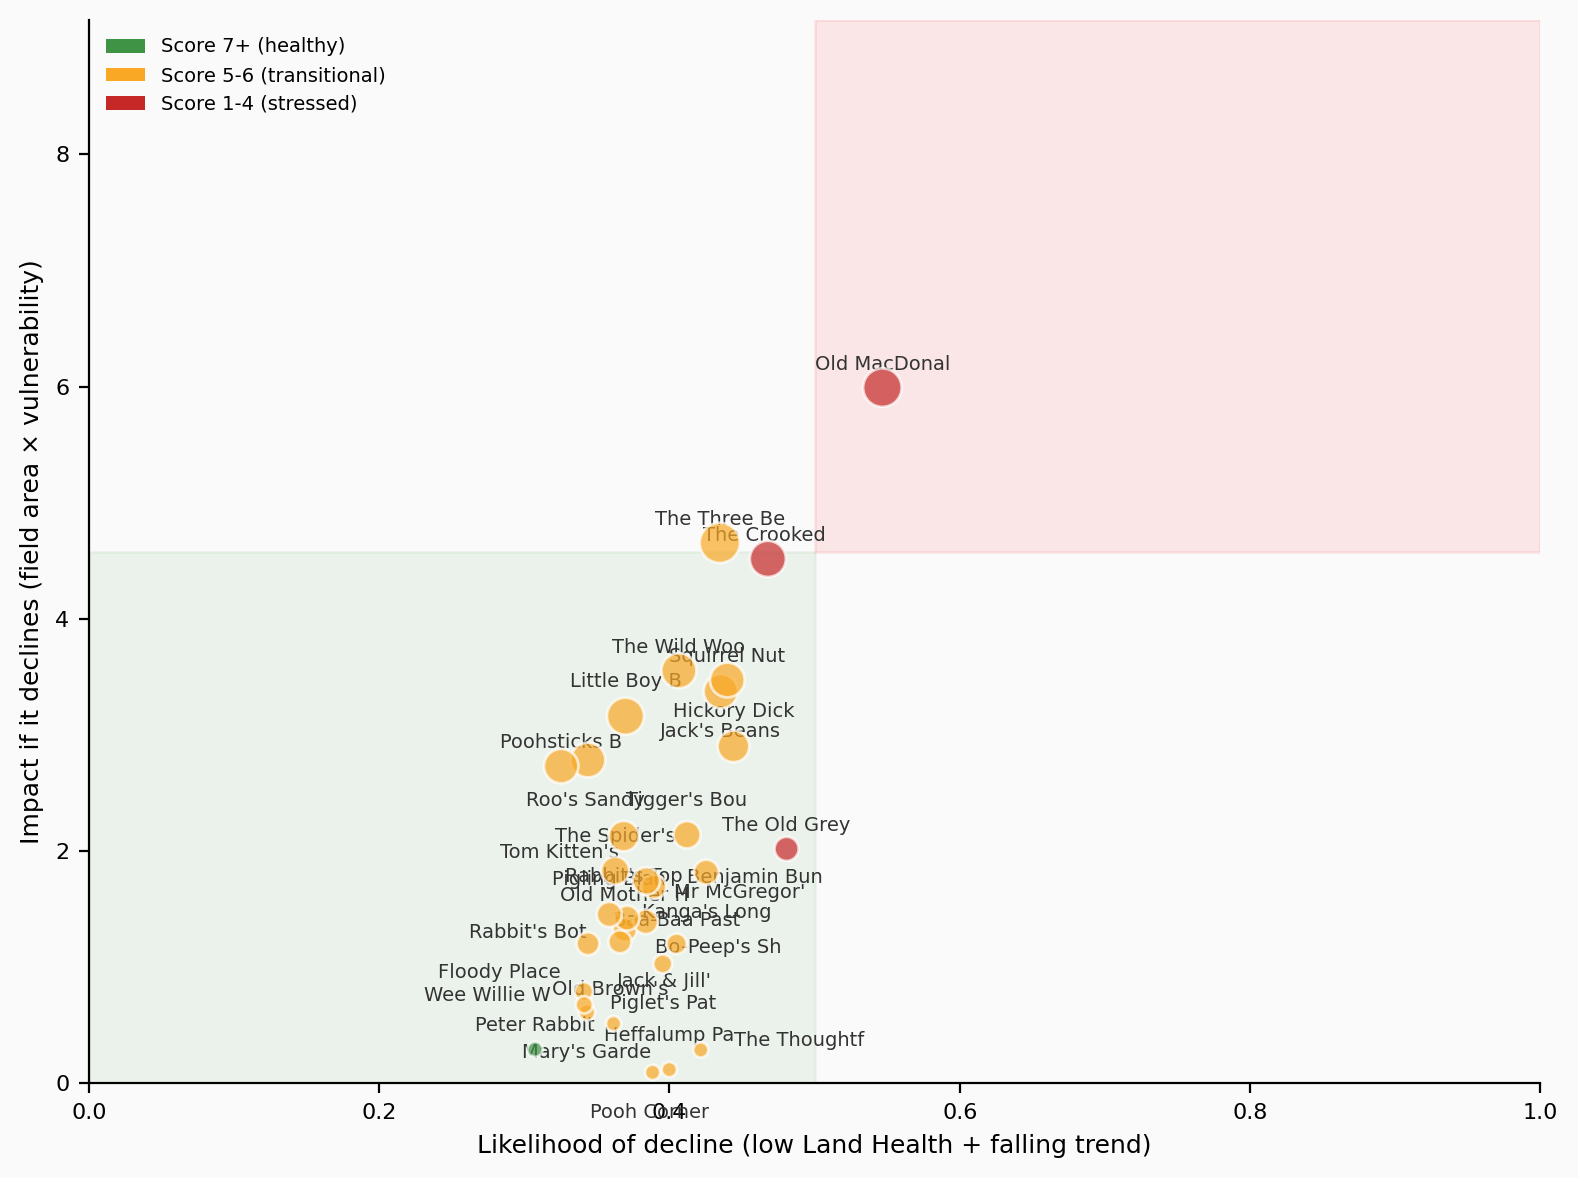
The land steward can use it to understand the whole picture of their land and to see whether their work is paying off. The buyer up the supply chain can use it to answer nature questions under CSRD and TNFD. The insurer can use it to price the risk of the land-related activity they are underwriting. The bank can use it to write nature-aligned credit. Until now each of those readers has commissioned their own survey, on their own schedule, at the farmer’s cost in time and disruption.
They are all asking about the same thing: the condition of the land. So EcoIntel reads it once and serves all of them. The same assessment produces a disclosure summary mapped to the frameworks the corporate world now uses, TNFD LEAP, ESRS E4 for nature, E1 for climate and E3 for water, and a shareable land-health credential the farm can hand to a buyer or a lender.
The diagnostic: why, and what to do
A score on its own changes nothing. What makes ecosystem condition useful to the person on the ground is that EcoIntel also explains the cause and names the next move.
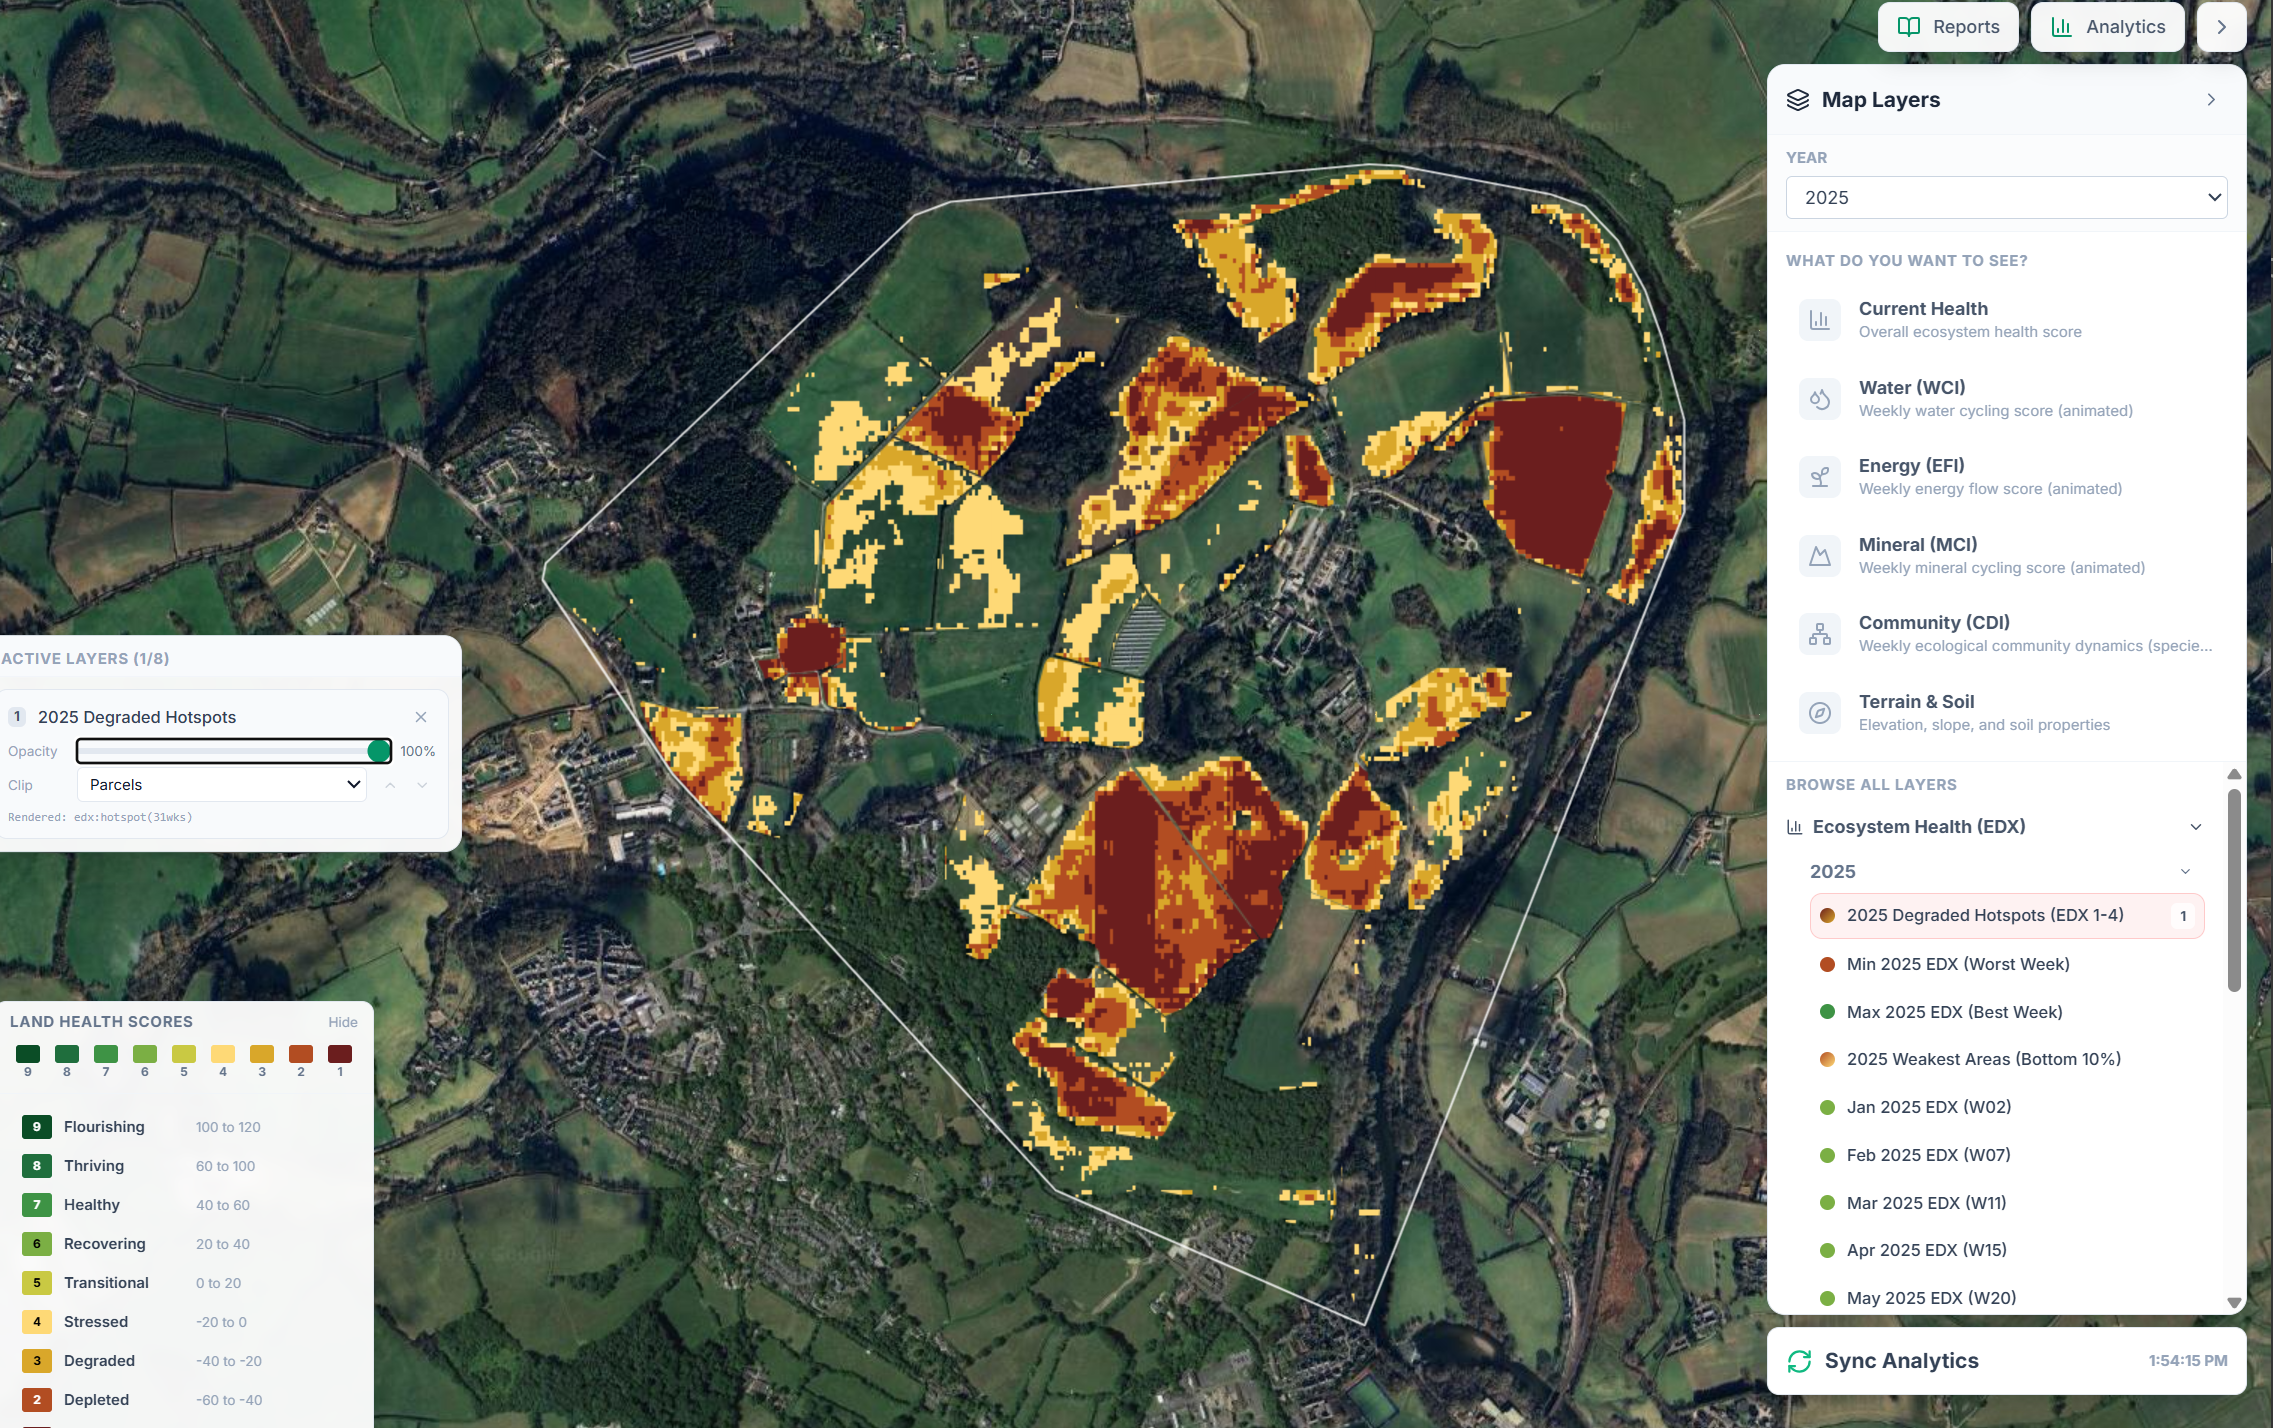
On Wilder Wood the diagnosis is clear: the water and mineral cycles are restored, and diversity is the weakest link. The report’s remediation recommendation does not start with placing an order for a seed mix. It starts with rest. Extend the recovery periods on the weaker fields, monitor by leaf stage instead of the calendar, never re-graze before the third leaf, and the suppressed species already sitting in the seed bank will get their chance to flower and set seed. Cut hay from the more diverse fields when the seed is ripe and trample it into the weak ones with a mob of cattle, which costs nothing and moves the genetics you already own onto the ground that needs them. Buying seed is the last resort, tried only after two or three years of the cheaper moves.
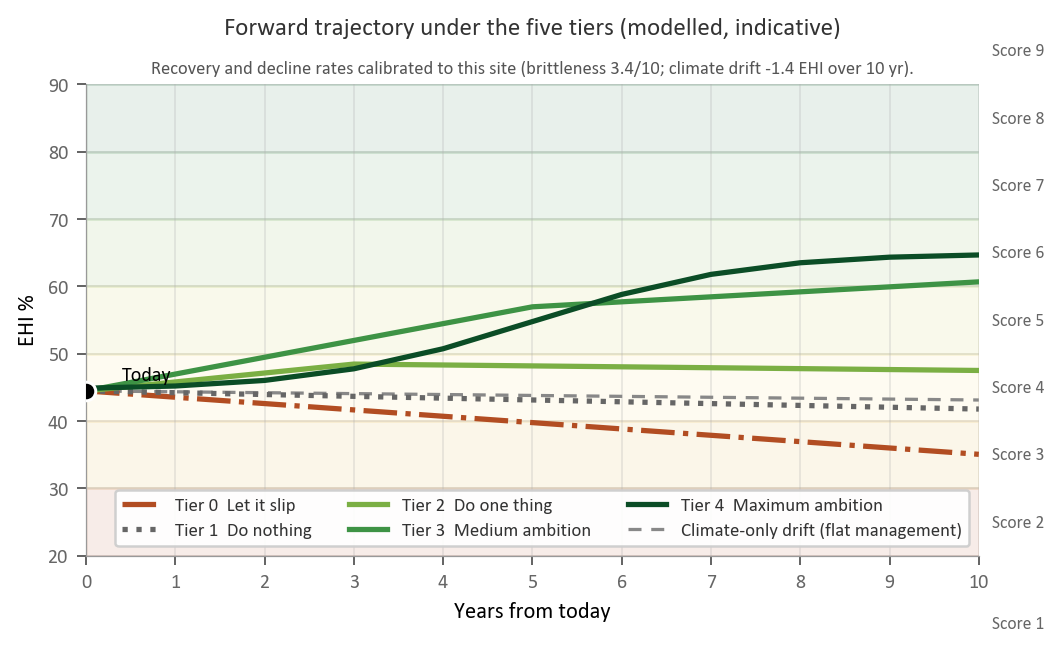
The report even quantifies it: deep-rooted forbs lift water cycling a further three to five points, legumes lift mineral cycling, and moving diversity from the mid-fifties to the mid-sixties should lift the whole farm’s Land Health Score by four to six percent over three to five years. That is a plan a farmer can act on, with a modelled trajectory for what each level of ambition would deliver.
Everyone gains, and it starts with the land steward
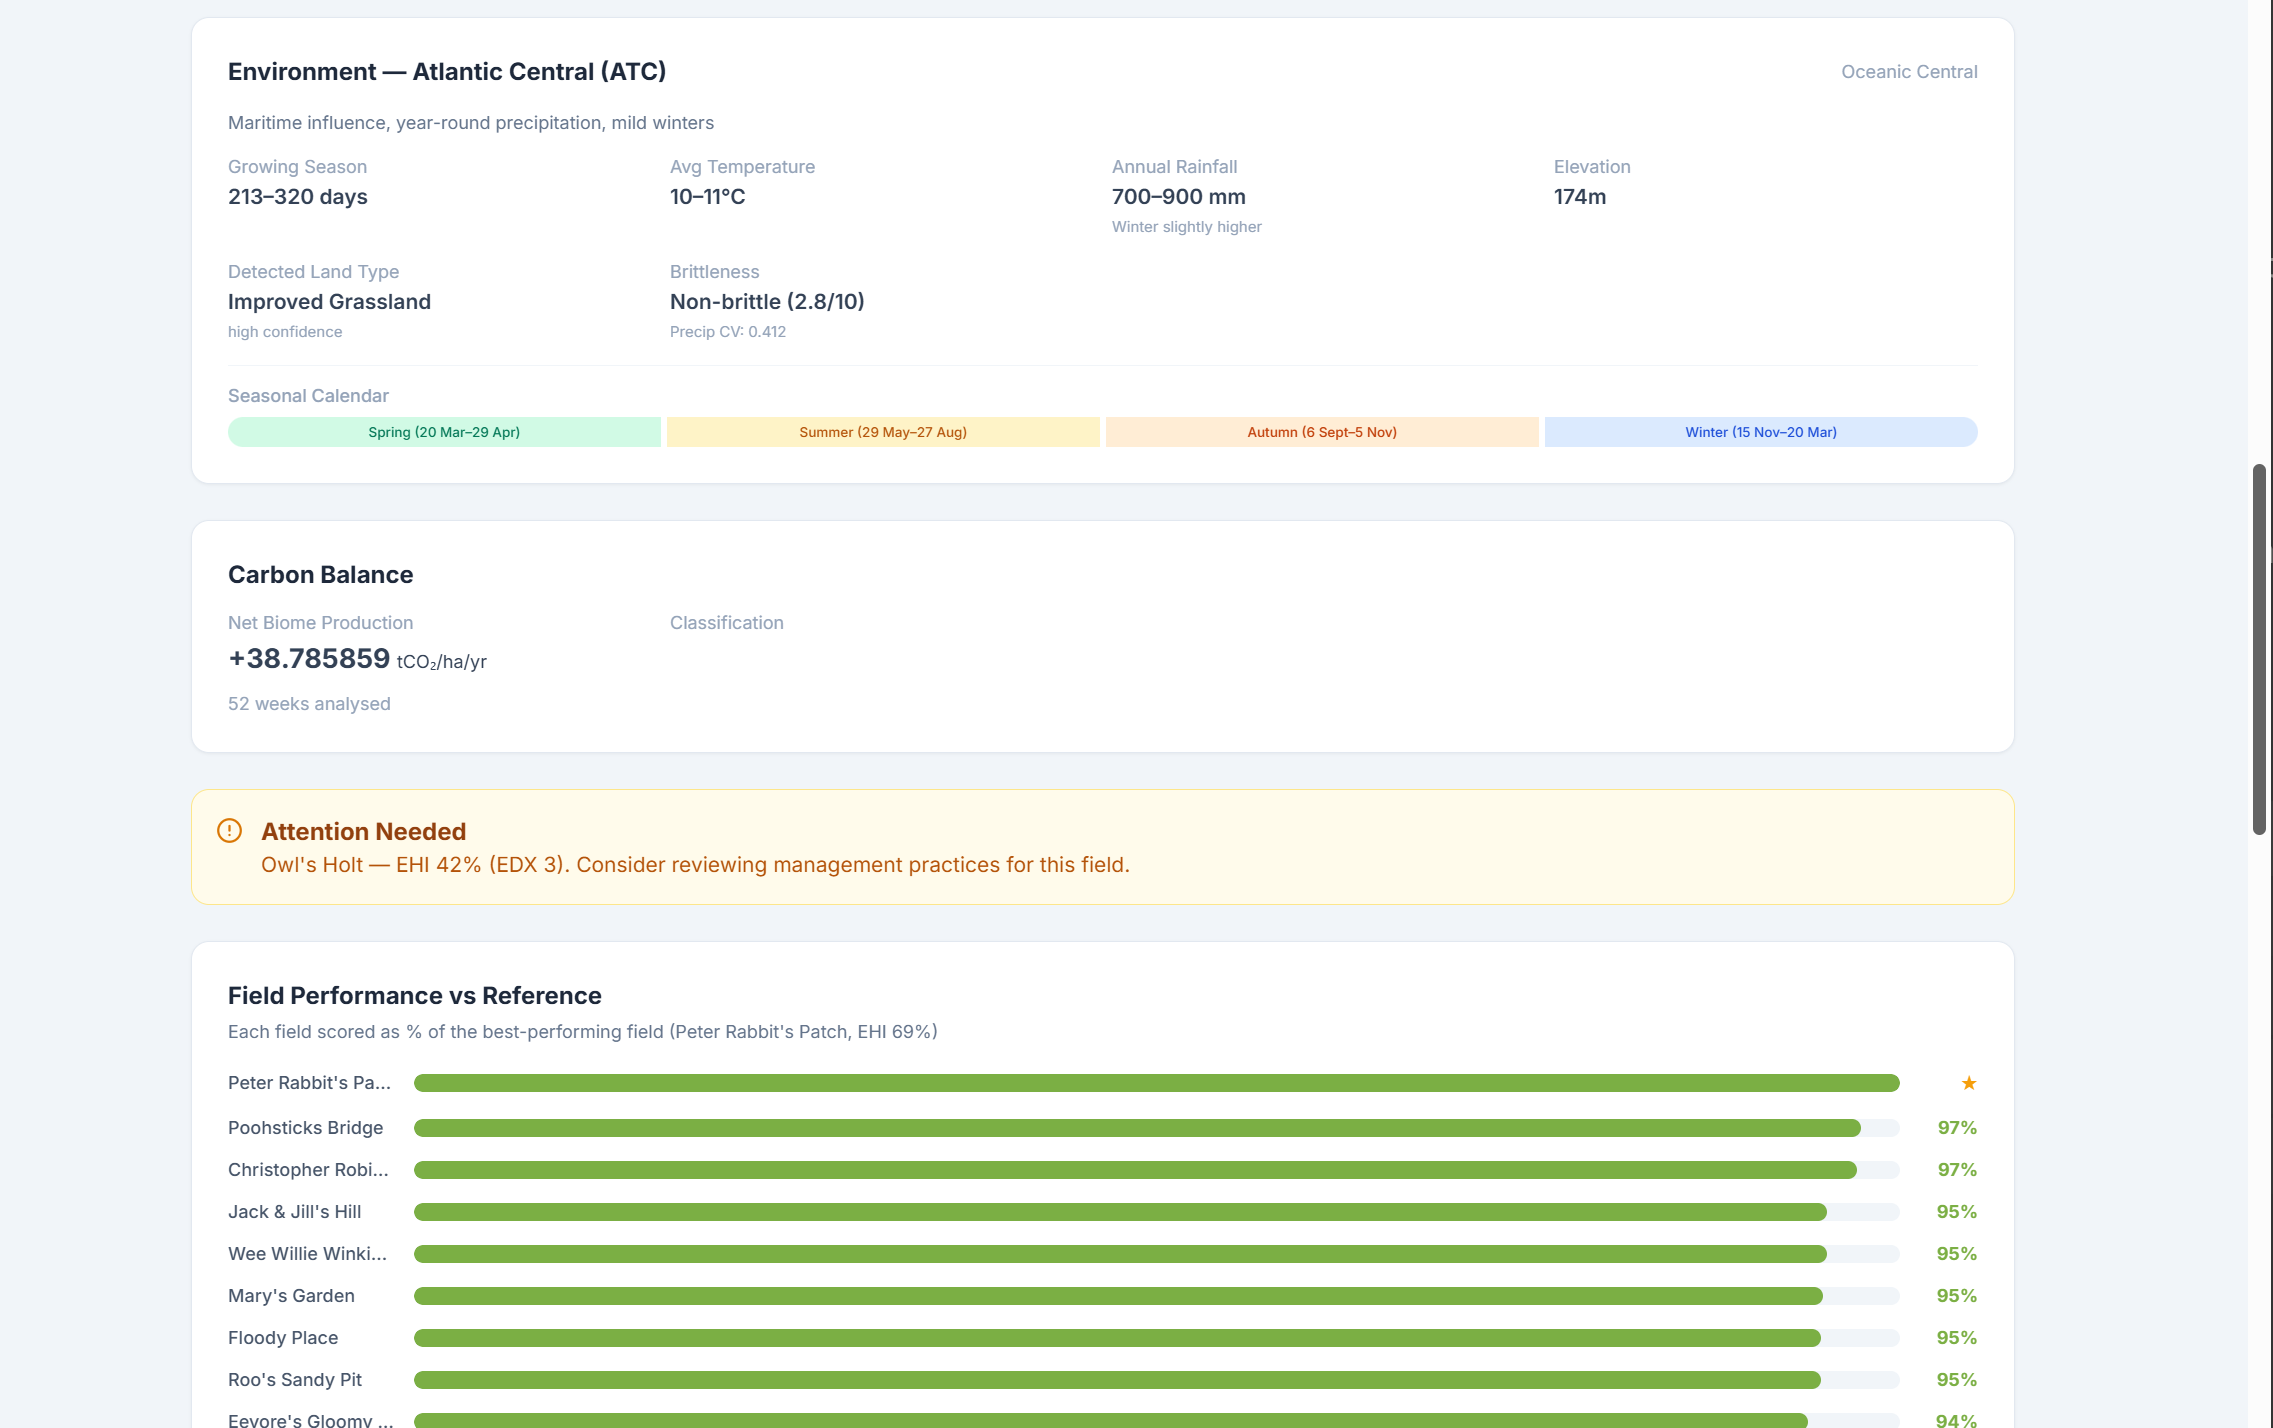
Put those together and the shape of it is simple. The land steward starts an improvement plan, watches the condition assessment confirm the improvement year on year, and hands the same evidence to the buyer, the insurer and the bank as automated disclosure, without commissioning a fresh survey for each one. The tool that shows the farmer what to do is the tool that saves everyone else the survey. The person making the management decisions on the ground comes first, and the rest of the chain is served from the work the steward does.
Where the spade still rules
None of this replaces the physical work of walking the land. But it makes that work more targeted, accurate and efficient. The satellite read tells you where the land is struggling and points the team on the ground to where a soil test or a walk is worth the cost. The spade and the lab then deepen the analysis, further enhancing decision-making. The principle here is to screen the whole farm widely using the remote sensing system, and only then sample deeply in the places that matter. The two work together, and each checks the other.
And there are honest limits. The scoring is calibrated hardest on grassland and pasture, which is what most of our demonstration farm is. A satellite cannot name the species in a sward, measure soil carbon at depth, count invertebrates or read the microbes. Those need boots on the ground. What it can do, that boots cannot, is see every field, every year, back to 2018, and hold the whole thing to the same standard.
So, can you sample the past? Not with a spade. But you can read it, and read it well enough to know whether a farm is genuinely improving, to explain why, to say what to do next, and to hand the answer to everyone who needs it. That is worth more to everyone involved than a single confident number from a single good day.
Frequently asked
Can you measure a farm's condition before you started monitoring it?
Yes, for the satellite era. Public satellites have recorded every field every few days since 2015, and a usable record for land health runs from 2018. EcoIntel reads that archive backwards and reconstructs a whole-farm ecosystem-condition and carbon picture for each year to 2018, then re-reads it every year since. A soil core cannot do this, because a core taken today only tells you about today. The reconstructed baseline is a modelled condition read anchored to published reference data, not a figure from a physical sample, and its job is to show the direction of travel and point the field team where to sample.
Is EcoIntel an accredited MRV or a carbon credit?
No, and that is deliberate. EcoIntel is an assessment, diagnostics and practical-guidance tool. Its carbon figures are indicative and are checked against a library of independent published datasets, with both numbers shown side by side and the reason for any gap. They are for direction of travel and internal management, not for sale, retirement or compliance offsetting. Issuing a tradable credit still needs a separate audited MRV run by an accredited verification body, which EcoIntel is not.
What is ecosystem condition, and why does it matter to more than the farmer?
Ecosystem condition is whether the land is functioning: how well it cycles water, captures energy, cycles minerals and holds a diverse community of life, scored against the healthy reference for that place. It is the measure the farmer needs to see the whole picture of the land, and it is the same measure a buyer, an insurer or a bank needs for nature disclosure under TNFD and ESRS E4. One read serves all of them.
Does the score just follow the weather?
No. EcoIntel weather-corrects the read, so a wet or dry year is not mistaken for good or bad management. On our Wilder Wood demonstration farm the driest year, 2020, shows as a dip in the record, and the small dip from 2024 to 2025 is read as weather-shaped rather than management-driven. The underlying trajectory since 2018 is up.