Concept · Glossary
EcoDynamics Engine
Also: EDE, eco-dynamic diagnostic framework
Definition
EcoIntel's proprietary analytical framework that translates satellite, terrain and climate data into process-based ecosystem diagnostics.
The EcoDynamics Engine is the analytical heart of the Land Health System. Its job is to read raw Earth-observation signals (multi-spectral satellite imagery, radar, terrain models, climate records) and translate them into something a human can act on: an ecologically-informed reading of how well a piece of land is actually working.
Most monitoring tools stop at single output metrics: soil carbon, species counts, NDVI greenness. The EcoDynamics Engine goes upstream of those outputs to the functional conditions that drive them. It models the four ecosystem processes and tracks the indicators that speak to each, weather-corrected and continuous.
It produces per-field scores for each process (EFI, WCI, MCI, CDI), the headline Land Health Score (1–9), confidence labels, limiting-indicator identification, and diagnostic narratives that explain why land is performing the way it is, not just that it is.
The Engine is ecoregion-aware: scores are calibrated against what is achievable in a given climate–landform–landcover combination, not against a one-size-fits-all baseline. A “7 Healthy” in a brittle Mediterranean landscape means a different absolute state to a “7 Healthy” in temperate Devon, but the diagnostic logic, how each process is performing relative to its ecoregional reference, is the same.
The name is a deliberate signal: the Engine is about the dynamics of how an ecosystem is functioning, not a snapshot of what it contains.
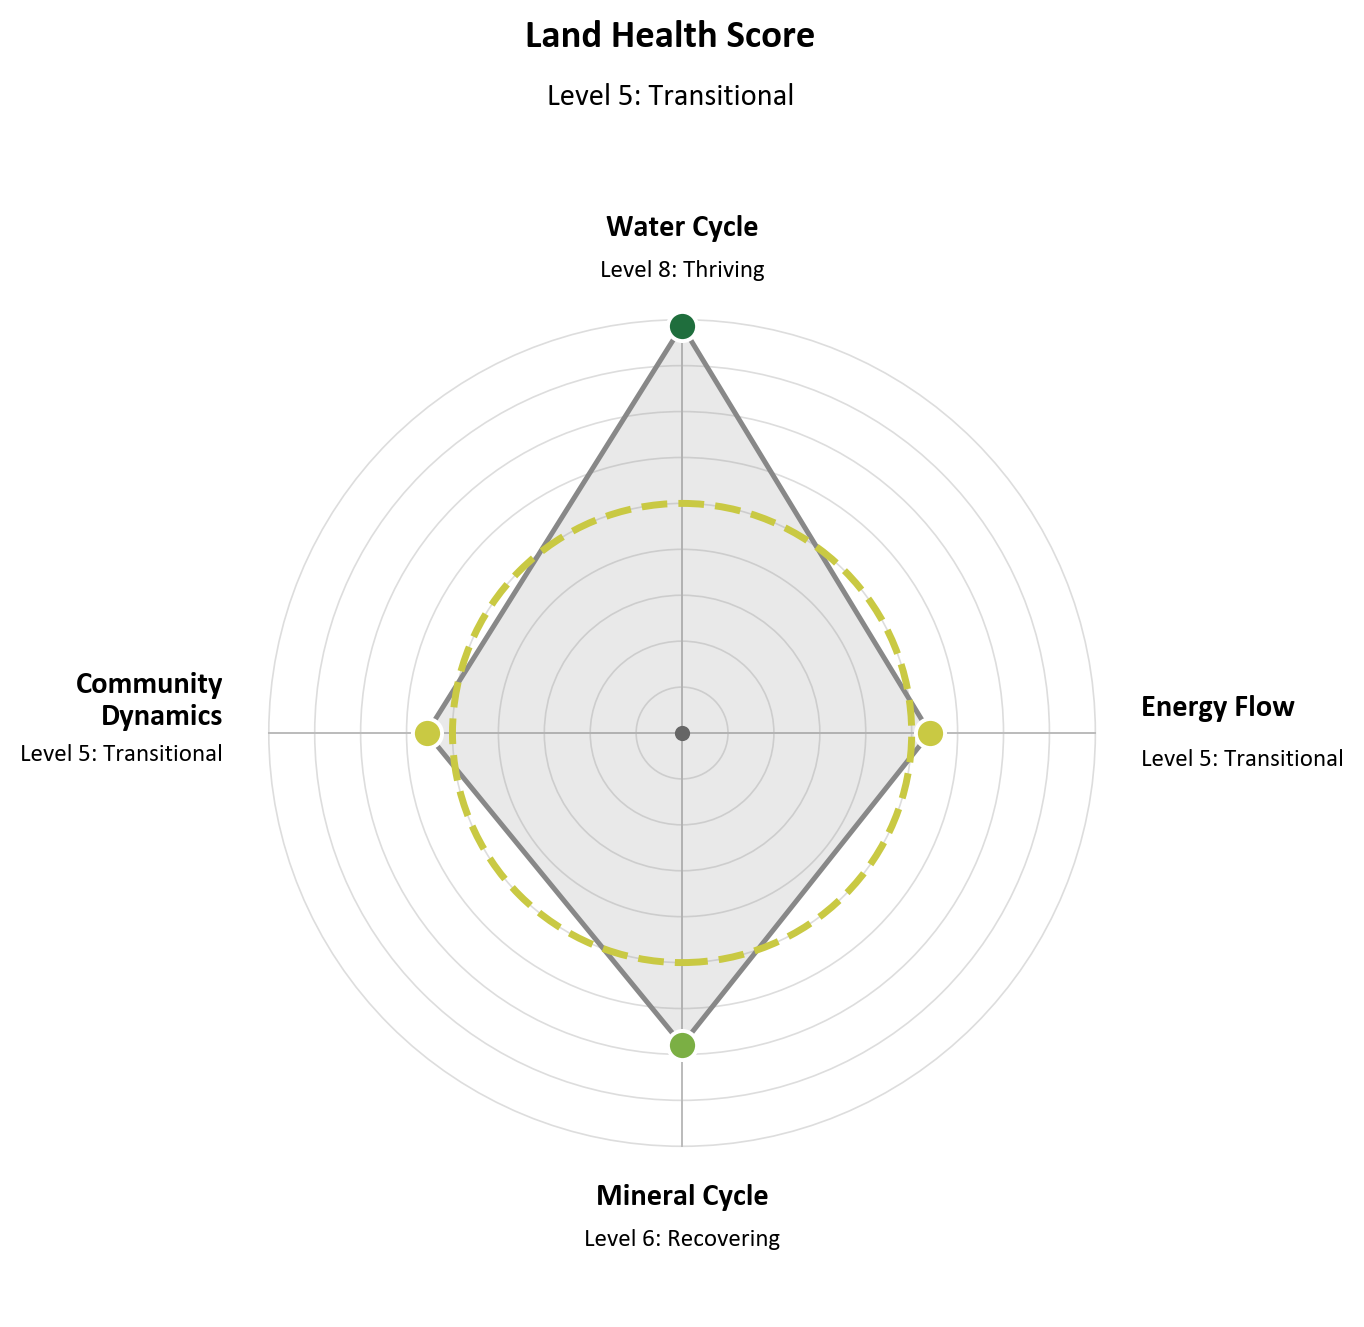
The Ecosystem Process Kite, Wilder Wood Farm, 2025. Each axis shows one process scored 1–9. The dashed circle is the composite Land Health Score. The diamond shape tells you immediately which process is the limiting one: here, Community Dynamics at Level 5 is the shortest axis, and Water Cycle at Level 8 is doing the heavy lifting.