About This Report
This report reads your land through continuous GIS data and satellite monitoring going back to 2018, currently. A large number of satellite sensor platforms (see methodology) feed through an ecoregion- and regime-aware scoring engine to produce what we call the Land Health Score.
The four ecosystem processes drive the verdict. The water cycle (how rain lands and stays); energy flow (how plants capture and store sunlight); the mineral cycle (how nutrients turn over); and community dynamics (how the plant assembly works as a functional system). Together they shape the property’s ability to absorb shocks, recover from disturbance, and build productive capital over time.
We score relative to a reference state that fits your land’s ecoregion, climate brittleness and management regime. A grassland in a non-brittle Atlantic climate is scored against grassland norms for that setting; a forest stand is scored against closed-canopy reference; agroforestry is scored against agroforestry references. The verdict you read is calibrated to your land.
The report leads with the Verdict and the Strategic Brief; read these first. Then drill into the chapters that matter to your question. Treat the numbers as indicative, not advisory: a strong direction-of-travel signal, suitable for planning, baseline-setting and disclosure, but not a substitute for ground inspection where a material decision rides on the answer.
Indicative Use Only
Thank you for being part of EcoIntel’s journey! We are building a platform to help everyone understand their land and build a healthier relationship with it. We couldn’t do it without you.
What you’re seeing is substantive and comprehensive, but it is not yet complete.
This report is indicative, not advisory. It cannot constitute formal ecological, agricultural, financial, or land management advice and should not be treated as such.
Section 1: Executive Summary
The Land Health Score for Wilder Wood Farm in 2025 is Level 5.6.
Over the past 8 years the trajectory has been steady.
Level 5 sits in the transitional zone between a degenerating ecosystem and a high-functioning one.
This report profiles each field's seasonal character, when it is at its strongest and weakest through the year, by combining aspect, slope, topographic wetness, phenology (start, peak, decline of growing season), radar-derived structural biomass, thermal signature, and quarterly process patterns. The goal is actionable field-level timing intelligence: when each field is ready to graze, when it needs to rest, when stress is building, and how its seasonal shape compares to its neighbours.
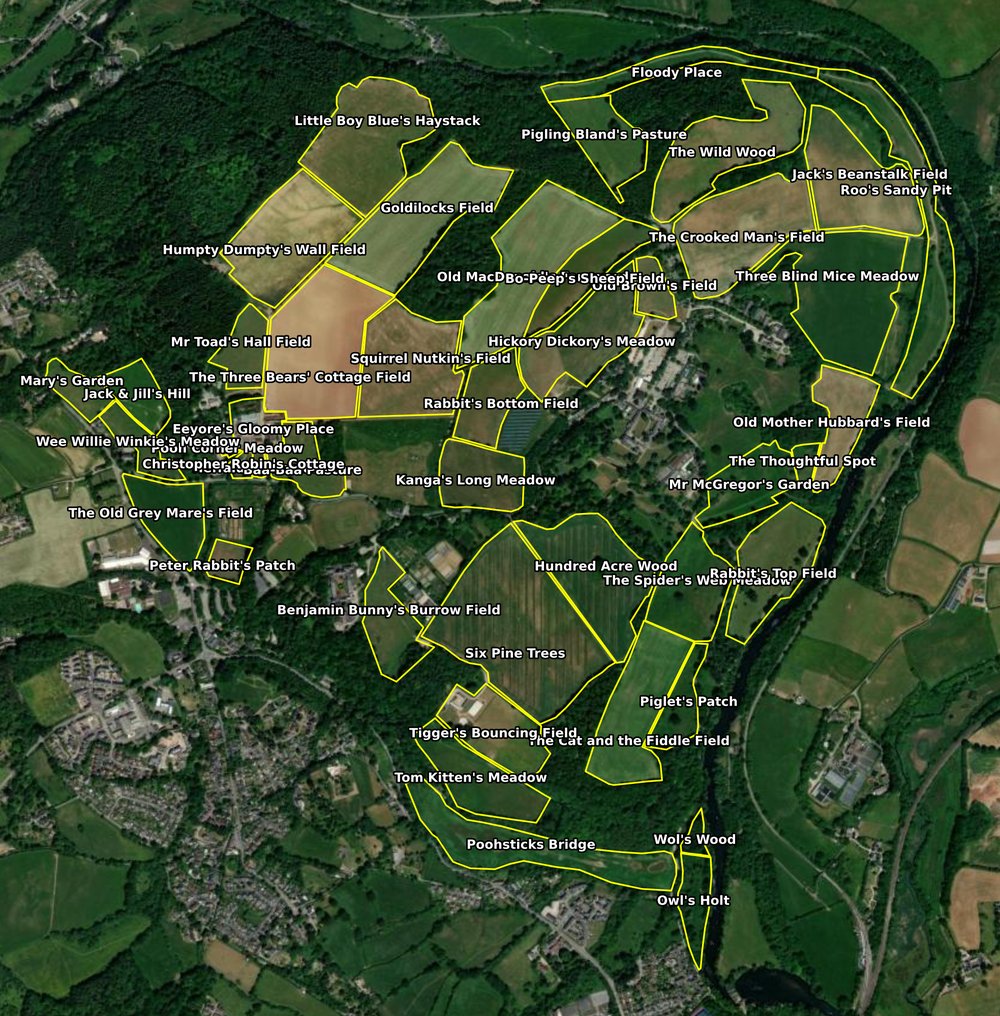
Across 175.2 hectares and 44 fields, individual parcels diverge from the site mean in patterns driven by physical structure rather than management, south-facing slopes peak earlier and run hotter, north-facing slopes peak later and hold into autumn, valley positions collect water and stay green longer, ridge positions dry first. These physical differences mean that "the right time" for a management decision is not a single date for the whole property; it is a staggered sequence reflecting each field's landscape position.
The site-wide limiting ecosystem process is Community Dynamics at 56%, and the four process scores site-wide read water cycle (WCI 83%), energy flow (EFI 63%), mineral cycle (MCI 66%), and community dynamics (CDI 54%). Brittleness 3.5/10 (Non-brittle) shapes the recovery window for any management event: brittle land needs longer rest periods and recovers more slowly, so the seasonal cards below report not just timing but also the implied rest and stocking guidance for each field individually.
Read the per-field topography blocks first to anchor each field's physical character; then the per-field seasonal profile cards for the phenology, structural biomass, quarterly strength, and management assessment specific to that field. Cross-reference the master Baseline Land Health Assessment Section 9 for the full seasonal-profile evidence and Section 2 for the integrated diagnosis behind any specific recommendation.
Section 2: Site Overview
Attribute | Value |
|---|---|
Property | Wilder Wood Farm |
Area | 175 ha across 44 fields |
Assessment period | 8 years (2018-2025) |
Ecosystem health | Land Health Score (EDX) of 5.6 (transitional condition) |
Trajectory | Steady (Mid) |
Limiting process | CDI6.0 Recovering (56%) (Community Dynamics) |
Carbon balance | Indicative of +6.1 tCO₂e/ha/yr (net sink) |
Brittleness | Non-brittle (3.5/10) |
Weather context | NORMAL |
This overview summarises the key characteristics of the site. For full diagnostic detail, methodology, and confidence assessment, see the Baseline Land Health Assessment.
Section 3: Field by field, Parcel by Parcel
Each field or parcel on the property has its own seasonal character, shaped by elevation, slope, aspect, water position, and management history. The cards below walk through every productive parcel in alphabetical order, with the Forest and Agroforestry parcels grouped first (they read against a forest reference rather than the grassland baseline) and the general fields after. Each card carries a hillshade image, a physical profile of the parcel, and a narrative reading of what the satellite record shows for the latest assessment year.
Forest and Agroforestry parcels
Hundred Acre Wood
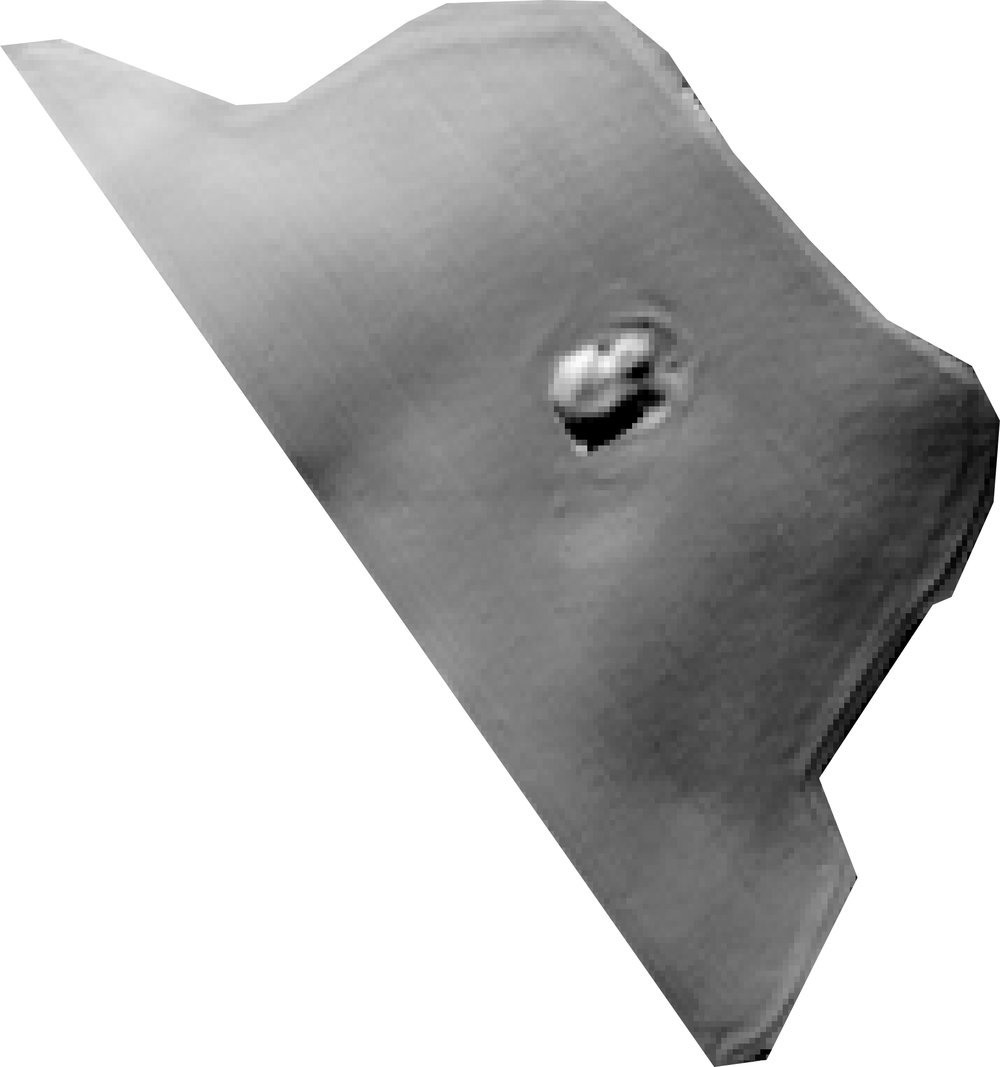 | Area: 6.5 ha Centroid: 50.4484° N, 3.6954° W Elevation (mean): 34 m Slope (mean): 1.6° Dominant aspect: S Topographic Wetness Index: 15.8 Landform: Flat 73% · Ridge 0% · Valley 27% Dominant Keyline Zone: 3 |
Flat 73% | Valley 27% |
Landform composition (proportion of parcel area)
The wood is functioning at the top of its reference band
Hundred Acre Wood is the standout forest parcel on this property. Reading the four ecosystem processes together, this alley-cropping stand is doing what a well-managed tree-and-alley system in this ecoregion should do: capturing rainfall, holding minerals in circulation, and carrying a diverse understory between the tree rows. The Land Health Score of 7 (high) places it near the top of the Healthy band on the forest reference scale, and the composite has held in the Healthy-to-Thriving range for every year of the eight-year record. That kind of stability, through a variable run of growing seasons, is a genuine achievement. The water cycle here is at the reference ceiling. A Water Cycle Index (WCI) of 100 percent means rainfall is arriving, infiltrating, and being retained about as well as this landscape can manage. The topography helps: the parcel sits at 34 metres with a gentle 1.6 percent slope, 73 percent of it classifies as flat ground, and it holds 27 percent valley position with a strong wetness signature (Topographic Wetness Index 15.8). Mineral cycling reads at 62 percent and community diversity at 69 percent, both comfortably inside the healthy range for an alley-cropping regime, indicating that litter is breaking down and the between-row plant community is doing real ecological work rather than sitting as a single-species cover.
Energy capture is the one process that could run higher
The limiting process is energy flow, sitting at 60 percent. In alley-cropping this reading almost always reflects the geometry of the system: tree rows capture light in a vertical layer, alleys capture it in a horizontal layer, and the composite reads lower than a closed-canopy forest would because sunlight is being partitioned across two strata rather than intercepted in one. The current canopy cover of 8.3 percent (up 1.2 percentage points on last year) confirms this is a light-canopy, wide-alley design working as intended, not a forest that has lost its trees. The radar signature (HV backscatter -20.3 dB) sits in the light-woody band consistent with young or widely-spaced tree rows.
The 2025 row-work event is visible and worth noting
The satellite record shows a partial-harvest signature dated late September 2025 (a VH step of -1.4 dB), consistent with alley-crop row work or tree-row management done at the end of the growing season. This is the kind of event you would expect to see when hedging, coppicing, or crop harvest happens on rotation, and it fits the pattern of similar entries in 2018, 2020, and 2022. Each of those was followed by a return to Healthy scoring in the following year, so the parcel has demonstrated it recovers from routine management interventions. The one thing to watch is that the 2025 Score has come off its 2023 peak of 9 down to 7. That is still Healthy, but the trajectory over the next two assessments will show whether the wood is stabilising at this level or continuing to soften.
What the seasonal pattern shows and what to watch next
The 2025 growing season delivered 348 mm of rainfall with 3 stressed weeks and 4 optimal weeks, a slightly drier and more variable year than 2024's near-ideal 486 mm and 9 optimal weeks. That climate shift explains part of the year-on-year softening in the Score without pointing to any management issue. Carbon exchange for the parcel sits at a positive 6.1 tonnes of carbon dioxide equivalent per hectare per year (gross primary production 1,200 against ecosystem respiration 896), meaning the wood is drawing carbon down and building productive capital in living biomass and soil. The management focus for the next cycle is straightforward: continue the alley rotation as planned, watch canopy cover trend upward as the tree rows mature, and expect energy flow to lift five to eight points as the woody layer thickens. No intervention is needed; this parcel is one of the strongest performers on the property.
Owl's Holt
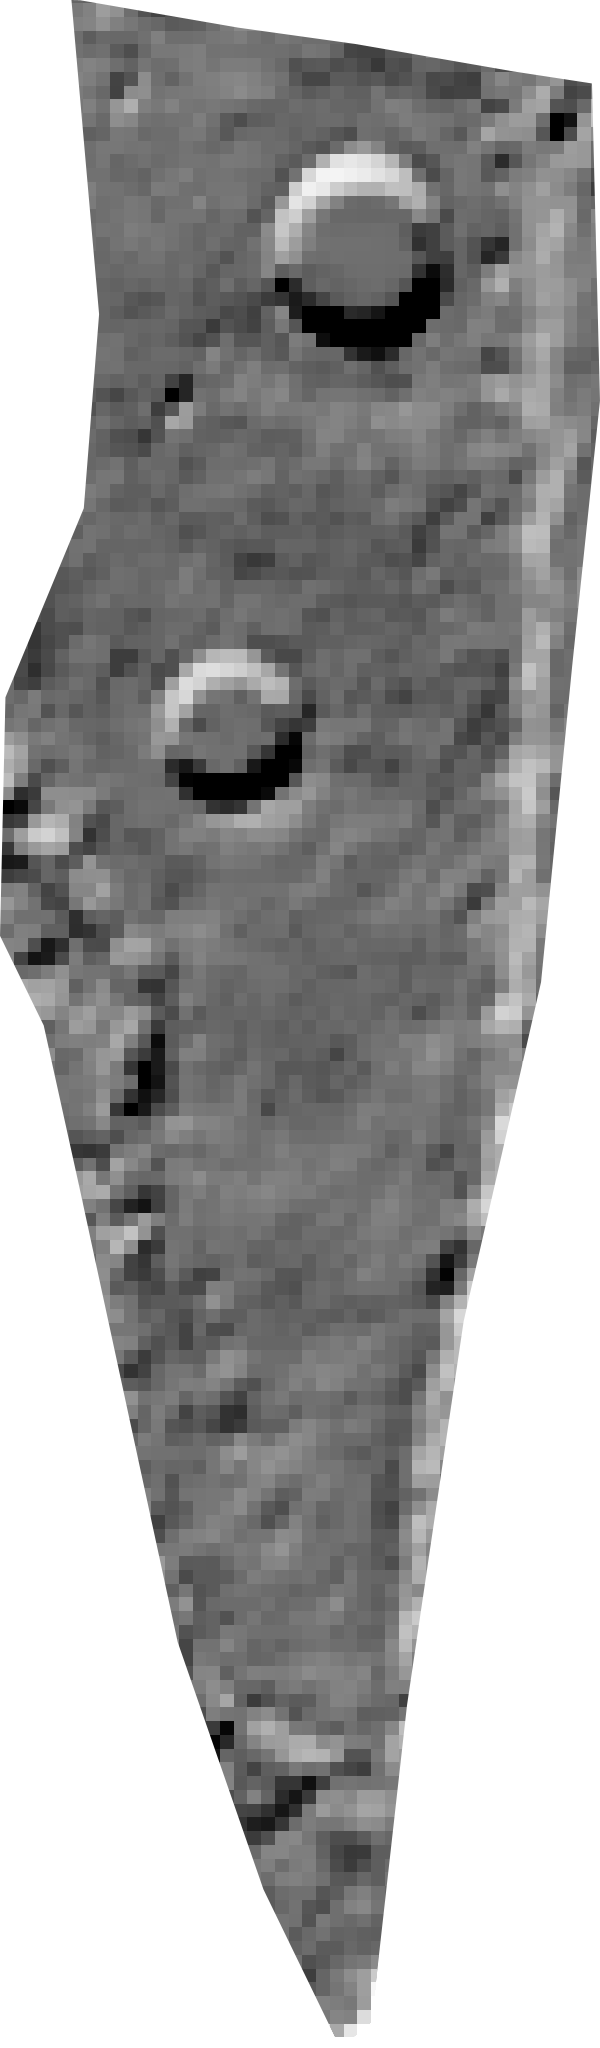 | Area: 1.7 ha Centroid: 50.4410° N, 3.6919° W Elevation (mean): 42 m Slope (mean): 5.9° Dominant aspect: E Topographic Wetness Index: 15.8 Landform: Flat 27% · Ridge 20% · Valley 52% Dominant Keyline Zone: 2 |
Flat 27% | Ridge 20% | Valley 52% |
Landform composition (proportion of parcel area)
The wooded pasture is in a genuine recovery phase
Owl's Holt is the parcel on this property that most rewards close attention this year. It is a wooded pasture sitting in a valley position on an east-facing aspect at 42 m elevation, with a moderate slope of about 6 percent and a Topographic Wetness Index (TWI) of 15.8 that puts it in the moist-but-well-drained band. Under the forest-track scoring that applies to this parcel, it currently reads Land Health Score 3 (mid) at 42.0 percent, which the reference-state comparison places in the Degraded band. The scoring track is authoritative for wooded parcels; the grassland ensemble is not appropriate here and has been left aside. That headline needs unpacking, because the underlying process signature tells a more nuanced story than the composite alone.
Water and mineral cycling are holding up well
The best news at Owl's Holt is that the two slower, harder-to-rebuild processes are still working. Water Cycle Index (WCI) reads 80 percent, which for a valley-bottom wooded pasture on this aspect is exactly what you would want: rainfall is infiltrating, the soil is holding moisture, and the drainage pattern is intact. Mineral cycling (MCI) also sits at 80 percent, meaning litter is breaking down, dung and leaf-fall are being incorporated, and the nutrient loop between canopy, understorey and soil is turning over at close to reference-state pace. These are the foundations of forest function, and they are not what is dragging the composite score down. On a wooded pasture that has been through several disturbance events, keeping water and minerals intact is the sign of a resilient underlying soil and hydrology.
Energy flow has collapsed and is doing the damage
The process pulling the parcel into the Degraded band is Energy Flow (EFI), reading 20 percent against a forest reference. That is a very low reading and it is the entire story of this year's score. What it says in plain terms: the canopy is capturing far less sunlight than a healthy wooded pasture at this location should be capturing, because there is materially less canopy above the pasture than there was a few years ago. The disturbance record confirms this directly. Owl's Holt shows a sequence of biomass losses stretching from 2018 through to a fresh event in September 2025: a canopy-density drop in 2018, a further biomass drop in 2020, a partial harvest signal in 2022, and most recently a moderate-severity spectral break in 2025 with a Normalised Burn Ratio change (dNBR) of +0.32. Canopy cover has stepped down 2.2 percentage points year-on-year and now reads 66.7 percent. Radar structure at HV backscatter of -13.3 dB is high for the site, consistent with a wooded pasture that still carries substantial standing biomass but with thinning gaps. The trajectory tells the same story: the parcel dropped from Land Health Score 5 in 2018 through Scores 4 and 2, and is now nudging back up to Score 3 in 2025. That upward tick, from 2 to 3, is the first sign that recovery has started. Community Dynamics (CDI) at 47 percent sits in the middle range and is the second constraint. This is what typically happens when canopy is opened: the shaded specialist understorey retreats and the recolonising community is thinner while it re-establishes. It is not a failure of the plant community, it is a signature of the disturbance still working through.
The recovery window is three to five years and management is the lever
The topography of Owl's Holt is favourable for recovery. Valley position, moist soils, an east-facing aspect that avoids the harshest afternoon heat, and only three percent of the parcel in the flat/drainage-corridor zone (Keyline Zone 4) mean the site has the water and shelter to rebuild canopy relatively quickly. Growing-season conditions in 2024 were generous (486 mm of rain, nine optimal weeks, zero stress weeks), and 2025 was closer to average but not punishing. Neither year should be blamed for the score; the disturbance record explains it. The 2025 spectral break is the event to watch. It is fresh enough that its full effect will register in the 2026 assessment rather than this one, so the score may dip once more before it climbs. The practical implication is straightforward: protect the recovering canopy and understorey from further pressure over the next three to five years. That means keeping any grazing on this parcel light and pulsed rather than continuous, giving natural regeneration a chance to close the gaps, and resisting any further thinning until Energy Flow has visibly climbed back toward the 50 to 60 percent range that the two healthier alley-cropping parcels on this site are already showing. Water and mineral cycling are already doing their job. Give the canopy time and the composite score will follow.
Six Pine Trees
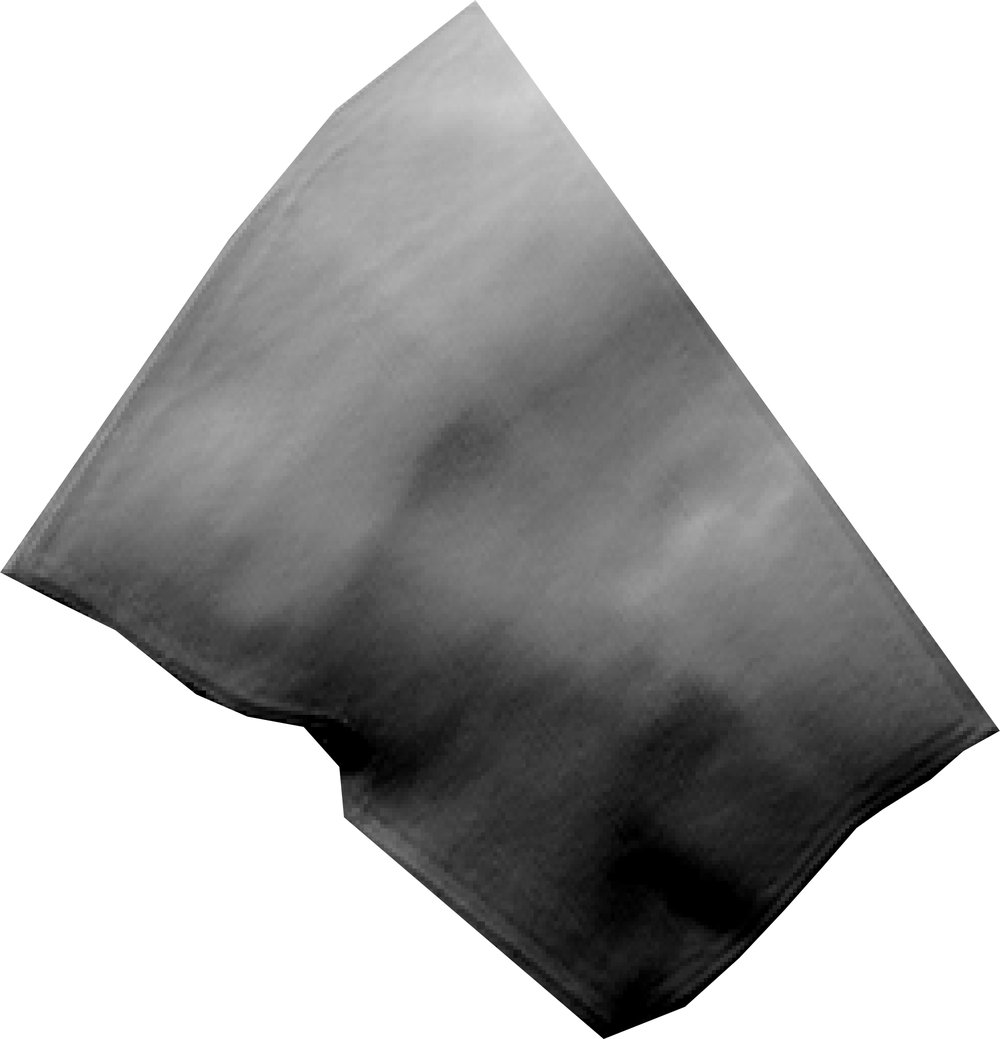 | Area: 12.5 ha Centroid: 50.4472° N, 3.6982° W Elevation (mean): 34 m Slope (mean): 3.0° Dominant aspect: W Topographic Wetness Index: 15.2 Landform: Flat 74% · Ridge 26% · Valley 0% Dominant Keyline Zone: 2 |
Flat 74% | Ridge 26% |
Landform composition (proportion of parcel area)
The land here is functioning as a healthy alley-cropping system
Six Pine Trees is one of the strongest-reading parcels on the property. The alley-cropping arrangement of tree rows interspersed with productive alleys is doing what it should: capturing water reliably, cycling minerals through the soil at a good rate, and holding a diverse plant community across the field. Land Health Score 7 (high) puts this parcel firmly in the healthy range against the reference expectation for alley-cropping systems in this ecoregion and moisture class. The four processes tell a coherent story. Water cycling is excellent, at 92 percent of reference, which is what you would expect from a mostly flat parcel (three percent slope, sitting almost entirely in Keyline Zone 2, the primary ridge shoulder). Mineral cycling and community diversity both sit at 67 and 69 percent respectively, comfortably inside the healthy band for this regime. The one constraint is energy capture at 67 percent, and that has a clear explanation covered below.
Energy capture is the limiting process, and the reason is management
Energy flow is the lowest of the four scores, and this is not a soil or a water problem. The satellite record shows a repeated pattern of alley disturbance on this parcel: tree-row biomass drops in 2020, alley tillage signatures in 2020 and 2022, and partial-harvest signatures on the tree rows in 2020, 2022, and again in the 2025 late season. In a working alley-cropping system this is entirely expected. Every time the alleys are worked or the tree rows are pruned or thinned, the total photosynthesising surface on the parcel drops for a period until regrowth catches up. The current canopy-cover reading of under one percent reflects that the tree component is young or has been recently worked back hard, so most of the energy capture on this parcel is currently coming from the alley crop rather than the tree rows. That is a legitimate design choice for an alley-cropping regime. It does mean the Energy Flow Index will read lower than a mature closed-canopy comparator, and this is a feature of the scoring approach for young or actively-managed agroforestry systems, not a signal that something is wrong.
The multi-year trajectory shows this is a well-managed parcel
Land Health Score on Six Pine Trees has held between Score 7 and Score 9 every year since 2018. The 2025 reading of Score 7 (high) is the lowest of the eight-year run, which coincides with the late-2025 partial-harvest event on the tree rows. Expect a modest recovery in the Energy Flow reading over the next two to three years as the worked rows rebuild biomass. The radar structural reading (HV backscatter of minus 21.2 decibels) confirms the tree-row biomass is currently low, which is consistent with the recent row work.
What to watch and what to do
The parcel is doing well and does not need intervention. Two things are worth tracking through the next assessment cycle. First, whether Energy Flow rebuilds toward 75 percent or above as the 2025 row work is followed by two full growing seasons of tree regrowth; if it does not, the tree rows may be being cut back faster than they can rebuild, which would eventually erode the alley-cropping benefit. Second, the alley tillage signatures in 2020 and 2022 are worth logging in your own farm records against what the crop rotation was doing in those years, so that the next assessment can distinguish planned rotation from unplanned soil disturbance. The 2025 growing season was warm and dry (the property saw three stressed weeks and only four optimal weeks, a step down from 2024's excellent nine optimal weeks), and Six Pine Trees held its readings through that test, which is a good indicator that the underlying water and mineral function of this parcel is robust.
Wol's Wood
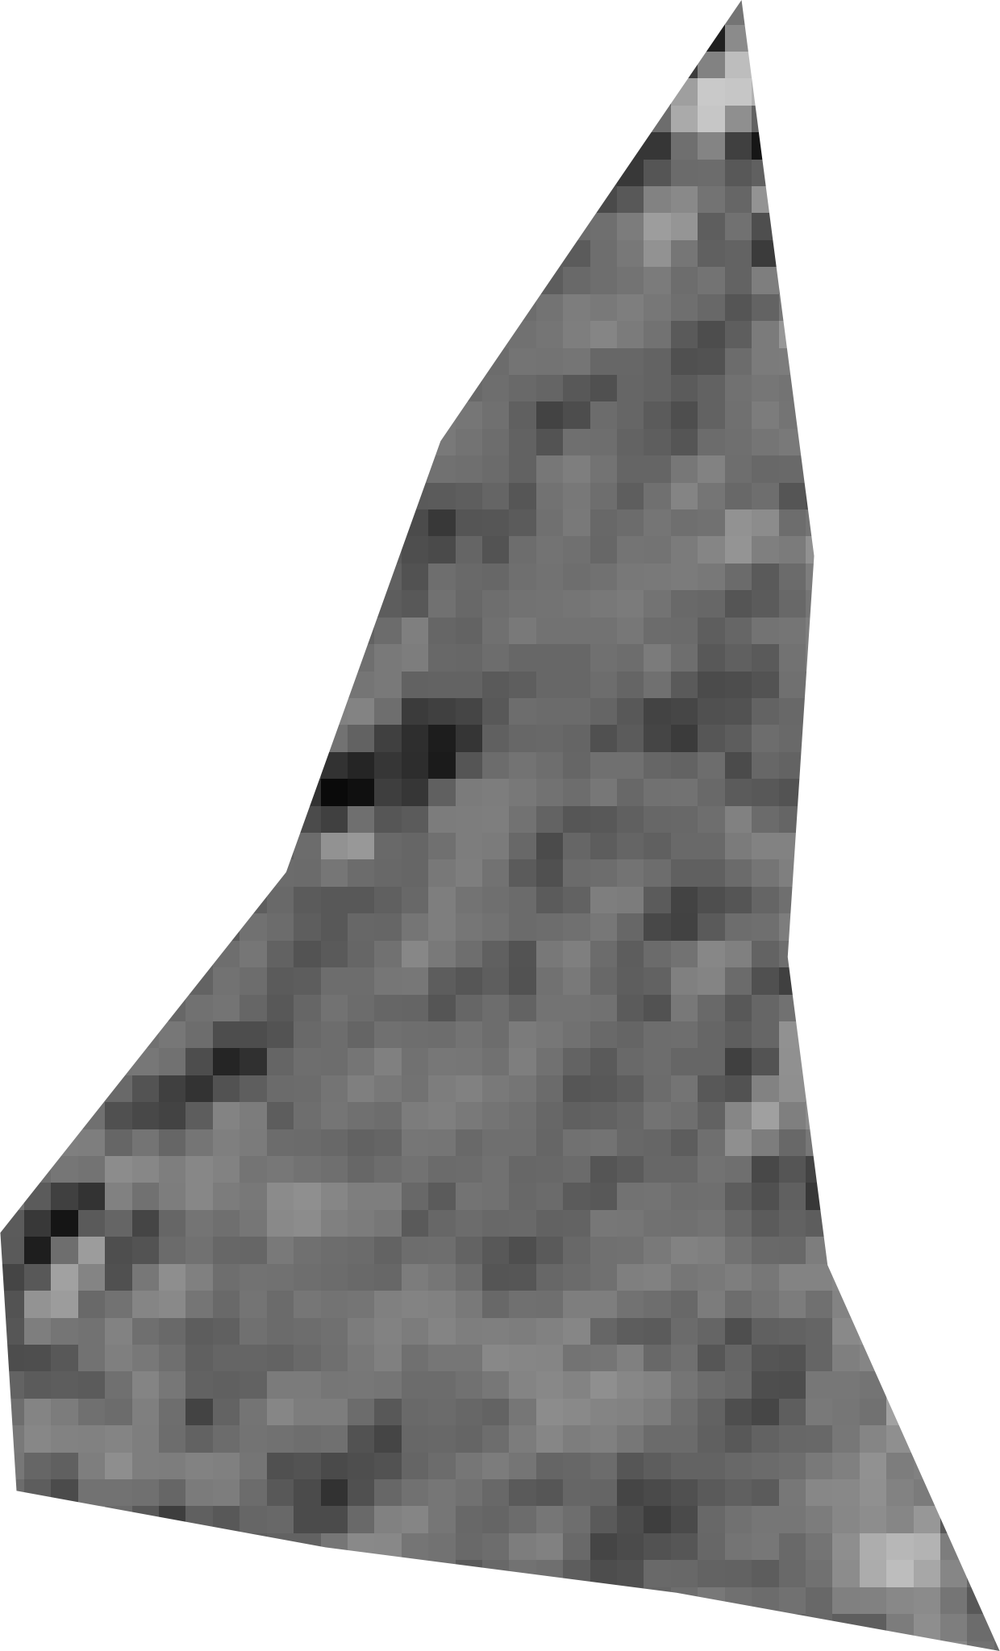 | Area: 0.4 ha Centroid: 50.4424° N, 3.6918° W Elevation (mean): 10 m Slope (mean): 3.4° Dominant aspect: W Topographic Wetness Index: 17.3 Landform: Flat 8% · Ridge 1% · Valley 91% Dominant Keyline Zone: 3 |
Valley 91% |
Landform composition (proportion of parcel area)
The wood has climbed back from a hard year
Wol's Wood has recovered strongly over the last twelve months. In 2024 the parcel dropped to Land Health Score 3 following a stretch of biomass loss detected in 2021 and 2022, and it has now returned to Land Health Score 6 (mid) at 60.6 percent against the wooded-pasture reference for this ecoregion. That is a meaningful bounce, and it tells a coherent story: the canopy took a knock, the standing structure has since rebuilt, and the water and mineral processes that underpin the site never really left. What remains weak is the diversity of what lives under and within that canopy.
Water and minerals are doing the heavy lifting
Water cycling and mineral cycling are the two strongest processes here, and both are behaving as you would want a mature wooded pasture to behave. The Water Cycle Index reads 77 percent, comfortably in the functional range for a valley-bottom wooded parcel, and the Mineral Cycle Index sits at 80 percent, meaning litter is decomposing and nutrients are moving back into the soil at close to the reference rate. This is consistent with the topography: the parcel sits low in the landscape at just 10 metres elevation, is 91 percent valley position, and carries a Topographic Wetness Index of 17.3, which is genuinely wet ground. Water arrives here, sits long enough to do its work, and leaves through biology rather than runoff. The radar reading of minus 11.6 dB HV backscatter is the highest structural biomass signature on the whole property, confirming that the standing wood carries real physical mass.
Energy capture is rebuilding, diversity is the constraint
The Energy Flow Index reads 63 percent, which for a wooded pasture in active recovery is a fair result and consistent with the recent canopy history. Current canopy cover sits at 84.6 percent, down 4.7 percentage points year on year, so the crowns are still filling back in after the 2021 to 2022 biomass drops. That gap will close on its own timescale over the next two to three growing seasons provided nothing further disturbs the stand. The genuine limitation is community diversity, which reads 42 percent and is the lowest of the four processes by a clear margin. In plain terms, the wood is functioning as habitat and hydrology, but the range of species using it (in the understorey, in the ground flora, in the deadwood-associated invertebrates and fungi) has not kept pace with the structural recovery.
What to do about the diversity gap
The first move on community diversity is patience combined with protection. Rest is the highest-leverage action available here: keep browsing pressure light or deferred through at least one full growing season so that the understorey species already present in the seedbank can express, flower and set seed. Wol's Wood is a wet valley-bottom wood on west-facing ground, which means it holds moisture late into summer and can support a rich ground flora if given the chance. If after two seasons of rest the ground layer remains sparse, the next step is on-farm transfer of hay or brash cut from the more diverse woodland edges on the property (Owl's Holt and the wooded edges of Hundred Acre Wood carry more community structure and would be reasonable donor sites). Purchased seed should not be needed and would not be the right first tool for a semi-natural woodland community.
The trajectory to watch
Over the next assessment cycle the pattern to look for is Energy Flow drifting up toward 70 percent as canopy closes, Community Diversity climbing off its current 42 percent floor, and the water and mineral processes holding where they are. If diversity has not moved after a full season of rest, that points to browse pressure or deer impact as the underlying cause and would justify a closer look at exclosures or targeted deer management. The year was a fair test climatically (486 mm of growing-season rainfall in 2024 and 348 mm in 2025, no severe stress weeks in either year), so the scores you are seeing reflect the site's actual condition rather than weather-driven noise.
General fields
Having reviewed all the forestry fields/parcels we now look at the general fields in the same format with a hillshade image, a physical profile of the parcel, and a narrative reading of what the satellite record shows for the latest assessment year.
Baa-Baa Pasture
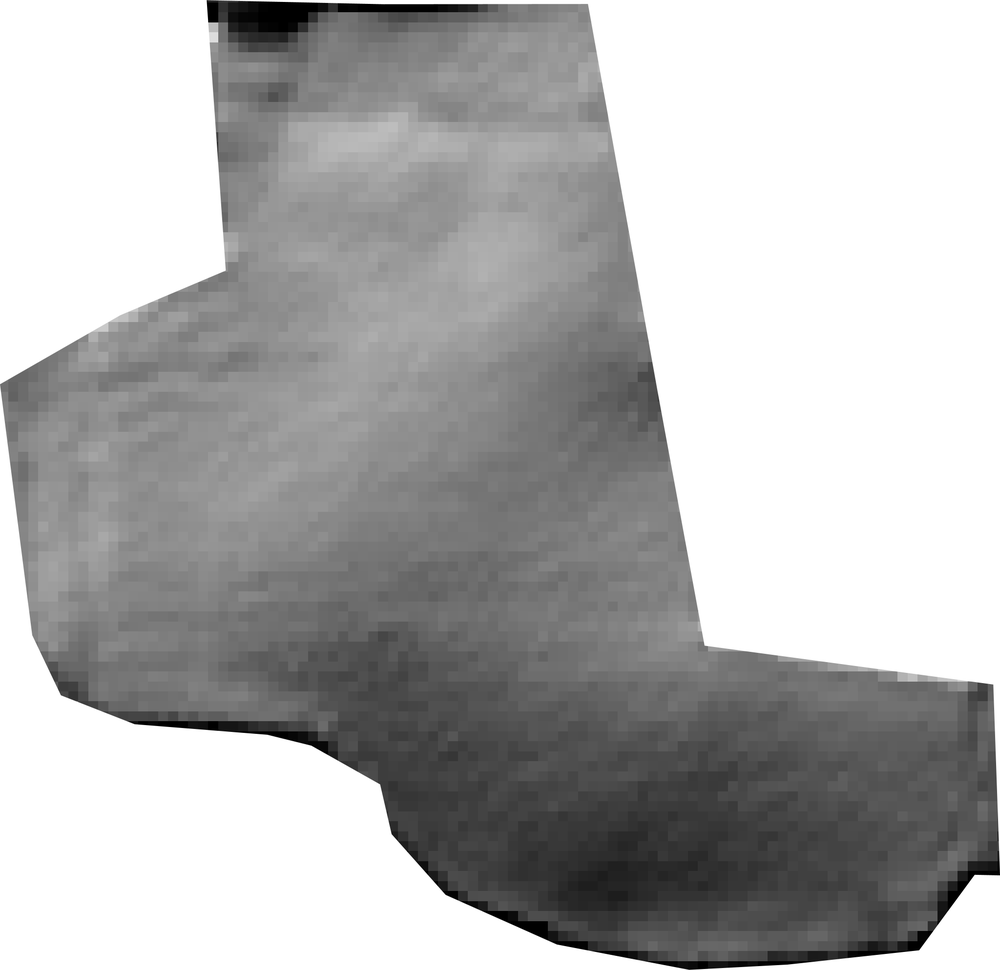 | Area: 2.2 ha Centroid: 50.4510° N, 3.7059° W Elevation (mean): 68 m Slope (mean): 7.1° Dominant aspect: W Topographic Wetness Index: 14.4 Landform: Flat 31% · Ridge 64% · Valley 5% Dominant Keyline Zone: 2 |
Flat 31% | Ridge 64% |
Landform composition (proportion of parcel area)
Land Health Score sits mid-band with diversity as the constraint
Baa-Baa Pasture is functioning solidly as a working pasture, with Land Health Score 5 (mid) placing it just inside the Transitional band and within reach of the Recovering threshold above. The headline reading is that water cycling and mineral cycling are doing their jobs, energy capture is reasonable for a grazed sward, and species diversity is the process holding the whole back. Looking across the property, this field sits in the middle of the pack: stronger than the lower-scoring corners around The Old Grey Mare's Field and Mr Toad's Hall, but with clear ground to make up against neighbours like Heffalump Pasture and Peter Rabbit's Patch. The four ecosystem processes tell a coherent story. Water Cycle (WCI) at 85 percent means rainfall is infiltrating and being held, which fits the non-brittle Devon climate and the field's position. Mineral Cycle (MCI) at 71 percent indicates litter and dung are turning over to a reasonable degree, helped by the six grazing passes recorded through the season. Energy Flow (EFI) at 69 percent reflects respectable canopy productivity through the year. The constraint is the Community Dynamics Index (CDI) at 56 percent, the lowest of the four by a clear margin and the lever where the next step up in Land Health Score lives.
The ridge-top position shapes everything else
This is one of the more strongly ridge-defined fields on the property, with around 64 percent of the parcel sitting on ridge ground and only 5 percent in valley. It faces broadly west at moderate slope, with about a quarter of the area falling into Keyline Zone 1 (the catchment headwaters above any conservation channel) and the majority in Zone 2 (the upper grazing slopes). That topographic position explains the slightly modest Topographic Wetness Index of 14.4: this field sheds water more than it receives it. It also explains why WCI at 85 percent is genuinely a good reading here, the land is holding more of its rainfall than the topology alone would predict, which suggests ground cover and soil structure are doing real work. The structural biomass signature from radar (HV around -19.7 dB) sits in the normal range for grazed permanent pasture, with no sign of either overgrazing scalp or accumulated thatch. That fits the six grazing events: the field is being worked, biomass is being removed and regrown, and the structural pattern looks healthy. Carbon flux of around 6.1 tonnes of CO2 equivalent per hectare per year of net uptake is consistent with most of the grassland parcels, building productive capital rather than losing it.
Diversity is the lever, and rest is the first move
The 56 percent Community Dynamics reading is the one number to take seriously. In a non-brittle climate (brittleness 3.4) with six grazing passes through the year, the most likely cause of suppressed diversity is that the more sensitive grasses, broadleaves and legumes are not being given long enough between defoliations to flower, set seed, and recruit. The species are there in the seedbank and on the field margins; they are being grazed off before they can express. The fact that water and mineral cycling are both functioning well tells you the underlying conditions for a more diverse sward already exist. The bottleneck is recovery time, not seed availability. The first move is therefore to extend rest periods, not to buy seed. Pulling Baa-Baa Pasture out of one summer rotation, ideally during the late June to August flowering window, would let the existing diversity express and self-seed. A second option, given the ridge-top exposure and west aspect, is to defer this field specifically in years when the south-facing fields green up earlier; let the warmer aspects carry early-season grazing and give this field its full window. A third complementary move, once flowering has occurred for a season or two, is on-farm seed transfer: cutting hay with ripe seed heads from your more diverse paddocks (Peter Rabbit's Patch and Poohsticks Bridge are scoring highest on community dynamics and would be the donor candidates) and spreading it here with stock to trample seed in.
What to watch in next year's assessment
If rest and on-farm seed transfer are applied, the signal to watch is CDI climbing into the low 60s while WCI and MCI hold their current levels. That would lift the Score firmly into the Recovering band. The harder thing to watch for is the opposite pattern: CDI flat or weakening while EFI rises, which would indicate the sward is becoming more productive but less diverse, the trajectory that mid-brittleness pastures drift into when grazing is regular but rest windows are uniform. The ridge-top position and the west aspect mean this field will always sit slightly drier than its valley-bottom neighbours; that is a feature, not a flaw, and the diversity it can carry under good management is the species mix that thrives on free-draining upper slopes.
Benjamin Bunny's Burrow Field
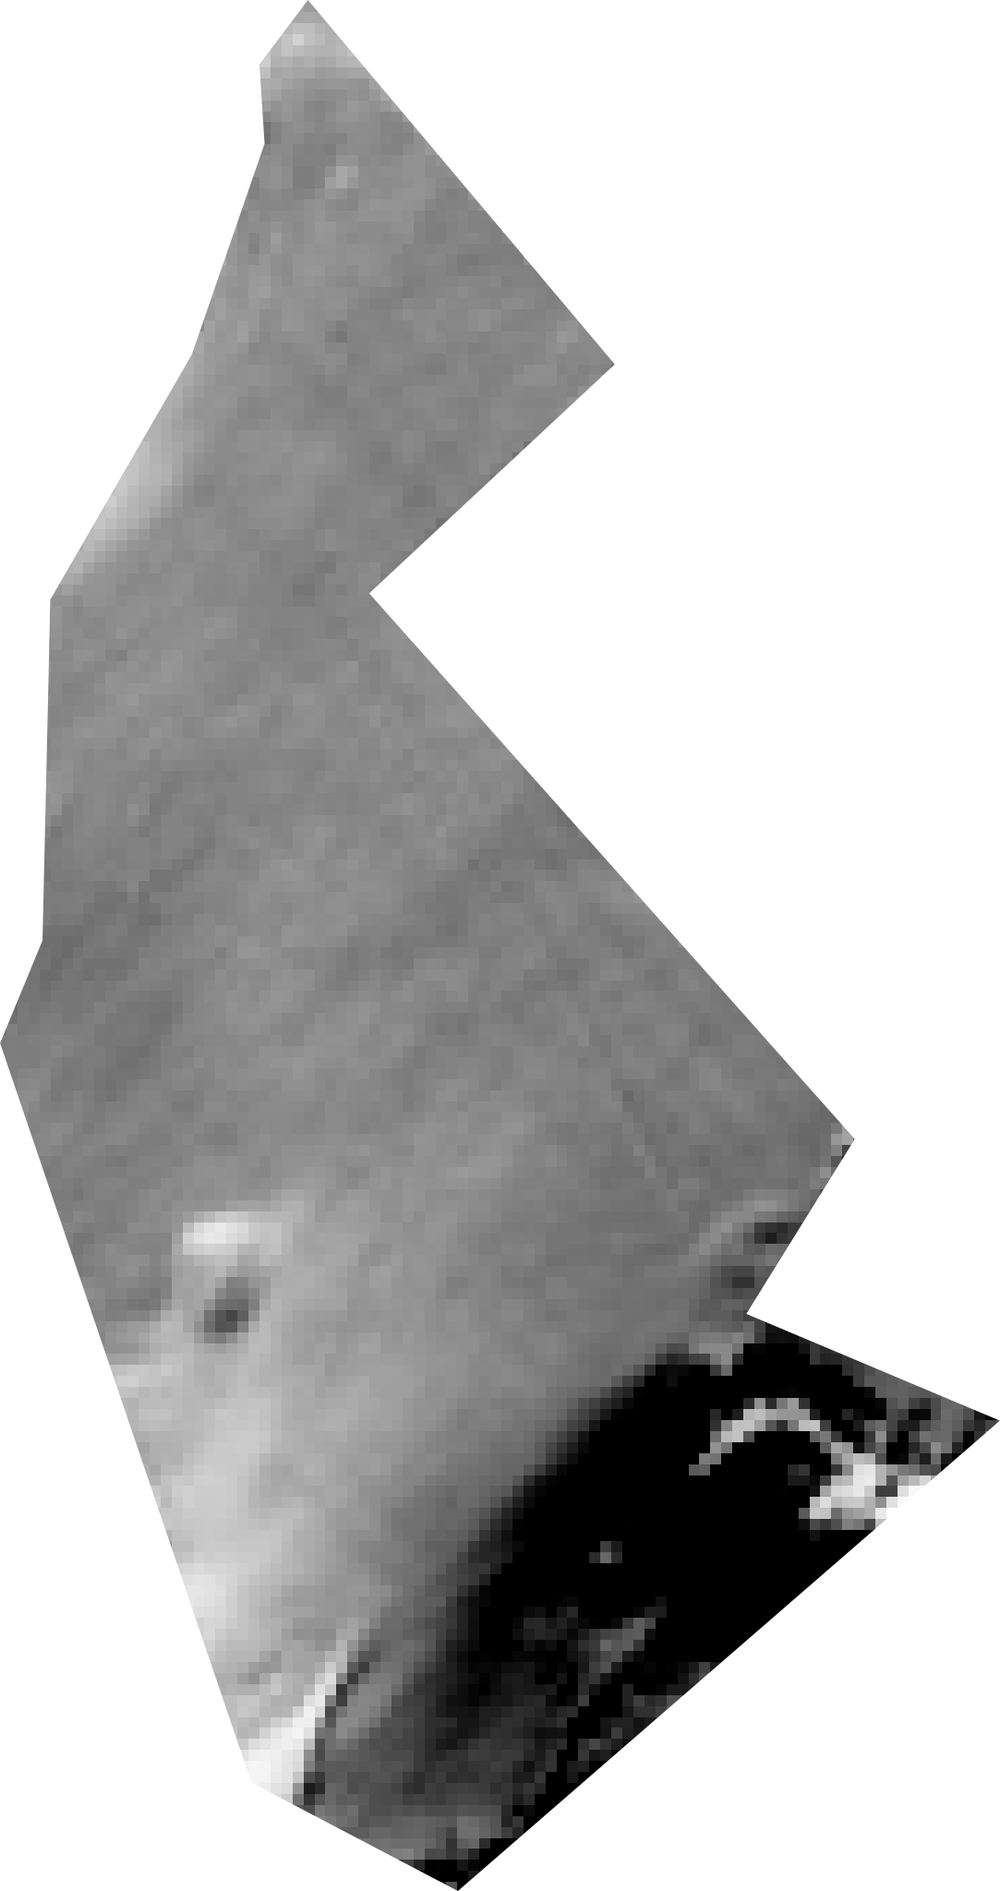 | Area: 3.0 ha Centroid: 50.4473° N, 3.7028° W Elevation (mean): 49 m Slope (mean): 4.9° Dominant aspect: W Topographic Wetness Index: 15.5 Landform: Flat 28% · Ridge 6% · Valley 66% Dominant Keyline Zone: 2 |
Flat 28% | Valley 66% |
Landform composition (proportion of parcel area)
Benjamin Bunny's Burrow Field returns a Land Health Score of 5 (mid) this year, placing it just below the property's grassland median and clearly in the working middle of the range. Water cycling is the strong suit and species diversity is the soft spot, which is the pattern you would expect on a valley-leaning west-facing parcel that gets reliable moisture but has not yet been pushed hard on sward composition. The headline reading is a parcel that is functioning, holding its own through a moderately stressed growing season, and carrying clear headroom on two of the four ecosystem processes. Looking at the four processes individually, water cycle sits at 87 percent, mineral cycle at 73 percent, energy flow at 69 percent, and community dynamics at 58 percent. The spread between best and weakest is 29 points, which is wider than the property average and tells you the parcel is unbalanced rather than uniformly mid-range. Water is doing its job. The other three are following at varying distances.
Water cycling is the parcel's structural strength
The 87 percent Water Cycle Index reading is genuinely good for a working pasture and reflects the landscape position well. Sixty-six percent of the parcel sits in valley terrain, the Topographic Wetness Index of 15.5 indicates moisture accumulates rather than sheds, and the Keyline Zone breakdown puts 71 percent of the parcel in the valley-floor zone (KZ2) where infiltration and retention naturally concentrate. The west aspect means afternoon sun and some evaporative demand in summer, but the underlying hydrology is doing the heavy lifting. This matters because water function is the foundation that everything else builds on. With infiltration and retention in good shape, the constraints on this parcel are downstream of water rather than upstream of it. That is the easier diagnostic position to work from.
Species diversity is the limiting process
Community dynamics at 58 percent is the weakest of the four readings and the one most worth working on. In plain terms, the sward is functional but narrow, the diversity of plants, insects, and soil organisms that buffer the parcel against stress and surprise has room to grow. Mineral cycle at 73 percent and energy flow at 69 percent are consistent with this picture: the grasses present are productive enough, but the parcel is not yet expressing the species richness that would push all three of these processes upward together. The radar structural reading (HV at -18.7 dB) sits in the dense-pasture range, confirming that the standing biomass is healthy. The constraint is composition, the mix of what is growing, more than the quantity of what is growing.
Recovery before reseeding is the right sequence
The first move on community dynamics is always rest and grazing management before any consideration of seed. Extended recovery between grazing events lets existing species in the seed bank express, flower, and self-seed. Mob grazing at higher density with shorter exposure trumples seed into the surface and drives nutrient distribution. Deferring the parcel from one rotation cycle to allow full seed set on what is already present typically opens up two or three additional species over a single season at no input cost. Only after two or three years of these levers, if the species pool genuinely proves depleted, does on-farm seed transfer (cutting hay with ripe seed heads from your most diverse pasture and spreading it here) become the next step. Purchased seed is the last resort, not the first.
What to watch over the next assessment cycle
The trajectory worth tracking is whether community dynamics moves above 65 percent over the next two years while water cycle holds above 85 percent. If both rise together, the parcel is genuinely building. If water weakens while community improves, it is likely a management-pressure signal worth investigating, particularly in dry summers when the west aspect will show stress first. Energy flow at 69 percent should also start rising as sward diversity builds; the two processes tend to track each other once a sward starts gaining species richness.
Bo-Peep's Sheep Field
 | Area: 3.2 ha Centroid: 50.4554° N, 3.6957° W Elevation (mean): 29 m Slope (mean): 5.8° Dominant aspect: E Topographic Wetness Index: 17.6 Landform: Flat 26% · Ridge 19% · Valley 55% Dominant Keyline Zone: 2 |
Flat 26% | Ridge 19% | Valley 55% |
Landform composition (proportion of parcel area)
Water cycle is holding while diversity sets the ceiling
Bo-Peep's Sheep Field is a solid mid-tier paddock with the kind of profile a farm would be pleased to see across most of its acreage. The land sits in a Recovering condition with a Land Health Score 6 (low), the four ecosystem processes working in reasonable balance and no single function in crisis. Water Cycle Index of 83 percent, Energy Flow Index of 70 percent, Mineral Cycle Index of 72 percent, and Community Dynamics Index of 60 percent describe a paddock that captures rainfall well, photosynthesises competently, recycles litter and dung at a fair rate, and carries enough species diversity to function. The headline is that nothing here is broken. What the numbers tell you, once you read them together, is where the ceiling sits. Community diversity is the lowest of the four processes and the one holding the overall Score back from the EDX7 tier that Peter Rabbit's Patch and Poohsticks Bridge have reached. The water cycle is doing slightly less work here than on the strongest paddocks (the top fields run 90 to 92 percent), and that small gap is worth understanding rather than ignoring.
The valley floor and ridge top behave as two different paddocks
The topology of this field is the most interesting thing about it and probably the least visible from ground level. Just over half the paddock sits in valley position (55 percent), with a meaningful ridge component (19 percent) and a flat shoulder in between (26 percent). Within the Keyline framework, 43 percent of the field falls in the upper ridge-and-shoulder zone (KZ2) and 33 percent sits in the lower valley-collection zone (KZ3), with a small high-catchment fragment (6 percent in KZ1). In practical terms this paddock is two paddocks stitched together by a fence line, one ridge-shoulder unit drying and warming faster in spring, and one valley unit holding moisture later into summer. That split explains the slightly softer water cycle reading. The Topographic Wetness Index of 17.6 confirms the valley portion is genuinely wet ground, which is good news for summer resilience but means the ridge portion is doing the heavy lifting in early spring while the valley is still cold and slow. The east-facing aspect helps the ridge dry its dew early (which suppresses fungal pressure) but it also means the field never gets the full afternoon solar load that the south-facing paddocks like Mr Toad's Hall and Old Brown's Field get. A small steep fraction (4 percent) is not management-limiting but worth noting for any winter poaching risk on the valley shoulders.
Structural biomass reads thin for a productive sheep paddock
The radar signature is the one channel that gives a slightly cooler reading than the optical scores suggest. HV backscatter of -20.1 dB and HH of -13.0 dB place this paddock in the thinner structural range for the grassland parcels on the property, lighter than Tom Kitten's Meadow at -17.3 dB HV or Jack and Jill's Hill at -16.9 dB HV, both of which carry similar greenness scores. Read alongside an Energy Flow Index of 70 percent, the most likely explanation is a sward that is green and photosynthesising but physically shorter and less dense than it could be, consistent with regular sheep grazing pressure that keeps the canopy cropped close. This is not a problem. It is a description of how the field is being used. The implication for the next cycle is that if you wanted to lift the Land Health Score into the EDX7 band, the leverage point is building physical biomass and species mix together. Both respond to the same intervention: a longer recovery period in the spring rotation, taking this paddock out of the May to June sequence in one year and letting it run through to a full flower-and-seed-set on the resident species before mob-grazing it down in July. Trampling the standing seed back into the surface is the on-farm seed-transfer mechanism the diversity floor needs.
A fair year and a productive paddock
The 2025 growing season has been a fair test for this paddock rather than a generous one, with 348 mm of growing-season rainfall, three weeks of stress and four optimal weeks, against a multi-year average that includes much wetter years like 2021 and 2024. The fact that Bo-Peep's Sheep Field holds its Land Health Score 6 (low) through this kind of year, with water cycling at 83 percent and the carbon balance positive at 6.1 tonnes of carbon dioxide equivalent per hectare per year, says the underlying functions are robust to a normal-range dry summer. The thing to watch in the next assessment is whether species diversity moves off the 60 percent floor when rest is extended, that is the single observation that would confirm the management lever is the right one.
Floody Place
 | Area: 2.7 ha Centroid: 50.4600° N, 3.6929° W Elevation (mean): 66 m Slope (mean): 13.1° Dominant aspect: N Topographic Wetness Index: 13.7 Landform: Flat 17% · Ridge 41% · Valley 41% Dominant Keyline Zone: 1 |
Flat 17% | Ridge 41% | Valley 41% |
Landform composition (proportion of parcel area)
Land Health Score 6 sits in the middle of the property's grassland range
Floody Place is holding steady in the middle of the grassland cohort. The water cycle is the strongest of the four ecosystem processes here, mineral cycling is close behind, and the limiting factor is species diversity rather than anything to do with water or productivity. For a parcel with this name, sitting where it sits in the landscape, that is the right pattern to see. Land Health Score 6, with Water Cycle Index of 91 percent, Mineral Cycle of 79 percent, Energy Flow of 74 percent, and Community Dynamics at 63 percent. Diversity is the lever to work next.
The name fits the landscape
The topography explains a great deal about how this parcel behaves. Floody Place sits at 66 metres with an average slope of 13 percent and the steepest profile on the property: nearly a third of the parcel is genuinely steep ground (31 percent classified steep). It is split almost evenly between ridge and valley positions (41 percent ridge, 41 percent valley) with a north-facing aspect, and 42 percent of the parcel falls in Keyline Zone 1, the catchment zone above the highest conservation channel. This is high ground that sheds and collects water in equal measure, and the field's name suggests the valley sections have form for holding it. The Topographic Wetness Index (TWI) of 13.7 is the lowest on the entire property, which at first reading seems to contradict the name. The explanation is that average wetness across the parcel is pulled down by the ridge component, while the valley sections concentrate flow into a smaller footprint. That is the classic pattern of a parcel that floods locally without being uniformly wet. North aspect compounds the effect by reducing evaporative demand on the wet portions, so when water arrives it sits.
Water cycle is doing the heavy lifting
Despite the steep ground and the catchment position, water cycling on Floody Place is excellent. Water Cycle Index of 91 percent says infiltration and retention are working well across the parcel, which on a slope this steep is genuinely impressive. The radar structure backs this up: HV backscatter of -13.9 dB is among the highest readings on the property and sits well above the open-pasture range, indicating dense, structurally complex sward with good standing biomass. That kind of structure is what slows water on a 13 percent slope and lets it soak in rather than run off. Mineral cycling at 79 percent and energy flow at 74 percent are both in the healthy range for a Devon pasture and consistent with the growing-season conditions of 2025 (348 mm of rain, three stress weeks, four optimal weeks, a fair but not generous season). The carbon picture shows the parcel pulling roughly 6.1 tonnes of CO2-equivalent per hectare into the system this year, which is the site-wide grassland baseline. Nothing in the productivity or hydrology data flags a concern.
Species diversity is the constraint and the opportunity
Community Dynamics at 63 percent is the lowest of the four processes and the clearest place to put management attention. On a parcel that holds water this well, has good structural biomass, and sits across both ridge and valley positions, the conditions for a more diverse sward are already present. The catchment-zone fraction and the wet valley sections in particular are the kinds of microsites where wet-meadow species can establish if given the chance. Following the standard remediation order, the first move is rest and timing rather than seed. Extending the recovery period after grazing, particularly through late spring and early summer, lets existing species flower and set seed. Deferring the parcel for a full season once every three or four years would let the wet-valley flora express itself, and that seed bank is then walked into the soil by the next grazing pass. If diversity has not lifted measurably after two or three years of that approach, on-farm seed transfer from a more diverse parcel (cutting hay with ripe heads from a species-rich field and spreading it here) is the next step before any purchased mix is considered.
What to watch next year
The trajectory to monitor is whether Community Dynamics moves up while the other three processes hold their ground. Given the strength of the water cycle and the structural biomass already present, modest changes in grazing timing should produce visible movement in the diversity score within two to three assessment cycles. The steep north-facing sections are the slowest-responding ground on the parcel and should be given longer recovery windows than the flatter areas; treating the parcel as a single management unit will likely under-rest the steep portion.
Goldilocks Field
 | Area: 7.5 ha Centroid: 50.4566° N, 3.7018° W Elevation (mean): 37 m Slope (mean): 2.2° Dominant aspect: S Topographic Wetness Index: 15.8 Landform: Flat 66% · Ridge 16% · Valley 18% Dominant Keyline Zone: 2 |
Flat 66% | Ridge 16% | Valley 18% |
Landform composition (proportion of parcel area)
Goldilocks Field is the second-weakest grassland parcel on the holding, and the data tells a coherent story about why. Land Health Score 3 (high) places it firmly in the degraded band, and all four ecosystem processes are weakening together rather than one carrying the others. Water Cycle Index of 64 percent, Energy Flow Index of 40 percent, Mineral Cycle Index of 39 percent, and Community Dynamics Index of 33 percent describe a field where rainfall is reaching the soil reasonably well but very little is being done with it once it arrives. This is the uniform-low pattern from the diagnostic framework, the signature of a parcel needing whole-system attention rather than a single targeted lever. The terrain explains some of the difficulty and removes others from the table. The field sits at 37 metres on a gentle 2.2 percent slope, predominantly flat (66 percent) with a south-facing aspect and 81 percent of its area in the lower-slope keyline zone. None of this should be limiting. South-facing flat ground in Devon at low elevation is, on paper, some of the most productive land you could ask for. The Topographic Wetness Index of 15.8 indicates moderate moisture retention, neither parched nor waterlogged. The constraint here is not landscape position.
Photosynthesis and biology are both running well below capacity
The radar structure reading of -19.9 dB HV is in the thin-sward range, indicating low standing biomass and a sparse canopy. This pairs directly with the weak Energy Flow Index: there is not enough leaf area on the ground to capture the sunlight the south-facing aspect delivers. Below ground the picture is similar. Mineral Cycle Index at 39 percent and Community Dynamics Index at 33 percent suggest litter is not being incorporated and species diversity has thinned to a narrow set of generalists. The seasonal record reinforces this, with weekly Energy Flow averaging only 33 percent across the growing season and never recovering to the levels seen on neighbouring parcels. What this points to is a field that has been under continuous pressure without adequate recovery, or one that has been rested into thatch and lost its species mix. The absence of recorded mowing or grazing events in 2025 leans toward the second reading. On a non-brittle site like this one (brittleness 3.4), prolonged rest without animal impact lets dead material accumulate on stems rather than break down, which suppresses both mineral cycling and the germination of new species. The field is effectively suffocating under its own residue.
Recovery starts with planned impact, not seed
The first move is to get animal impact back onto this parcel under tight control. A high-density, short-duration graze in late spring or early summer, when growing-point reserves are full, will trample the existing standing dead into soil contact, expose bare patches for natural reseeding from the adjacent stronger fields, and stimulate tillering in the remaining productive species. Follow this with a long recovery period of 90 to 120 days, longer than the rest of the rotation, to let surviving plants set seed. Repeat the cycle two or three times across a single growing season before considering any seed intervention. The neighbouring parcels (Peter Rabbit's Patch, Mary's Garden, Wee Willie Winkie's Meadow) all carry healthy diverse swards at Score 6 to 7, which means the species pool is sitting right next door waiting to be transferred by hoof and dung. The trajectory to watch over the next assessment cycle is whether Community Dynamics lifts off the floor first. Diversity recovering before energy flow is the normal sequence on a flat south-facing parcel with good water cycling already in place. If after two seasons of planned grazing the Community Dynamics score is still below 45, that would be the moment to consider on-farm hay transfer from one of the diverse donor paddocks. Purchased seed should remain off the table for at least three growing seasons. The ingredients for recovery are already on this property.
Heffalump Pasture
 | Area: 0.2 ha Centroid: 50.4510° N, 3.7075° W Elevation (mean): 44 m Slope (mean): 6.5° Dominant aspect: S Topographic Wetness Index: 14.5 Landform: Flat 31% · Ridge 20% · Valley 49% Dominant Keyline Zone: 2 |
Flat 31% | Ridge 20% | Valley 49% |
Landform composition (proportion of parcel area)
Land Health Score sits mid-band with community diversity as the lever
Heffalump Pasture is a working pasture with all four ecosystem processes operating, and the constraint sitting where it most often sits on Devon grassland: community diversity. The land returns a Land Health Score of 5 (mid) on the grassland reference scale, placing it in the broad middle of the property's pasture estate. Water cycling is strong (Water Cycle Index 86 percent), mineral cycling is solid (Mineral Cycle Index 71 percent), and energy capture sits in a productive range (Energy Flow Index 72 percent). The Community Dynamics Index of 59 percent is the lowest of the four scores and is the lever that will move this field's Score upward over the next two to three assessment cycles.
The valley position is doing the hydrological work
The shape of this field explains why water cycling is so strong. Heffalump sits with nearly half its area in valley terrain, almost no ridge, and the rest as flat run-out, with a south-facing aspect at a moderate 6.5 percent slope. The Topographic Wetness Index of 14.5 is the moderate-moisture band typical of well-drained Devon pasture, neither boggy nor droughty. What this combination means in practice: rainfall lands, infiltrates, and is held in the profile rather than running off, and the south aspect drives an active growing season without pushing the field into summer water stress. The Water Cycle Index of 86 percent confirms this is happening as the topography would predict, the ground is doing its job.
Energy and minerals are working in step, diversity has not caught up
The pattern across the four processes tells a recognisable story. Energy capture and mineral cycling are tracking together in the low-70s, which is the signature of a pasture where the sward is photosynthesising well and where dung, litter, and root turnover are being processed back into the soil at a reasonable rate. Community diversity, at 59 percent, is roughly 12 to 13 points behind, and on a non-brittle Devon site (brittleness 3.4) this gap typically reflects a sward that has not yet been pushed to express its full species pool. The radar structural reading (HV at minus 18.2 dB, HH at minus 5.9 dB) shows a denser, more structurally varied sward than the property's lower-scoring fields, suggesting the genetic material is present in the seed bank and in the standing vegetation. It is expression, not depletion, that is the constraint.
What to try first, in order
The highest-leverage move on this field is rest combined with deferred grazing rather than any input or seed purchase. Take Heffalump out of the rotation for one full season, or defer the second half of the growing season, and let the existing species flower, set seed, and self-recruit. The 2024 growing season was generous (486 mm of rain, nine optimal weeks, zero stress weeks) and 2025 was a fair test (348 mm, four optimal weeks, three stress weeks), so the recent climate signal is not the limiting factor here. If a single deferral year does not lift the Community Dynamics Index by 3 to 5 points by the next assessment, the next step is a mob-grazing event late in the season to trample ripe seed heads into the surface, followed by another rest period. Only after two to three years of this sequence, if diversity is still stuck, would on-farm hay transfer from one of the property's species-rich paddocks (Peter Rabbit's Patch or Wee Willie Winkie's Meadow, both scoring in the high-60s for diversity) be the next move. Purchased seed is not warranted on the current data.
What to watch in the next assessment cycle
The trajectory to watch is whether the Community Dynamics Index moves up while the other three processes hold their ground. If diversity rises and Energy Flow or Mineral Cycle drops, the rest period has been too long and thatch is starting to accumulate. If all four rise together, the management is correct and Heffalump will move from Score 5 into Score 6 within two cycles. The field is set up to respond.
Hickory Dickory's Meadow
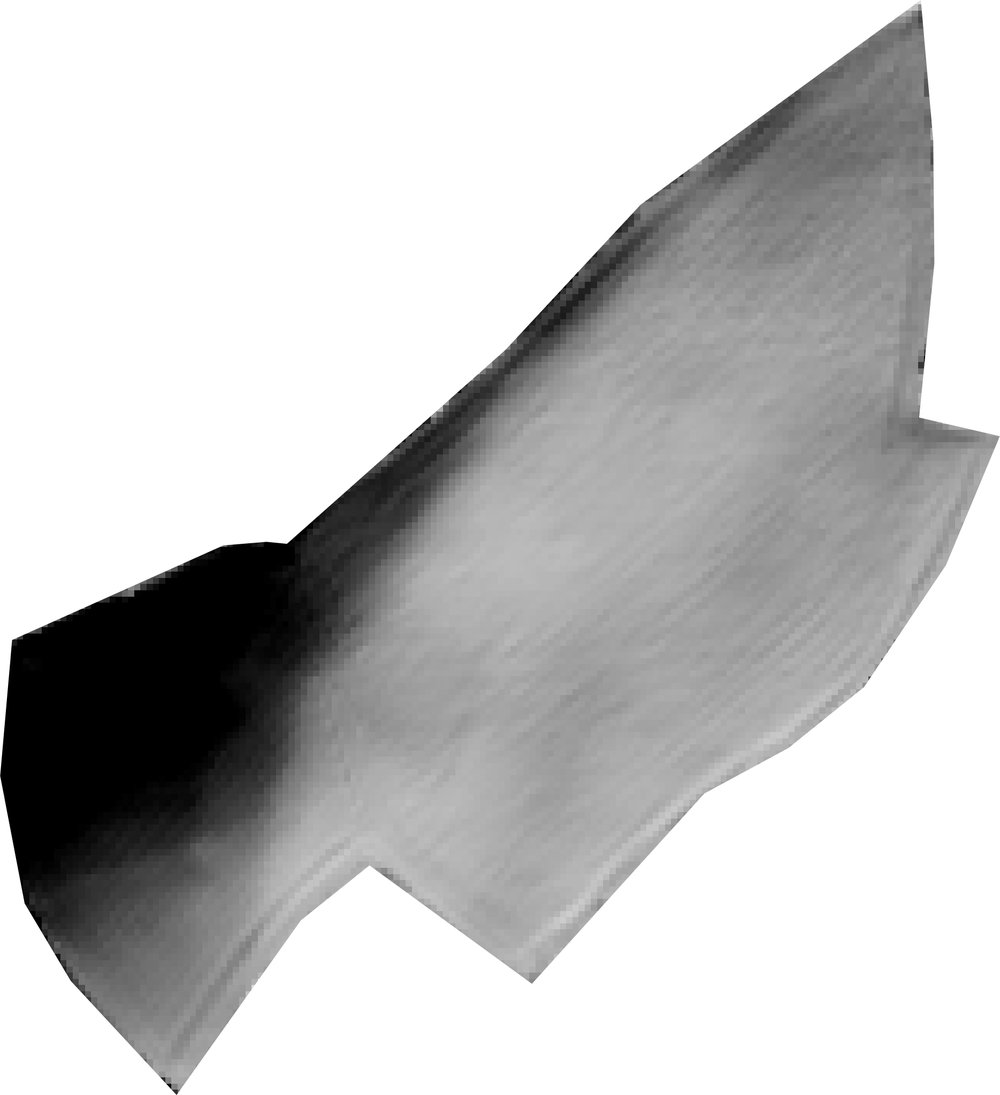 | Area: 5.2 ha Centroid: 50.4539° N, 3.6958° W Elevation (mean): 33 m Slope (mean): 3.2° Dominant aspect: E Topographic Wetness Index: 15.2 Landform: Flat 55% · Ridge 9% · Valley 36% Dominant Keyline Zone: 2 |
Flat 55% | Valley 36% |
Landform composition (proportion of parcel area)
Hickory Dickory's Meadow lands a Land Health Score of 5 (mid), placing it in the middle of the Wilder Wood grassland range and right at the transition between the recovering group and the working-but-stressed group below it. The story this field tells is a familiar one for the property: water cycling is solid, mineral cycling is respectable, but energy capture is the lid on the ceiling. Water Cycle Index reads 83 percent, Mineral Cycle Index 64 percent, Community Dynamics Index 50 percent, and Energy Flow Index 60 percent. The narrow spread between Energy Flow and Community Dynamics (ten points) is the diagnostic signal worth holding onto: this is the co-limited green-plus-community pattern, where the sward is productive enough to function but lacks the diversity to lift performance into the next band.
The valley-floor position explains the water performance
The field sits low in the landscape at 33 metres elevation with gentle 3.2 percent slopes, an east-facing aspect, and a Topographic Wetness Index of 15.2 that puts it firmly on the wet end of the property. Just over a third of the field is classified as valley floor and another nine percent as ridge, with the bulk sitting on transitional ground in Keyline Zones 2 and 3 (the upper-paddock and ridge-shoulder zones in Yeomans' framework). What this means in practice is that water arrives here from upslope and lingers, which the Water Cycle Index of 83 percent confirms. The radar reading of -20.9 dB HV backscatter sits in the moderate-biomass range for grassland, indicating a sward with reasonable structural density rather than thin or patchy cover. The growing conditions in 2025 were a fair test (348 mm growing-season rainfall, three stress weeks, four optimal weeks), neither a kind year nor a punishing one, so the score reflects genuine field condition rather than weather noise.
Species diversity is the highest-leverage lift
Community Dynamics at 50 percent is the limiting process underneath the energy ceiling, and on a non-brittle Devon site this points to a sward that has settled into a stable but narrow species composition. The Energy Flow reading of 60 percent and Mineral Cycle reading of 64 percent are the symptoms: a more diverse sward with deeper-rooting forbs, legumes, and herbs would lift both photosynthetic capture (more leaf layers, longer green season) and nutrient cycling (more litter-quality variation, better dung incorporation). Following the holistic management hierarchy for diversity recovery, the first moves here are management-based rather than seed-based. Extending recovery periods to let existing species flower and self-seed is step one. Step two is deferring the field for a full seed-set cycle in one growing season, ideally a year when adjacent paddocks can carry the stocking pressure. Step three, if the species pool proves genuinely depleted after two seasons of rest-plus-recovery, is on-farm seed transfer (cutting hay from the more diverse paddocks higher up the property, such as Peter Rabbit's Patch or Poohsticks Bridge, and spreading it here with livestock impact to trample seed in).
Watch for the seasonal hollow in late summer
The within-year pattern in the weekly indicators shows the field running below its annual mean for an extended stretch through the warmer months, with peaks in spring and a partial recovery in autumn. This is consistent with a sward that depends heavily on cool-season grasses and lacks deep-rooted summer-active species. As Devon growing seasons continue to show year-to-year variation in summer rainfall (2018, 2022, and 2025 all delivered drier-than-typical summers here), building summer resilience through species diversity becomes more valuable each year. The carbon flux is positive (the field is taking carbon out of the atmosphere at roughly six tonnes of carbon dioxide equivalent per hectare per year), so the productive capital base is building, the question is at what rate and with what resilience. The trajectory to watch over the next two assessment cycles is whether the Community Dynamics score lifts above 55 under extended recovery, which would unlock both the Energy Flow and Mineral Cycle ceilings simultaneously.
Humpty Dumpty's Wall Field
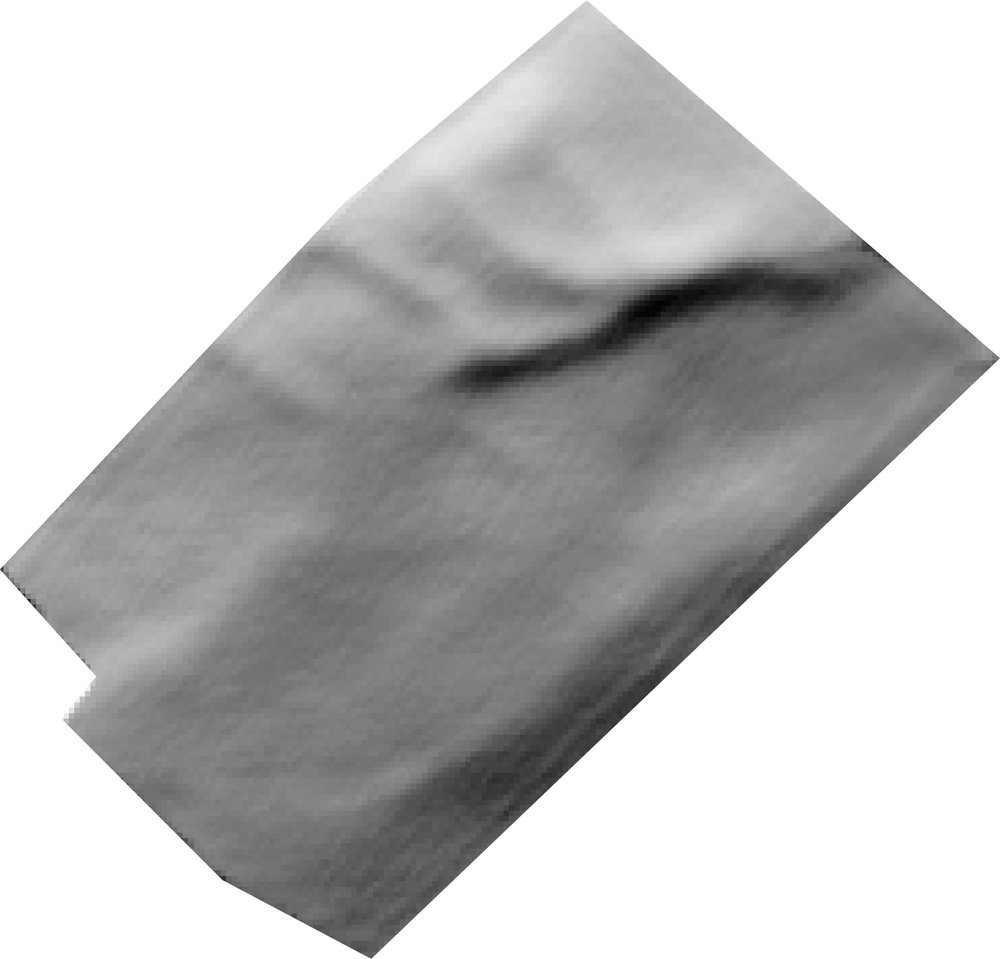 | Area: 6.5 ha Centroid: 50.4561° N, 3.7065° W Elevation (mean): 8 m Slope (mean): 2.5° Dominant aspect: E Topographic Wetness Index: 17.6 Landform: Flat 34% · Ridge 0% · Valley 66% Dominant Keyline Zone: 2 |
Flat 34% | Valley 66% |
Landform composition (proportion of parcel area)
Land Health Score sits mid-band with diversity as the constraint
Humpty Dumpty's Wall Field carries a Land Health Score of 5 (mid), placing it in the broad transitional middle of the grassland portfolio. The headline reading is that water and minerals are functioning well, energy capture is moderate, and species diversity is the genuine constraint. This is a field doing the basics right while waiting for its biological community to catch up to its hydrology. The supporting numbers tell a consistent story. Water Cycle Index of 84 percent indicates rainfall is infiltrating and being held in the profile reliably, which matches what the topography would predict. Mineral cycling sits at 65 percent, energy flow at 65 percent, and community diversity at 51 percent. The fifteen-point gap between water and diversity is the diagnostic signal here: this is a community-stalled pattern, where the underlying ecosystem services are working but the species toolkit on top of them is thin.
The field sits in a wet valley pocket that explains the water story
The topography here is unusual and worth understanding. The field sits low on the property at eight metres elevation, with two-thirds of its area in valley position and a Topographic Wetness Index of 17.6, which is one of the wetter readings on the holding. Slope is gentle at 2.5 percent and aspect is east-facing, so morning sun dries the dew but afternoon shade conserves moisture. The Keyline landscape zone breakdown shows half the field in the primary ridge-to-valley transition zone and a sixth in the lower collection zone. In plain terms, this is a field that water flows into and lingers in. That is why the Water Cycle Index reads so strongly. It also explains why the radar structural signal is moderate (HV at -21.1 dB), the standing biomass is reasonable for a wet valley grassland but not exceptional, consistent with a sward that has good moisture but limited species range to fully exploit it.
Diversity is the lever, and the remedy is management not seed
A Community Diversity Index of 51 percent on a field with strong water and reasonable minerals points to a sward that has simplified over time, likely toward a handful of dominant grasses with limited forb and legume representation. The good news is this is the most addressable of the four ecosystem processes on this field, and the holistic management hierarchy gives a clear sequence to work through before any seed is purchased. The first move is rest. Extending the recovery period between grazings allows existing subordinate species in the sward to express, flower, and self-seed. The second move is grazing impact: a short, high-density graze followed by long rest tramples ripe seed into the surface and breaks up any thatch that may be suppressing germination niches. The third move, if a full season's deferral can be afforded, is to take the field out of rotation entirely for one growing season and let the existing seed bank complete a full cycle. Only after two or three seasons of those interventions, if diversity has genuinely not responded, would on-farm seed transfer from a more diverse paddock (cutting hay with ripe heads from Peter Rabbit's Patch or Poohsticks Bridge and spreading it here under trampling pressure) become the next step.
What to watch in the next assessment
The trajectory to track over the next two to three years is whether community diversity lifts from the low fifties toward the mid-sixties seen on the stronger fields, while water and minerals hold their current strength. The growing season just past was a fair test with three stress weeks and four optimal weeks, neither a drought nor an easy year, so the current scores reflect management more than weather. If diversity moves up under a rest-first regime, the Land Health Score for this field will follow it into the next band without any other intervention required.
Jack & Jill's Hill
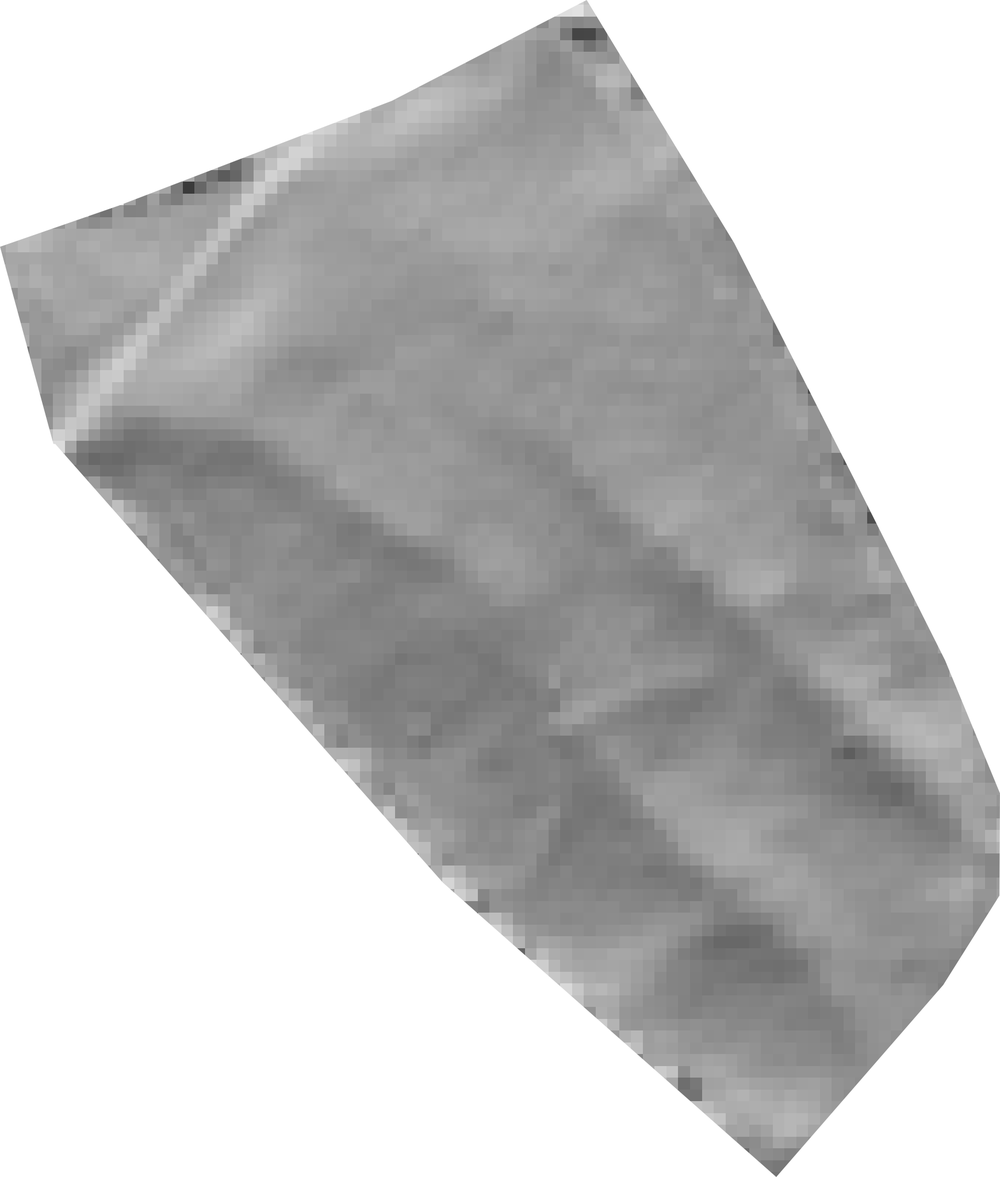 | Area: 1.8 ha Centroid: 50.4525° N, 3.7118° W Elevation (mean): 41 m Slope (mean): 7.0° Dominant aspect: E Topographic Wetness Index: 14.6 Landform: Flat 17% · Ridge 6% · Valley 77% Dominant Keyline Zone: 2 |
Flat 17% | Valley 77% |
Landform composition (proportion of parcel area)
Water cycle is strong, community diversity is the constraint
Jack & Jill's Hill is functioning well. The field sits at Land Health Score 6 (mid), with water cycling and mineral cycling both in healthy territory and energy capture holding steady through the season. The pattern across the four ecosystem processes is the one you would expect on a well-managed pasture in this part of Devon: water comes in and stays in, the canopy is doing its job, nutrients are turning over, and species diversity sits a step behind the other three. That last point is where the headroom is. In numbers, the Water Cycle Index reaches 90 percent, Mineral Cycle Index 81 percent, Energy Flow 76 percent, and Community Diversity 65 percent. The 25-point gap between water and diversity is the signature finding here. It says the field is hydrologically and biologically working, but the plant community itself has not yet caught up with the underlying conditions the land is offering. This is a common pattern on pastures that have been well-rested and well-fed but have not had the species pool widened or the rotation pressure that drives non-selective intake and seed transfer.
The field sits in a valley, which explains the water performance
Three-quarters of Jack & Jill's Hill (77 percent) is valley floor, with only a small ridge fraction (6 percent) and the rest flat. The Topographic Wetness Index of 14.6 confirms a landscape position that collects and holds water. Combined with the east-facing aspect, this field gets morning sun, dries its dew early enough to reduce fungal pressure, and then holds moisture through the warmer afternoon. The 90 percent Water Cycle reading is consistent with that geometry. There is a 10 percent steep fraction worth noting, those slopes will be the most sensitive to hoof damage in wet conditions and the first to show compaction if winter access is mismanaged. The radar reading (HV at -16.9 dB, HH at -11.1 dB) puts structural biomass in the upper-mid range for grassland on this property. The sward has body to it, which matches the strong mineral cycle score: litter is being produced, trampled, and incorporated. There is no signal of overgrazing or bare ground.
Diversity is the lever, and rest plus impact is the first move
The Community Diversity score of 65 percent is not low in absolute terms, the field is well above the threshold where diversity becomes a structural problem, but it is the limiting process on this parcel and the one with the most room to grow. On a non-brittle site like this (brittleness 3.4), rest aids recovery and the existing species pool will respond to being given time to flower and set seed. The first move is to extend recovery between grazings on this field through one full growing season, particularly across the May to July window when the broader-leaved species need to complete their flowering cycle. If the species pool turns out to be genuinely thin after a deferral year, the next step is on-farm seed transfer from one of the higher-diversity fields on the property (Peter Rabbit's Patch and Wee Willie Winkie's Meadow both sit at Score 6 or 7 with similar landscape position and would be sensible donor sites for hay-with-seed transfer).
Climate has been kind, and that should inform expectations
The 2025 growing season delivered 348 mm of rain with four optimal weeks and three stress weeks, sitting in the middle of the eight-year range for this property. This was a fair test, not a stressed year, so the scores reported here reflect genuine field condition rather than weather-driven suppression. Carbon flux shows the field building productive capital at around 6.1 tCO2e per hectare per year, a healthy net uptake consistent with the ecosystem process scores. The trajectory to watch over the next two assessment cycles is whether community diversity moves up toward the high-60s and 70s as rest and seed-set windows are protected. If it does, the Land Health Score on this field will follow it into the upper band without any other intervention required.
Jack's Beanstalk Field
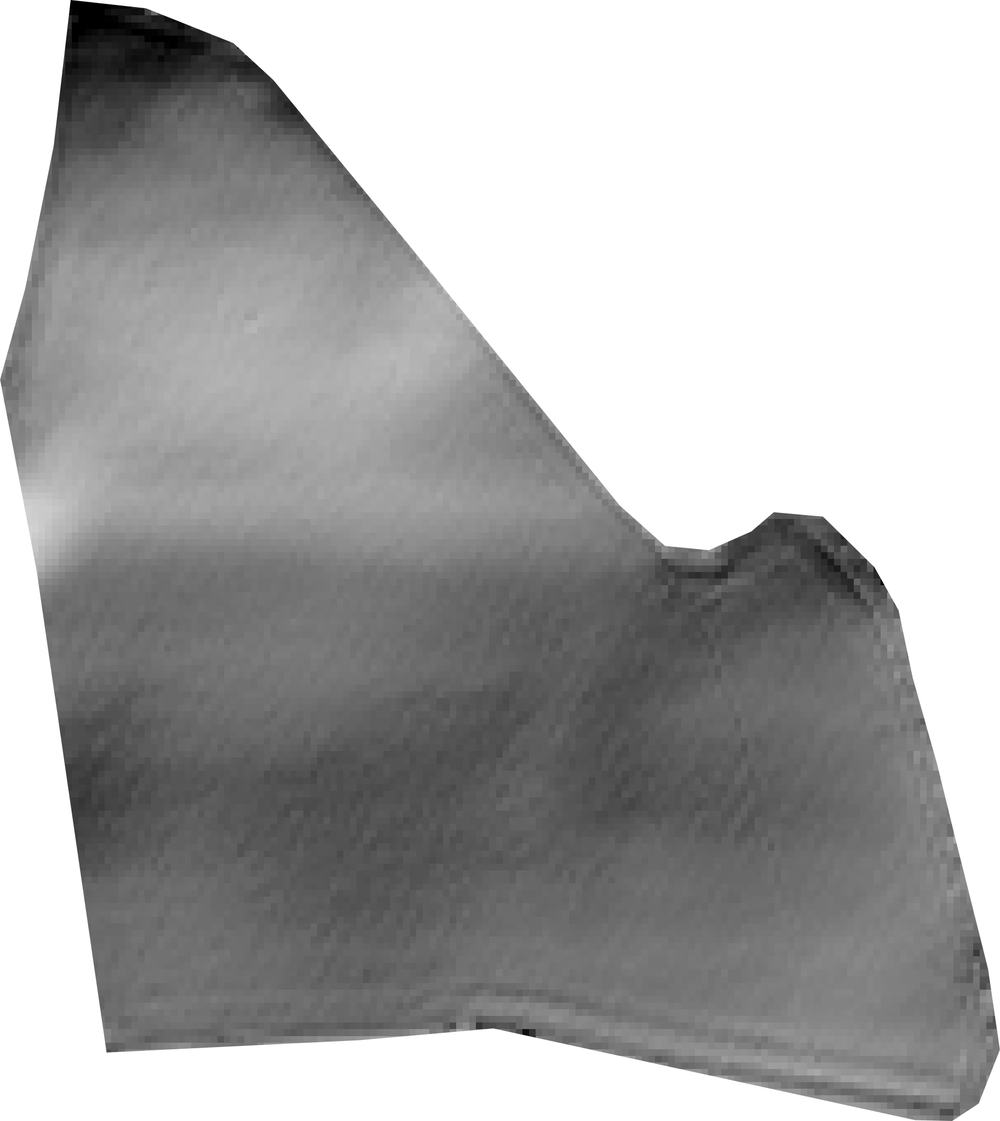 | Area: 6.1 ha Centroid: 50.4574° N, 3.6861° W Elevation (mean): 39 m Slope (mean): 3.0° Dominant aspect: W Topographic Wetness Index: 15.5 Landform: Flat 63% · Ridge 4% · Valley 32% Dominant Keyline Zone: 3 |
Flat 63% | Valley 32% |
Landform composition (proportion of parcel area)
The headline finding is a single weak link in an otherwise solid field
Jack's Beanstalk Field is functioning well overall, with the bottleneck sitting clearly in energy capture rather than water or soil. The water side of the ledger is strong, the mineral side is competent, and the diversity side is mid-range, but photosynthetic productivity is running below what the position and moisture availability would support. This is the kind of pattern where one targeted lever shifts the whole field upward, because the supporting processes are already in place to carry the gain. The current Land Health Score is 5, sitting in the lower portion of the Transitional band. Water Cycle Index reads 84 percent, Energy Flow Index 61 percent, Mineral Cycle Index 65 percent, and Community Dynamics Index 51 percent. The spread tells the story: water is the strongest process by a clear margin, energy flow trails the pack, and community diversity is the next constraint behind it. Both energy and diversity are within reach of the next band with a single growing season of focused management.
Landscape position is set up to hold water, and the readings confirm it
This field sits in a gently sloping, west-facing position with a strong valley character. Roughly a third of the area reads as valley floor and nearly two-thirds reads as flat, with the Topographic Wetness Index registering 15.5, which is firmly on the moisture-gathering side of the range. The field sits across Keyline Zones 2 and 3, with the larger share in Zone 3 (the primary production zone below the keyline). Rainfall that lands upslope is drifting toward this parcel rather than away from it. The water cycle reading of 84 percent reflects this advantage being captured rather than wasted. Infiltration is working, soil moisture is being held, and there is no thermal signal suggesting evapotranspiration stress on the field surface. For a parcel with this much built-in moisture advantage, the question is what is happening above the soil that is preventing that moisture from being converted into biomass at the rate the position would predict.
Energy capture is the limiting process and the radar reading explains why
Photosynthesis is the binding constraint on this field. The structural biomass reading is the lowest in the grassland set, with HV backscatter at -22.0 dB and HH at -13.3 dB. Both values point to a thin, low-volume canopy: there is simply not much living plant tissue standing in the field to intercept sunlight. With water and minerals already in place, this is the leak. Every additional unit of leaf area on this field will be converted to biomass efficiently, because the supporting conditions are not the constraint. Combined with no mowing or grazing events recorded through the year, the pattern suggests a sward that has been resting without the impact needed to stimulate tillering and fresh growth. Long rest on a non-brittle site at moderate stocking can produce exactly this signature: cover present, but thin and senescing rather than actively photosynthesising. The seasonal pattern from the weekly tracking reinforces this, with Energy Flow averaging only 32 percent across the growing season and a peak well below what neighbouring fields in similar positions achieved.
Diversity is the second lever, and it will move on its own if the first is pulled
Community Dynamics at 51 percent puts species diversity in the lower-middle range for the grassland set. This is a field that has the basic functional groups but not the depth of species that drives resilience in dry weeks. The 2025 growing season delivered 348 mm of rainfall (the third-driest year in the run) with three stress weeks, so there is reason to think a more diverse sward would have held productivity better through the July to August window. The remediation order here is straightforward and does not require purchased seed. A single high-density grazing pass timed for late spring, hitting the field hard for two or three days and then resting it for the rest of the season, will both stimulate the tillering that the energy reading is asking for and trample existing seed into the soil. If a neighbouring species-rich field (Peter Rabbit's Patch and Wee Willie Winkie's Meadow both score well above 65 on the diversity index) can spare a late-summer hay cut with ripe seed heads, that hay rolled out and trampled on Jack's Beanstalk would do more for diversity in one season than three years of overseeding.
What to watch next year
The trajectory to look for in the next assessment is the structural biomass reading climbing from the current -22 dB into the -19 to -20 dB range, with Energy Flow moving from 61 percent toward 70 percent. If that happens, expect Community Dynamics to follow within a season or two, and the Land Health Score should move into the Recovering band. If the structural reading stays flat after a season of impact and rest, that points to a deeper limitation worth investigating on the ground, most likely a sward-composition issue (rank, ungrazable species dominating) rather than a soil or water problem.
Kanga's Long Meadow
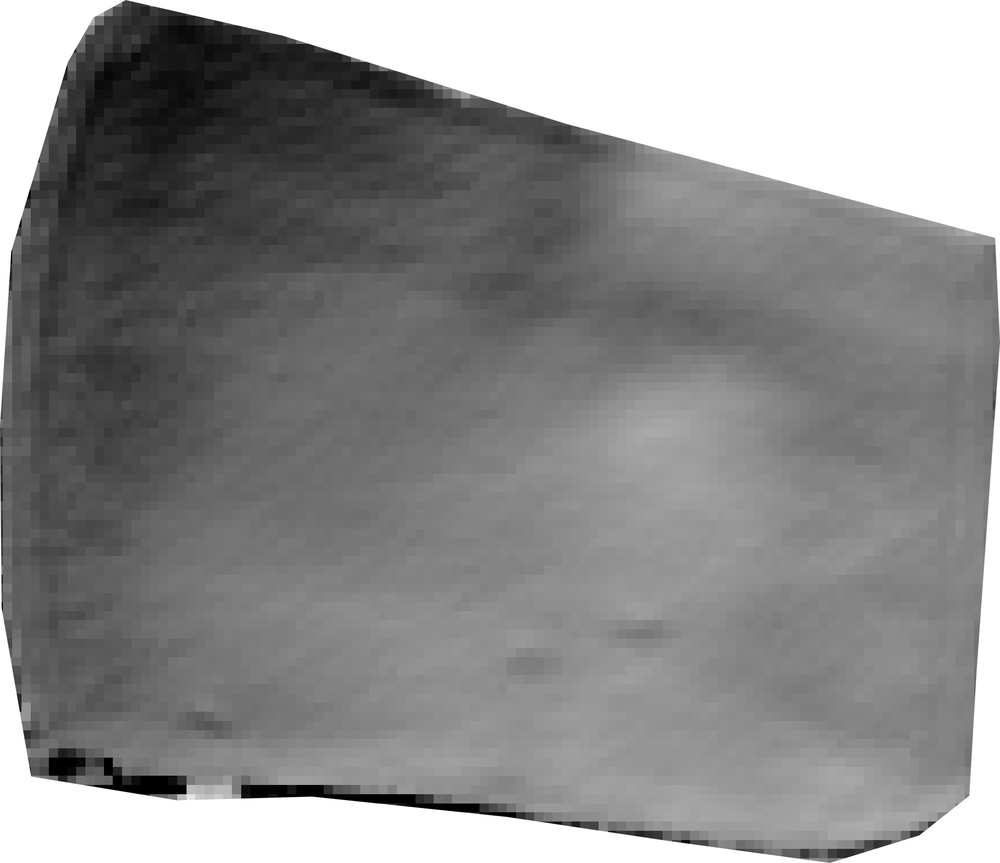 | Area: 3.3 ha Centroid: 50.4507° N, 3.6996° W Elevation (mean): 55 m Slope (mean): 4.6° Dominant aspect: E Topographic Wetness Index: 15.1 Landform: Flat 48% · Ridge 18% · Valley 34% Dominant Keyline Zone: 2 |
Flat 48% | Ridge 18% | Valley 34% |
Landform composition (proportion of parcel area)
Land Health Score sits mid-band, with energy capture the constraint
Kanga's Long Meadow is functioning at a transitional level, with a Land Health Score of 5 (low) and the data pointing to energy capture as the process holding it back. Water cycling is the strongest leg of the stool here, infiltration and retention are working as you would expect on a moderate east-facing slope, but the canopy is not converting that water and sunlight into biomass as efficiently as the better-performing meadows on the property. The Water Cycle Index sits at 81 percent, comfortably in the functional range, while the Energy Flow Index reads 63 percent, mineral cycling 67 percent, and community dynamics 53 percent. Read against the top fields on the farm (Peter Rabbit's Patch and Poohsticks Bridge both clear the upper-60s in Land Health Score), this meadow is a step behind on photosynthetic productivity and a meaningful step behind on species diversity.
Landscape position is favourable, the gap is biological
The topography here is working in your favour, which is why the energy gap is worth attention rather than dismissal. Kanga's Long Meadow sits at 55 metres elevation on a gentle 4.6 percent slope, with a Topographic Wetness Index of 15.1 indicating moderate moisture-holding capacity, an east-facing aspect that catches morning sun and dries dew early (good for fungal disease pressure), and 96 percent of the parcel falling within Keyline Zone 2 (the productive mid-slope band where most of a property's grazing capacity lives). Roughly a third of the field reads as valley landform and just under a fifth as ridge, with the balance flat. None of those features explain a depressed energy score on their own. The radar structure tells the same story from another angle: HV backscatter of -22.6 dB places this parcel among the structurally thinner swards on the farm, well below the dense pastures like Floody Place (-13.9 dB) or Pooh Corner Meadow (-16.4 dB). The sward is physically light, not just visually so.
Community diversity is the deeper lever
Community dynamics at 53 percent is the quieter finding but probably the more important one. Diversity sets the ceiling on how well a meadow can respond to a wet year, a dry year, or a change in grazing pattern, and at this level the species pool is doing competent work but not expressing the range you would want on a parcel with this kind of landscape position. The growing season just past was a fair test (348 mm of rain, three stress weeks, four optimal weeks, drier than 2024 but not unusual for the property), so the readings reflect underlying capacity rather than weather damage. Looking back across the eight-year record, the site as a whole peaked at Land Health Score 6 in 2023 and has eased back to Score 5 since, a pattern consistent with the wider property settling into a working equilibrium rather than continuing to climb. This meadow is part of that broader plateau.
What to try first, and what to watch
The remediation order for this parcel is rest before anything else. Extending the recovery window between grazings, even by a week or two, gives the existing species pool a chance to flower, set seed, and self-recruit, which is the cheapest and most durable way to lift both energy capture and diversity. If you can defer Kanga's Long Meadow for a full season at some point in the next two years, ideally letting the sward run to seed, that single decision is likely to move the Score more than any input would. A second-order option, once the rest has been given time to work, is on-farm seed transfer from your stronger meadows: cutting hay from Peter Rabbit's Patch or Poohsticks Bridge when their seed heads are ripe and laying it down here for stock to trample in. Purchased seed is a last resort and almost certainly unnecessary on a property with this many high-functioning donor paddocks already in your rotation. The trajectory to watch over the next two assessment cycles is whether energy capture lifts toward the 70 percent band the better meadows are holding, with community diversity following a year or two behind. That is the normal sequence and the data does not suggest anything is blocking it.
Little Boy Blue's Haystack
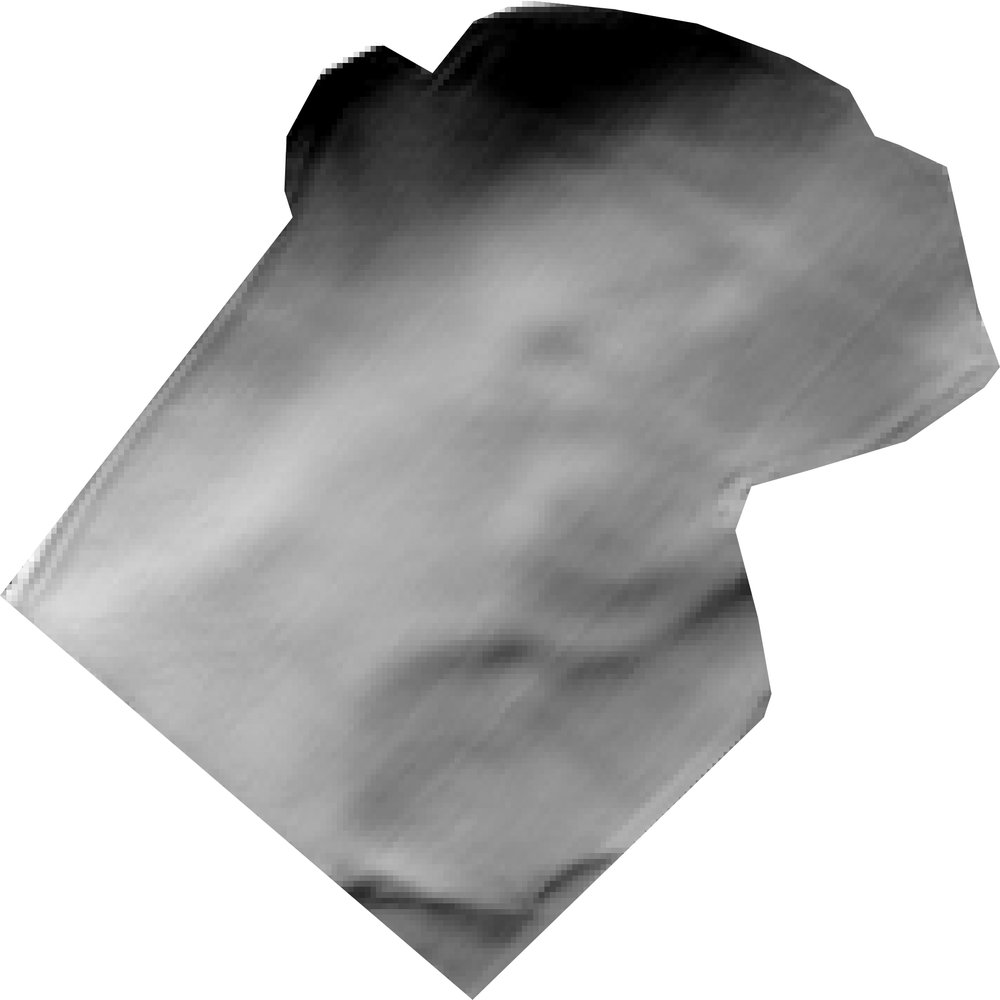 | Area: 7.1 ha Centroid: 50.4584° N, 3.7036° W Elevation (mean): 13 m Slope (mean): 7.3° Dominant aspect: E Topographic Wetness Index: 19.7 Landform: Flat 12% · Ridge 3% · Valley 85% Dominant Keyline Zone: 2 |
Flat 12% | Valley 85% |
Landform composition (proportion of parcel area)
Little Boy Blue's Haystack carries a Land Health Score 6 (low) on the current annual snapshot, putting it in the heart of the grassland portfolio. The field is functioning well as a productive pasture: water cycling reads 90 percent, mineral cycling 78 percent, energy capture 72 percent, and community diversity 62 percent. The standout is the water side. This is a valley-bottom field at 13 m elevation with a Topographic Wetness Index of 19.7, and 85 percent of its area classifies as valley floor. Water arrives here from the surrounding catchment, and the data shows it is being held and used rather than running off.
Species diversity is the quietest weakness, and it is also the most fixable
Across the four ecosystem processes, the gap between the strongest (water at 90) and the weakest (community at 62) is wide enough to call community dynamics the limiting process here, even though 62 percent is by no means a poor reading. The pattern is typical of productive Devon pasture: water and mineral cycling are doing their job, energy capture is healthy, and the sward composition is the constraint on the next band up. The first move is rest and timing rather than seed. Extending recovery between grazes through one full summer to let existing species flower and self-seed, then high-density grazing to trample seed in, will usually move community scores upward without any external inputs. If a year of that yields little, on-farm hay transfer from one of the higher-diversity paddocks (Peter Rabbit's Patch or Wee Willie Winkie's Meadow, both running community scores in the high 60s) is the next step.
The valley position is the field's defining feature, and a quiet risk on the wet end
The intra-week stress data the synth weekly captures shows a fuller picture than the annual snapshot: mean energy capture across the weekly series sits at 33 percent and mean community diversity at 39 percent, well below the annual aggregates. That gap is the seasonal signature of a valley-bottom field. In the wet shoulder seasons it sits saturated, and energy capture drops because the soil is too cold and wet for grass to grow at pace; in the dry midsummer weeks it is the field still holding moisture when neighbouring ground is browning. The annual score averages those out into a respectable 72 and 62, but the within-year swing is the thing to manage around. Practically, this means Little Boy Blue's Haystack is your wet-shoulder paddock to keep livestock off when the rest of the property is going in, and your summer-resilience paddock when others are stressed. The 11 percent steep area combined with the valley position also flags that the wettest corners are where pugging will show up first; light stock at high moisture, or deferral until the ground firms, will protect the structure that gives this field its water-holding character.
Carbon and structure both read in the productive-pasture range
The carbon flux estimate of +6.1 tonnes of CO2 equivalent per hectare per year places Little Boy Blue's Haystack alongside the rest of the grassland portfolio: the field is taking carbon out of the atmosphere and building productive capital, with photosynthesis (gross primary productivity, GPP) of 1200 gC/m2/yr against ecosystem respiration of 896. Structurally the radar signature (HV at -19.9 dB) sits in the typical permanent-pasture band, no hedgerow or scrub encroachment to flag, no recent disturbance. The trajectory to watch over the next two assessment cycles is whether community diversity moves up from 62 toward the high 60s where the better-performing valley fields on this property already sit. That is the lever that would carry Little Boy Blue's Haystack into the Score 7 band, and rest-led management is the route there.
Mary's Garden
 | Area: 1.4 ha Centroid: 50.4527° N, 3.7140° W Elevation (mean): 21 m Slope (mean): 6.2° Dominant aspect: E Topographic Wetness Index: 18.7 Landform: Flat 56% · Ridge 17% · Valley 27% Dominant Keyline Zone: 2 |
Flat 56% | Ridge 17% | Valley 27% |
Landform composition (proportion of parcel area)
Mary's Garden is performing well, sitting toward the upper-middle of the grassland fields with a Land Health Score of 6 (mid). Water cycling and mineral cycling are the strong suits here, while species diversity is the constraint worth paying attention to. The field's east-facing aspect, gentle slope, and mixed landscape position give it a balanced character: enough relief to drain, enough flat ground to retain moisture, and a topographic wetness reading (18.7) that points to a field that holds water without becoming waterlogged. The water cycle here is excellent, with a Water Cycle Index of 92 percent. That is among the best readings on the property and reflects the field's position. Roughly two-thirds of the ground sits in the keyline transition zone (Zone 2) with smaller portions on ridge shoulders and in valley fingers, giving water multiple pathways to infiltrate rather than run off. Mineral cycling at 79 percent reinforces the picture of a field where litter is being incorporated and nutrients are turning over reliably. These are the two processes that underpin everything else, and they are in good order.
Species diversity is the lever with most room to move
The Community Dynamics Index of 64 percent is the lowest of the four process scores, and this is the pattern worth working with rather than against. Energy capture sits at 75 percent, which is healthy for grassland and consistent with the structural biomass reading from radar (HV at -18.7 dB, comfortably in the productive pasture range). What the numbers describe is a field that is photosynthesising well and cycling water and minerals well, but whose plant community is narrower than it could be. This is common on productive grasslands where a few competitive species dominate; the constraint is not vigour, but variety. The first moves here follow the standard recovery hierarchy. Extending rest periods to let existing minor species flower and self-seed is the cheapest and lowest-risk start. If you have a paddock elsewhere on the farm that is more diverse, cutting hay with ripe seed heads from that donor area and spreading it on Mary's Garden, with stock following to trample it in, is the next step up. Both should be tried over two to three seasons before any thought of purchased seed. The fundamentals here (water, minerals, energy) are strong enough that added diversity should establish readily once seed and opportunity meet.
A fair growing season with no thermal stress signal
The 2025 growing season was a fair test rather than a stressed one, with rainfall around 348 mm during the growing months and three weeks of moisture stress, broadly typical for the region. The thermal signature for Mary's Garden sits exactly on the site mean, with no sign of evapotranspiration stress or compaction-driven heat. Combined with the strong Water Cycle Index, this suggests the field's hydrology is working as designed and the score you see this year is a reliable reflection of management potential rather than a weather artefact. The trajectory to watch over the next two to three years is whether the diversity score moves up under extended rest, which would lift the overall Land Health Score into the 7 band where the top fields on this property already sit.
Mr McGregor's Garden
 | Area: 3.1 ha Centroid: 50.4505° N, 3.6899° W Elevation (mean): 32 m Slope (mean): 6.3° Dominant aspect: N Topographic Wetness Index: 14.7 Landform: Flat 16% · Ridge 3% · Valley 82% Dominant Keyline Zone: 2 |
Flat 16% | Valley 82% |
Landform composition (proportion of parcel area)
Land Health Score 6 sits in the middle of the property's range
Mr McGregor's Garden is functioning as a typical Devon pasture on this property: solid water cycling, decent energy capture, and species diversity as the constraint that decides where it goes next. The field carries a Land Health Score 6 (mid), placing it near the middle of the grassland parcels and broadly in line with what the topography and aspect would predict. The headline reading is steady, productive grassland with room to lift on the community side. The four ecosystem processes line up in the order you would expect for a well-managed but conventionally-stocked pasture: Water Cycle Index at 86 percent, Mineral Cycle Index at 75 percent, Energy Flow Index at 70 percent, and Community Dynamics Index at 59 percent. Water is comfortably the strongest process, mineral cycling is healthy, energy capture is reasonable for a north-facing field at this latitude, and species diversity is the weakest of the four. That ordering is the signature of a pasture that infiltrates and retains rain well, recycles dung and litter effectively, but holds a relatively narrow species pool.
North aspect explains the energy ceiling
The field faces north, sits at 32 m elevation, and runs predominantly through the valley landform with 82 percent of its area in valley position and only 3 percent on ridge. The slope averages 6.3 percent with a small 6 percent steep fraction. A north-facing valley field at this latitude receives meaningfully less solar radiation than the south-facing parcels on the property, particularly in the shoulder seasons, which puts a natural ceiling on how high the Energy Flow Index can climb without changing the canopy structure. The field's energy reading of 70 percent is best read against that aspect-adjusted expectation, not against the south-facing parcels like Old Brown's Field or Mr Toad's Hall. The valley position is the other half of the story. Valleys collect water, and the Topographic Wetness Index of 14.7 confirms this is a moisture-receiving rather than moisture-shedding part of the landscape. The water cycle reading of 86 percent makes sense in that context: the field is doing what a valley should do, which is hold and infiltrate. Radar structure at HV minus 19.0 dB and HH minus 13.1 dB is consistent with a moderately dense sward typical of permanent pasture, with no signal of bare ground or recent disturbance.
Species diversity is the limiting process
The Community Dynamics Index of 59 percent is the lowest of the four processes and the leverage point for this field. On a non-brittle Devon site with reliable rainfall, a low community score in an otherwise functional pasture usually points to a narrow species pool, which is to say the sward is dominated by a handful of productive grasses with limited herb, legume, and deep-rooting diversity. The pattern is consistent across most of the grassland parcels on this property, so this is a site-wide opportunity rather than a Mr McGregor's Garden problem. The remediation sequence here follows the holistic management hierarchy and starts with what you already have. The first move is extended rest in late spring and early summer to let whatever diverse species are present express, flower, and self-seed. The second is mob grazing at higher density and shorter duration to trample seed into the surface and break up any thatch that is suppressing germination. If after one or two seasons the species pool genuinely looks depleted, on-farm seed transfer from a more diverse paddock (cutting hay with ripe seed heads and spreading it here while livestock trample it in) is the next step before any purchased seed is considered.
Carbon and trajectory point in the right direction
The field is taking carbon out of the atmosphere at roughly 6.1 tonnes of CO2-equivalent per hectare per year, which is the property-wide figure for grassland parcels and reflects a productive sward building soil organic matter at a healthy rate. Combined with the strong water cycle reading and the absence of any disturbance signal in the radar record, the trajectory here is one of incremental gain. Lifting the community score by 10 to 15 points over the next three years through rest and mob grazing would carry this field from a Land Health Score 6 (mid) toward the upper end of the band, and would also lift mineral cycling and energy flow as a by-product of greater root depth and litter diversity. The thing to watch in next year's assessment is whether the community reading begins to move while the water and mineral readings hold; that pattern would confirm the management response is working.
Mr Toad's Hall Field
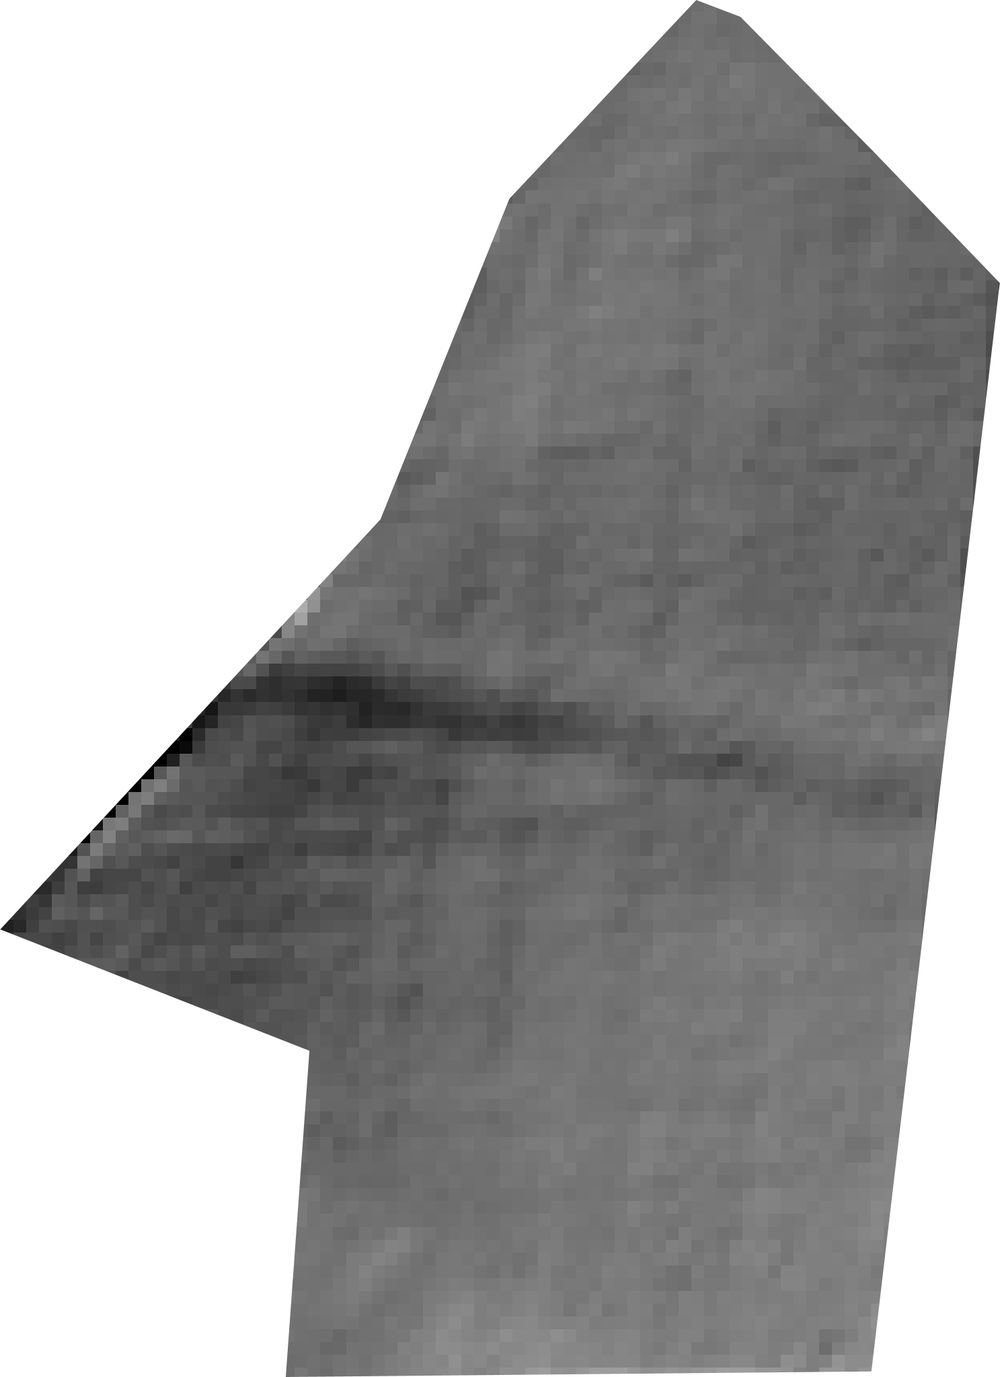 | Area: 2.0 ha Centroid: 50.4536° N, 3.7081° W Elevation (mean): 37 m Slope (mean): 7.0° Dominant aspect: S Topographic Wetness Index: 14.4 Landform: Flat 16% · Ridge 0% · Valley 83% Dominant Keyline Zone: 2 |
Flat 16% | Valley 83% |
Landform composition (proportion of parcel area)
Land Health Score 5 with energy capture as the constraint
Mr Toad's Hall Field sits in the lower half of the grassland parcels on this property, carrying a Land Health Score 5 (low) and showing the classic signature of a field where energy capture is the bottleneck holding everything else back. Water cycling is reasonable, mineral cycling is competent, and species diversity sits in the working range, but the canopy is not converting available sunlight into biomass at the rate the rest of the field's foundations could support. This is a recoverable position and the levers are well understood, but the gap between this field and the better-scoring neighbours is real and worth addressing. The four-process readout shows water cycle at 79 percent, energy flow at 54 percent, mineral cycle at 59 percent, and community diversity at 48 percent. Energy flow is the lowest by a meaningful margin and sits below the 55 percent threshold where the diagnostic framework flags a genuine green-process constraint rather than noise. Mineral cycling and diversity are close behind, which is the pattern you would expect when canopy underperformance starves the litter layer and slows the feedback into soil biology. Water is the strongest leg of the stool, which is good news because it means the foundation is in place for the other three to rebuild once the canopy thickens.
A south-facing valley field that should be one of the strongest
The topology here is genuinely favourable, which makes the current Score 5 reading more interesting than it would be on a harder piece of ground. The field sits at 37 metres on a 7 percent south-facing slope, with 83 percent valley landform and 92 percent in Keyline Zone 2 (the productive grazing platform between ridge and valley floor). Topographic Wetness Index (TWI) of 14.4 is moderate, neither boggy nor droughty. South aspect at this latitude means roughly 30 to 50 percent more winter radiation than a north-facing equivalent, earlier spring green-up, and a longer effective growing season. By landscape position alone this should be a top-quartile field on the property, comparable to Peter Rabbit's Patch or Wee Willie Winkie's Meadow, both of which sit at Score 6 or 7 on similar valley ground. The radar structural reading of -20.1 dB cross-polarised backscatter is consistent with a thin sward rather than a dense, multi-layered canopy. For context, the better-scoring valley fields on this property carry structural readings several decibels higher, which translates to noticeably more standing biomass volume per hectare. A south-facing valley field should be building canopy faster than this, particularly in a year like 2024 with 486 mm of growing season rain and nine optimal weeks, and the fact that it is not suggests the limitation is in how the field is being managed (rest, recovery, grazing intensity) rather than in what the land could support.
Seasonal patterns point to recovery time as the lever
The weekly readings through the year tell a consistent story: energy flow averages 34 percent across the season, water cycle averages 51 percent, and mineral cycle averages 31 percent. These weekly averages are lower than the annual composite scores because they include the dormant shoulders of the year, but the relative ranking is the same: energy is the constraint and mineral cycling is following it down. The peak weekly Land Health reading reaches 66 percent, which tells you the field has the capacity to perform at Score 6 when conditions align. The gap between peak and mean is the recovery deficit. The sward is being asked to express itself before it has rebuilt enough leaf area to drive strong photosynthesis. There are no mowing or grazing events logged against this field in the season's record, which is worth flagging as a data point to confirm against the grazing diary. If the field genuinely sat unrested-unmanaged through the season, the low energy reading is consistent with a thatch-bound sward where dead material is shading out new growth, a common pattern on non-brittle sites (brittleness 3.4 here) when rest extends beyond the biological decay window. If the field was actually grazed and the records are incomplete, the same low reading points to insufficient recovery between grazings.
What to try first, and what to watch
The first lever is recovery time. Extend the rest period on this field by 50 to 100 percent beyond the current rotation and observe whether canopy structure responds over the next two grazing cycles. The radar structural signal is sensitive enough to pick up biomass rebuilding within a season, so this is testable. The second lever is a single high-density grazing event timed to break thatch and stimulate tillering, followed by a long rest to let the released growing points express. On a non-brittle south-facing field with good water, this combination typically lifts energy flow by 10 to 15 points within two seasons. Hold off on any seed intervention here. Community diversity at 48 percent is the lowest of the four processes but it is not the binding constraint, and on a site with brittleness this low (3.4, a soft, forgiving climate) the existing seed bank will express itself once light reaches the soil surface again. The diagnostic order on this field runs energy first, then mineral cycling and diversity will follow as the canopy rebuilds and the litter layer reactivates. Re-check the field in next year's assessment for movement in the structural radar signal and the seasonal peak energy reading. Both should respond before the composite Score does, giving an early read on whether the management adjustment is working.
Old Brown's Field
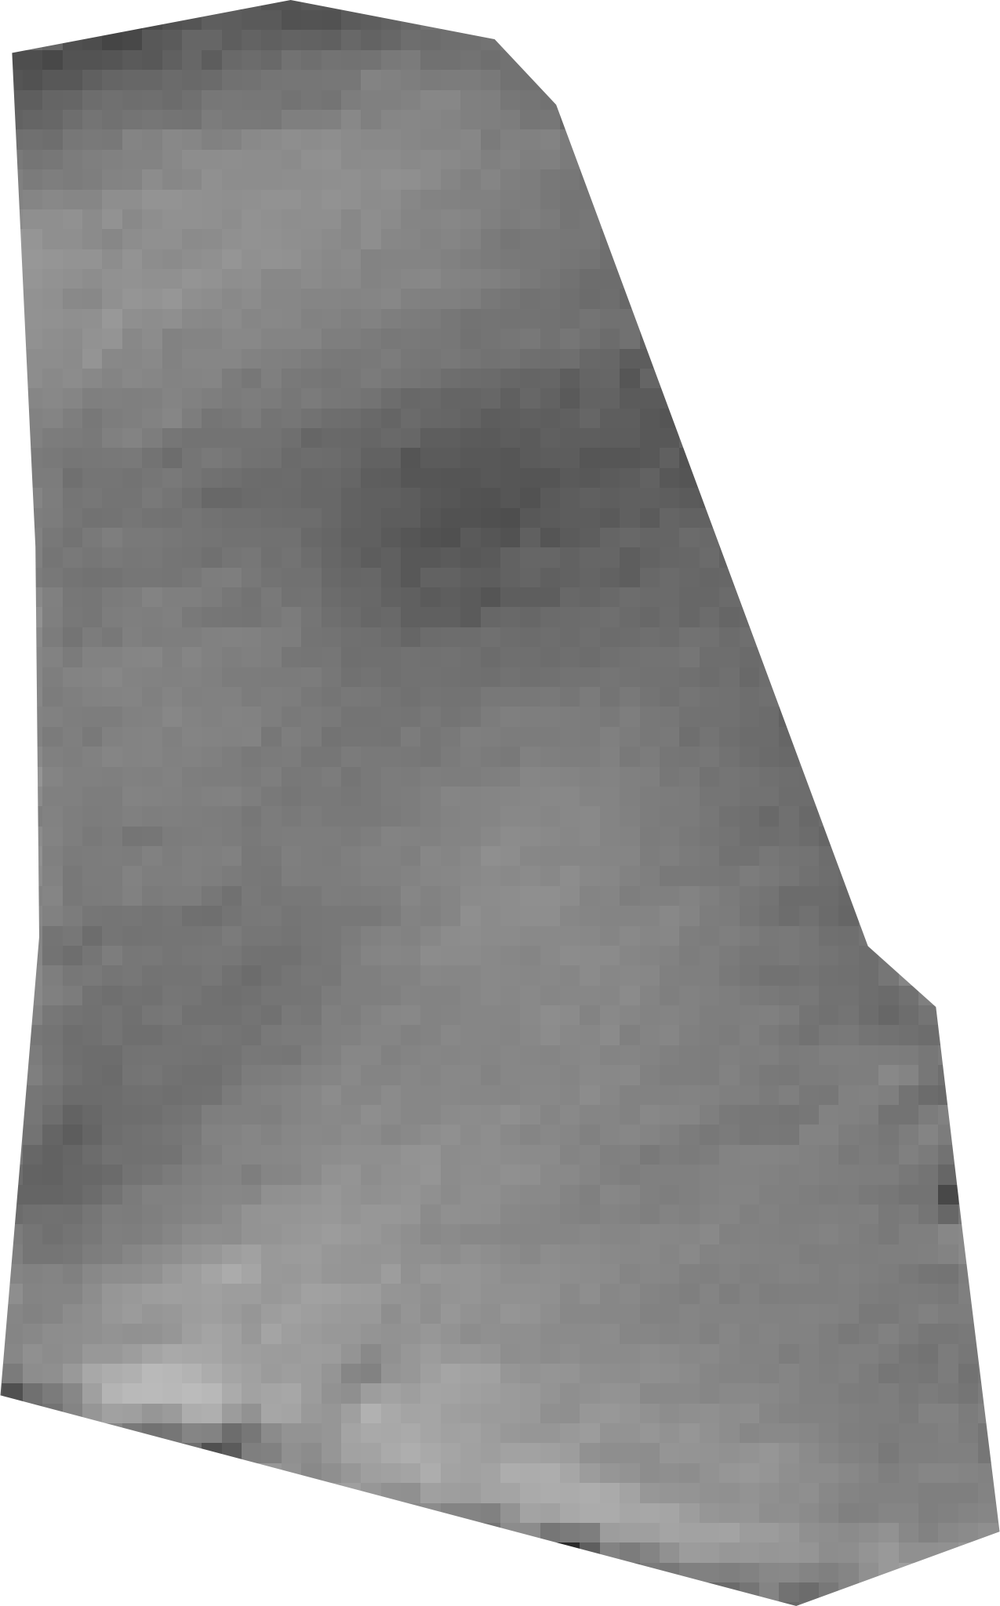 | Area: 1.2 ha Centroid: 50.4550° N, 3.6933° W Elevation (mean): 51 m Slope (mean): 6.2° Dominant aspect: W Topographic Wetness Index: 19.2 Landform: Flat 5% · Ridge 95% · Valley 0% Dominant Keyline Zone: 2 |
Ridge 95% |
Landform composition (proportion of parcel area)
A ridge-top field carrying its land health well
Old Brown's Field sits at Land Health Score 6, comfortably inside the recovering band and tracking close to the site average for the grassland parcels. The four processes line up in a pattern that is familiar across the property: water cycling is the strongest leg, mineral cycling is solid, energy capture sits a step behind, and species diversity is the rate-limiting process. Water Cycle reads 86 percent, Mineral Cycle 76 percent, Energy Flow 72 percent, and Community Dynamics 61 percent. None of those are alarming. The pattern simply tells you where the next gains will come from. What makes this field interesting is its position in the landscape. Ninety-five percent of the parcel sits on ridge ground, with effectively no valley floor and only a sliver classed as flat. It faces south with a moderate slope (6.2 percent). Most of the field falls into Keyline Zone 2 (the cultivation zone above the keypoint) with a meaningful catchment strip (23 percent in Zone 1) along the upper edge. For a ridge field on a south aspect to be holding Water Cycle at 86 percent is a genuinely good result. Ridges shed water; south aspects warm and dry first. The fact that this field is retaining and cycling moisture as well as it is points to good ground cover and a functioning root profile.
Energy capture is the headroom, diversity is the lever
Energy Flow at 72 percent is the lower of the two productive processes, and on a south-facing ridge that warms early and grows long, you would expect this number to be higher than it is. The radar structure reading (HV at -18.4 dB) sits in the moderate-density range for grassland, indicating the sward has body but is not at its structural ceiling. There is real headroom here. The mechanism that will close that gap is almost certainly diversity. Community Dynamics at 61 percent is the limiting process, and on this field type (warm aspect, ridge position, good water cycle) a more diverse sward would extend the photosynthetic window into the shoulder seasons and lift Energy Flow with it. The good news is that the holistic remediation hierarchy applies cleanly here. This field does not need purchased seed. Rest timed around flowering, deferred grazing to allow existing species to set and drop seed, and a high-density mob pass to trample litter and seed into contact with the soil will do most of the work. If a neighbouring paddock with stronger diversity (Peter Rabbit's Patch at Community Dynamics 68 is the obvious donor on this property) is cut for hay with ripe seed heads, that hay spread and trampled on Old Brown's Field is the second move. Purchased seed is the last resort, not the first.
Seasonal pattern and what to watch
The weekly tracking through 2025 shows the field cycling through a healthy seasonal pattern with a clear peak in late spring and a softer shoulder through summer. The summer was a moderately stressed growing season (three weeks of stress, four optimal weeks, growing-season rainfall 348 mm against a property average closer to 390 mm), so the slight softening of Energy Flow relative to the site's best ridge fields is partly weather-driven. The ridge position and south aspect amplify that signal. In a wetter year (2024 delivered 486 mm and nine optimal weeks across the property) this field should show measurably stronger Energy Flow. The trajectory to watch over the next two assessment cycles is whether Community Dynamics moves off 61 toward the high-60s that the strongest grassland parcels on this property are holding. If it does, expect Energy Flow to follow within a year. If diversity stays flat, the field will remain a solid Score 6 performer but will not push into Score 7 territory. The carbon flux signal (a net uptake of 6.1 tonnes CO2-equivalent per hectare per year) is consistent with a working pasture building modest productive capital, and there is no sign of carbon loss to flag.
Old MacDonald's Farmyard
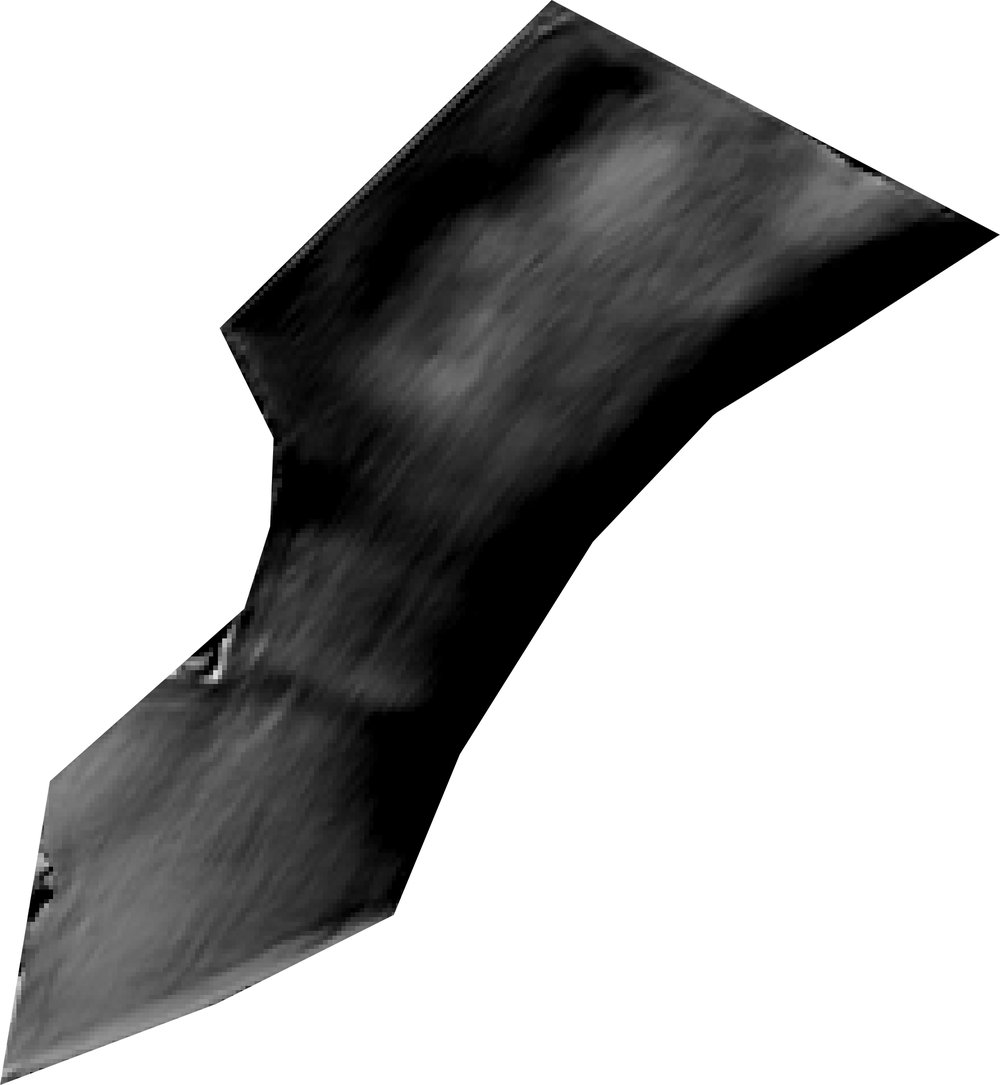 | Area: 7.7 ha Centroid: 50.4555° N, 3.6978° W Elevation (mean): 50 m Slope (mean): 4.8° Dominant aspect: W Topographic Wetness Index: 15.0 Landform: Flat 40% · Ridge 17% · Valley 42% Dominant Keyline Zone: 2 |
Flat 40% | Ridge 17% | Valley 42% |
Landform composition (proportion of parcel area)
The farmstead is correctly read as infrastructure, not pasture
Old MacDonald's Farmyard is the working heart of the property: buildings, hardstanding, parking, sheds, and the immediate yard around them. The assessment treats it as a productive grassland parcel because it sits inside the holding boundary, but the ground signal is overwhelmingly built surface and compacted track rather than living sward. Everything that follows should be read in that light. The low scores here are an accurate reading of what infrastructure looks like to a vegetation-focused assessment, and they do not reflect anything you are doing wrong. The Land Health Score sits at 3 (high) for the parcel, with all four processes weakening together: water cycling at 68 percent, energy capture at 41 percent, mineral cycling at 42 percent, and species diversity at 35 percent. On a pasture field these numbers would be a serious concern. On a farmyard they are the expected signature of a surface that is meant to shed water, carry vehicles, and stay clear of vegetation for operational reasons. The radar reading (HV at -18.8 dB, HH at -11.4 dB) is consistent with sparse, broken vegetation interspersed with hard surfaces, again exactly what a yard looks like from above.
The interesting signal is the wet-but-thin contradiction
One thing worth flagging, because it tells you something useful about the yard's hydrology, is the combination of a relatively high Topographic Wetness Index (15.0) with a westerly aspect and 42 percent of the parcel sitting in valley position. This is ground that wants to collect water. The Water Cycle reading of 68 percent, the highest of the four processes here, confirms that water is arriving and lingering. The fact that energy capture and species diversity are both very low while water is comparatively present is the classic signature of compaction: water sits on or just under the surface rather than infiltrating cleanly into a living root zone, because the root zone has been crushed out by traffic and standing. This matters because farmyards are often the single largest point source of sediment, nutrient, and hydrocarbon runoff on a holding. The fact that this yard sits in a water-collecting position on a westerly slope means whatever leaves the hardstanding (silage effluent, slurry tracking, fuel drips, manure-laden runoff from the collecting yard) is being concentrated and carried downslope rather than dispersed.
What to watch and what to consider
There is no remediation needed for the yard as agricultural ground, that is not what it is for. The useful question is whether the yard's runoff is being captured before it leaves the holding. A simple walk after heavy rain, tracing where water exits the hardstanding and where it goes next, will tell you more than any remote indicator. Common interventions where this matters are a sediment trap or reed-bed swale on the downslope exit, a planted buffer strip below the yard, or rainwater capture off shed roofs to reduce the volume hitting the yard surface in the first place. The other thing worth noting is that the parcel does carry a positive carbon flux reading of +6.1 tCO2e per hectare per year, but this is a modelled site-wide value applied to the parcel rather than a measurement of what the yard itself is doing. Treat the farmyard's carbon line as not meaningful at the parcel level, and read the carbon story from the productive fields instead. The next assessment cycle will continue to show low scores for this parcel and that is the correct reading; no trend interpretation should be drawn from year-to-year movement on the yard itself.
Old Mother Hubbard's Field
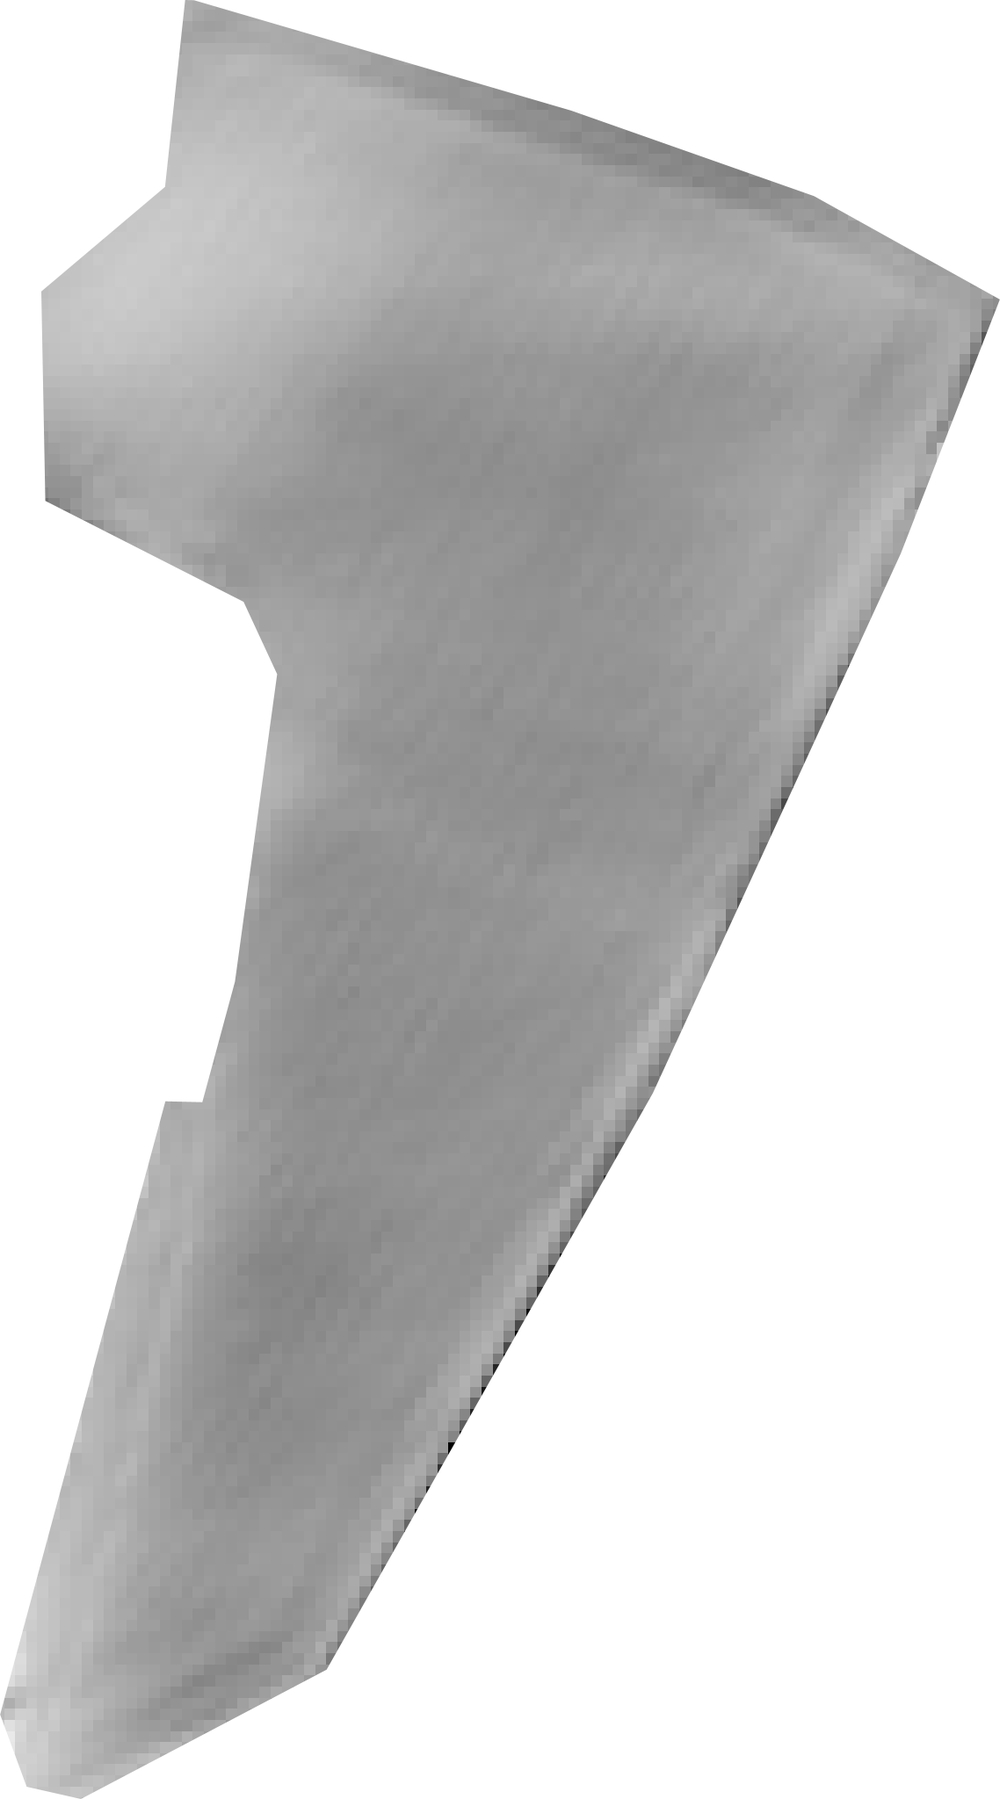 | Area: 3.0 ha Centroid: 50.4520° N, 3.6866° W Elevation (mean): 65 m Slope (mean): 7.7° Dominant aspect: E Topographic Wetness Index: 14.3 Landform: Flat 34% · Ridge 63% · Valley 3% Dominant Keyline Zone: 2 |
Flat 34% | Ridge 63% |
Landform composition (proportion of parcel area)
Old Mother Hubbard's Field is one of the higher-elevation parcels on the property, sitting at 65 metres on a distinctly east-facing ridge. Nearly two thirds of the field is classed as ridge ground, with only a sliver of valley floor, and the slope averages 7.7 percent. This is one of the most exposed parcels in the rotation, which gives it a particular character: it drains quickly, it warms early in spring, and it loses moisture faster than the valley fields when the weather turns dry. The Land Health Score sits at 6 (low) for the 2025 assessment, placing this parcel in the recovering band and broadly in the middle of the property's grassland fields.
Water cycling is the strongest process here
Water cycle function on this field is in good shape, which is the headline finding worth holding onto. Despite the ridge position and faster drainage, the Water Cycle Index reads 90 percent, meaning rainfall is infiltrating and being held in the profile rather than running off the slope. The Topographic Wetness Index of 14.3 is the lowest end of the property's range, exactly what you would expect for a ridge, so the high water score is a genuine indicator of soil structure doing its job rather than the field simply sitting in a wet position. On a 7.7 percent east-facing slope this is the outcome you want.
Energy capture and species diversity are the two levers
The Energy Flow Index reads 72 percent and the Community Dynamics Index reads 61 percent, with mineral cycling sitting at 76 percent in between. These are sound numbers for a working pasture, and the radar structural reading of -20.8 dB cross-polarised backscatter sits in the moderate range typical of a grazed sward with reasonable standing biomass. The pattern across the four processes is balanced rather than showing a single sharp constraint. Community diversity is the lower of the four, which is the common signature on managed pastures across this property and reflects the species pool that has had time to express under the current grazing pattern. Energy capture has headroom too, particularly given the east-facing aspect that warms early.
Aspect and ridge position open specific management opportunities
The east-facing ridge position gives Old Mother Hubbard's Field a useful role in the spring rotation. East-facing ground catches morning sun, dries dew earlier, and greens up ahead of the north-facing parcels on the property. This makes it a natural early-season grazing field that takes pressure off slower-warming ground. The trade-off is summer water stress: ridges with this aspect lose moisture first when stress weeks arrive, and 2025 carried three stress weeks against four optimal weeks, a drier-than-average season for the property. The Water Cycle Index holding at 90 percent through that season is genuinely encouraging and suggests the soil profile is buffering the exposure well. Worth watching in the next assessment is whether community diversity ticks up if recovery periods are extended, and whether the standing biomass reading on the radar channel rises through the season as canopy density builds. Both would be expected responses to longer rest between grazings on a ridge field of this character.
Peter Rabbit's Patch
 | Area: 0.9 ha Centroid: 50.4487° N, 3.7087° W Elevation (mean): 57 m Slope (mean): 4.5° Dominant aspect: N Topographic Wetness Index: 15.1 Landform: Flat 20% · Ridge 14% · Valley 66% Dominant Keyline Zone: 2 |
Flat 20% | Ridge 14% | Valley 66% |
Landform composition (proportion of parcel area)
Peter Rabbit's Patch is the highest-scoring grassland parcel on the property, sitting at Land Health Score 7 with all four ecosystem processes working in concert. Water cycling, energy capture, mineral cycling, and species diversity are each performing at or near their reference range for a non-brittle Devon pasture, which is what produces a top-band score rather than any single standout reading. The parcel sits on a north-facing valley position at 57 metres elevation with a gentle 4.5 percent slope, giving it the moisture-retaining aspect and gradient that suit perennial pasture in this climate. The result is a field that is delivering consistently across the board: Water Cycle Index of 91 percent, Energy Flow Index of 78 percent, Mineral Cycle Index of 82 percent, and Community Dynamics Index of 68 percent.
The north-facing valley position is doing most of the work
The landscape position explains much of the strength here. Two-thirds of the parcel sits in valley bottom with the remaining third on flat ground, and the entire field falls within Keyline Zone 2 (the productive valley shoulder where water accumulates but does not pool). The Topographic Wetness Index of 15.1 confirms reliable moisture availability without waterlogging, and the north-facing aspect reduces evaporative demand through the summer months. In a year like 2025 with three weeks of stress and only four optimal weeks, that moisture buffer matters: while drier south-facing parcels lower in the ranking dropped their Water Cycle Index toward the high seventies, Peter Rabbit's Patch held at 91 percent. This is a field that should be your most resilient pasture in dry years and one of the first to recover after any stress event.
Community diversity is the headroom worth working on
Of the four processes, species diversity at 68 percent is the one with the most room to develop, though even this sits comfortably above the threshold where the diagnostic matrix would flag it as a constraint. The pattern is typical of a well-managed permanent pasture: water, energy, and minerals are cycling strongly, and the plant community is healthy but not yet expressing its full potential range of species. The internal weekly readings show the parcel cycling through a broad seasonal range (peaking strongly in growth periods and resting in winter), which is the signature of a responsive sward. The first lever here is rest rather than seed: extending recovery periods by a week or two on the next rotation through this field would allow more of the existing species pool to flower and set seed, and any species-rich hay you cut elsewhere on the farm would establish well if spread and trampled in here.
Watch this field as your reference parcel
Because Peter Rabbit's Patch is currently your strongest grassland, it makes a useful internal reference for tracking how the rest of the property progresses. The carbon balance sits at the property's standard grassland figure of around six tonnes of carbon dioxide equivalent per hectare per year, with gross photosynthesis comfortably exceeding ecosystem respiration. The radar structural reading (HV at -17.9 dB) places it in the dense-pasture band, consistent with the high Energy Flow Index reading and indicating a sward with real physical biomass rather than thin green cover. Over the next assessment cycle, the trajectory to watch is whether species diversity continues to lift toward the mid-seventies, which would push this parcel into Land Health Score 8 territory and confirm that the management approach being applied here is the template for the rest of the grassland holdings.
Piglet's Patch
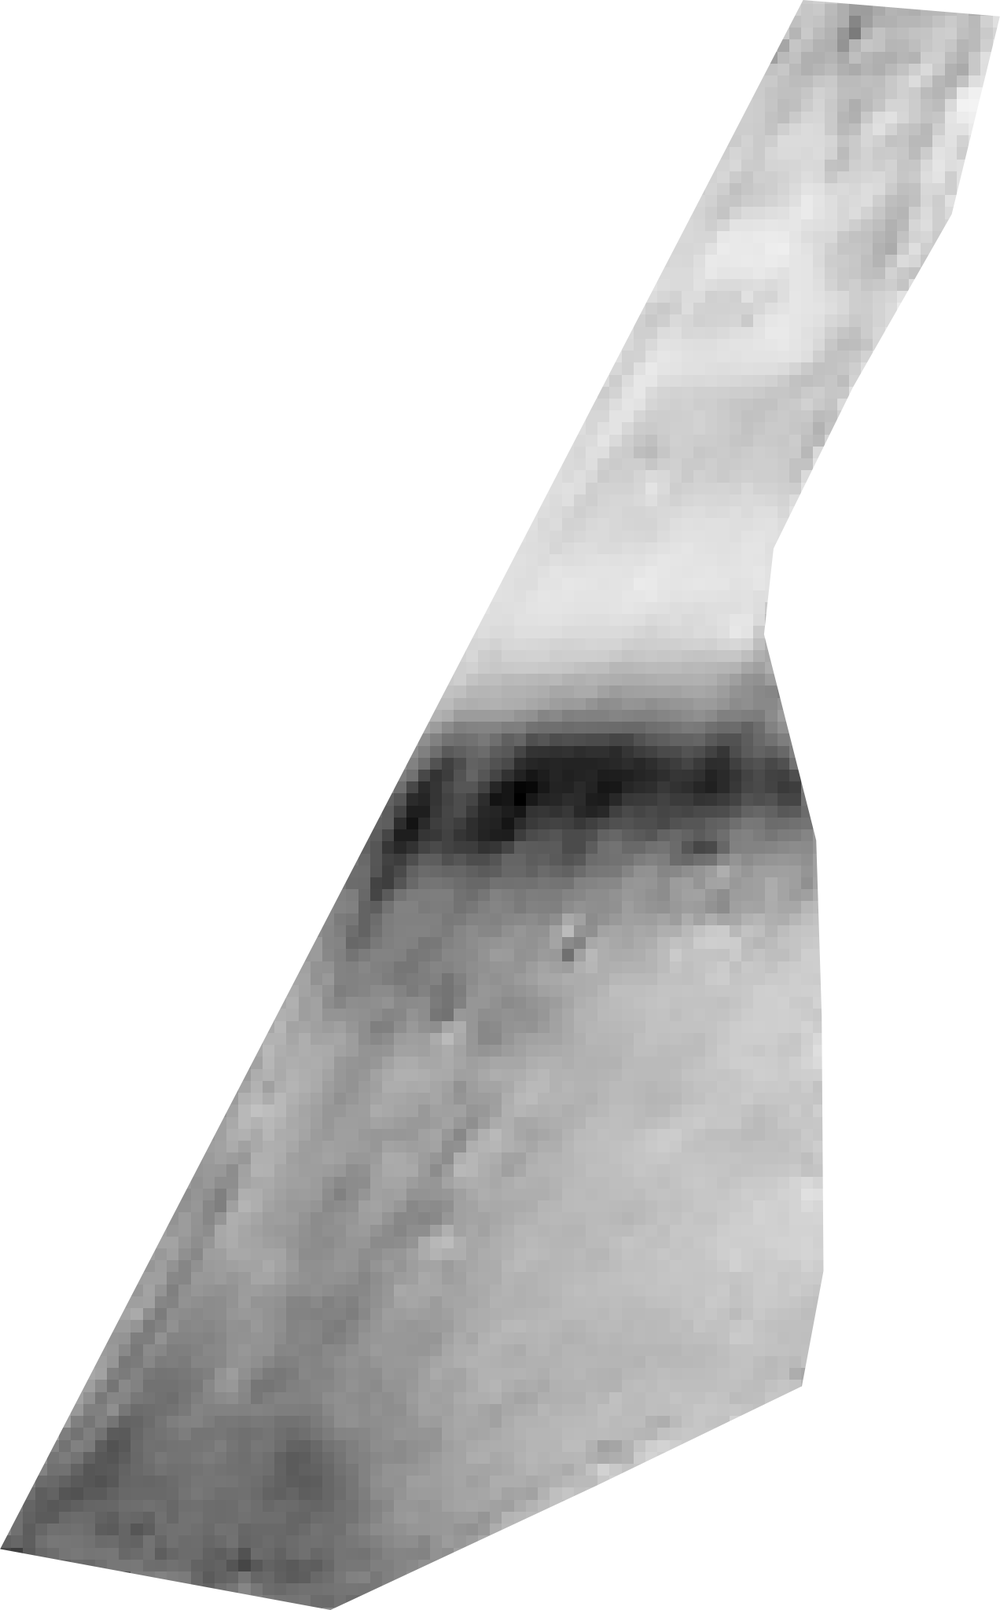 | Area: 1.9 ha Centroid: 50.4454° N, 3.6924° W Elevation (mean): 34 m Slope (mean): 12.0° Dominant aspect: E Topographic Wetness Index: 17.8 Landform: Flat 46% · Ridge 9% · Valley 45% Dominant Keyline Zone: 2 |
Flat 46% | Valley 45% |
Landform composition (proportion of parcel area)
Water is doing the heavy lifting here
Piglet's Patch is functioning well overall, with water cycling clearly the strongest process and species diversity the constraint to watch. The field carries a Land Health Score 5 (mid), placing it in the transitional band where most of Wilder Wood's grassland sits. Water Cycle Index of 89 percent confirms that rainfall is infiltrating and being held in the profile rather than running off, which matters on this parcel because it carries the steepest ground on the property: 12 percent average slope, with 29 percent of the field classified as steep terrain. On east-facing ground that drops into a valley position (45 percent of the field), the fact that water is being captured rather than shed is a real achievement and reflects the underlying ground cover and root structure doing their job.
Energy capture and mineral cycling sit mid-band
Photosynthesis and nutrient cycling are both operating in the middle of their working range. Energy Flow Index of 70 percent and Mineral Cycle Index of 70 percent are honest, working numbers for a transitional pasture in the Devon climate. Radar structure of -17.1 dB HV backscatter places Piglet's Patch in the moderate-density grassland band, broadly consistent with the visible neighbours along the valley line (Poohsticks Bridge at -15.8 dB carries more standing biomass, Tigger's Bouncing at -19.8 dB rather less). The growing season delivered a fair test this year, with 348 mm of rainfall and only three stress weeks, so these mid-band readings reflect the field's current management state rather than weather pressure.
Species diversity is the limiting process
The single clearest signal in this field is community dynamics, where the Community Diversity Index of 56 percent is the lowest of the four processes and the place where the next gains are sitting. In plain terms, the sward is functional but the species pool is thinner than it could be, and that thinness is what holds the overall Score below the recovering band. The good news is that the building blocks are already in place: water is excellent, mineral cycling is adequate, and the field is taking carbon out of the atmosphere at 6.1 tonnes CO2-equivalent per hectare per year. None of those things would be true if the system were genuinely struggling. Diversity is the lever, and the conditions for it to respond are there.
What to do, in order
The remediation hierarchy for community dynamics on a field like this starts with rest and works outward. The first move is to extend recovery periods through next spring and early summer, giving the species already present a chance to flower, set seed, and self-seed into the gaps. The second is to use high-density, short-duration grazing impact to trample ripe seed into the soil surface when the time comes. If after one or two seasons of that the diversity needle has not moved, the third step is on-farm seed transfer: cut hay from one of your more diverse paddocks (Peter Rabbit's Patch sits at the top of the property for CDI at 68 percent and would be a sensible donor) when its seed heads are ripe, and spread that material onto Piglet's Patch with livestock to trample it in. Purchased seed should remain a last resort. The steep east-facing aspect means Piglet's Patch will green up reasonably early in spring, so it fits naturally into the front end of the rotation, with the caveat that the 29 percent steep ground needs careful stock management to avoid pugging on wet days. Worth watching over the next two assessment cycles: whether the Community Diversity Index lifts toward the high 60s, which would carry the whole Score into the recovering band.
Pigling Bland's Pasture
 | Area: 3.3 ha Centroid: 50.4584° N, 3.6951° W Elevation (mean): 26 m Slope (mean): 3.2° Dominant aspect: E Topographic Wetness Index: 17.7 Landform: Flat 48% · Ridge 6% · Valley 46% Dominant Keyline Zone: 3 |
Flat 48% | Valley 46% |
Landform composition (proportion of parcel area)
Pigling Bland's Pasture is a solid mid-table performer on the property, sitting in the recovering band where most of the grazing platform lives. The field's Land Health Score 6 (mid) reflects a piece of land where the four ecosystem processes are all functioning together, with no single process having collapsed and dragged the others down with it. For a non-brittle Devon pasture in a year that delivered a fair test of weather, this is the trajectory you want to see.
Water cycling is the strongest process on this field
The field holds and uses rainfall well. Water Cycle Index of 86 percent puts it firmly in the functional range, though it sits a few points below the property's strongest water performers (Wee Willie Winkie's Meadow and Mary's Garden both at 92 percent). The topography explains why this field does well on water: it sits low in the landscape at 26 metres elevation with a Topographic Wetness Index of 17.7, which is one of the wetter signatures on the property. Roughly half the field is mapped as flat ground and another 46 percent as valley position, with only 6 percent on ridge. Water arrives here from upslope and lingers. The structural reading from radar (HV backscatter of -17.7 dB) is consistent with healthy grass sward carrying good standing biomass into late season, which is what supports the infiltration rates implied by the water score.
Energy capture is the limiting process, as it is across most of the grazing platform
Energy Flow Index of 74 percent is the lowest of the four processes on this field, and the same pattern shows up on almost every grassland parcel at Wilder Wood. This is a property-wide signature rather than something specific to Pigling Bland's Pasture. The field captures sunlight and converts it to plant growth at a level that is good for a temperate pasture, but there is genuine headroom here. The likely route to lifting energy capture is the same as on neighbouring fields: longer recovery periods between grazings to let the sward reach fuller leaf area before the next bite, and attention to any patches where bare ground or short-cropped areas are limiting total photosynthetic surface. Given that 2025 delivered a slightly drier-than-average growing season with three stress weeks and only four optimal weeks (compared with nine optimal weeks in 2024), some of the energy ceiling this year is weather-driven rather than management-driven.
Mineral cycling and community diversity are both functional but not yet at the property's ceiling
Mineral Cycle Index of 78 percent and Community Dynamics Index of 63 percent are both in the healthy working range. Mineral cycling is the second-strongest process on this field, which suggests litter and dung are incorporating reasonably well — the wetter valley position helps biological decay run consistently, and on a non-brittle site like this one (brittleness 3.4) rest periods generally aid the mineral cycle rather than letting material oxidise on the stem. Community diversity at 63 percent is the second-weakest process and matches the property pattern where species mix tends to follow energy flow upward over time. The best grassland parcels on the property reach 68 percent on diversity (Peter Rabbit's Patch), so the headroom on Pigling Bland's Pasture is real but not large. The standard recovery-led approach applies here: extend rest where you can, defer the field through a full seed-set window at least once in the next two seasons, and let the species already present express themselves before considering any seed transfer from your stronger paddocks.
What to watch in the next assessment cycle
The trajectory to watch is whether energy flow rebuilds back toward the high-70s range that the strongest paddocks have reached, particularly if 2026 delivers a kinder rainfall distribution. Water cycling on this field is doing its job and is unlikely to be a constraint in the medium term. The main question is whether grazing management can lift the energy ceiling another five to eight points, which would in turn pull community diversity along behind it. This is a field where small adjustments to recovery periods should produce visible movement in the score over two to three seasons.
Pooh Corner Meadow
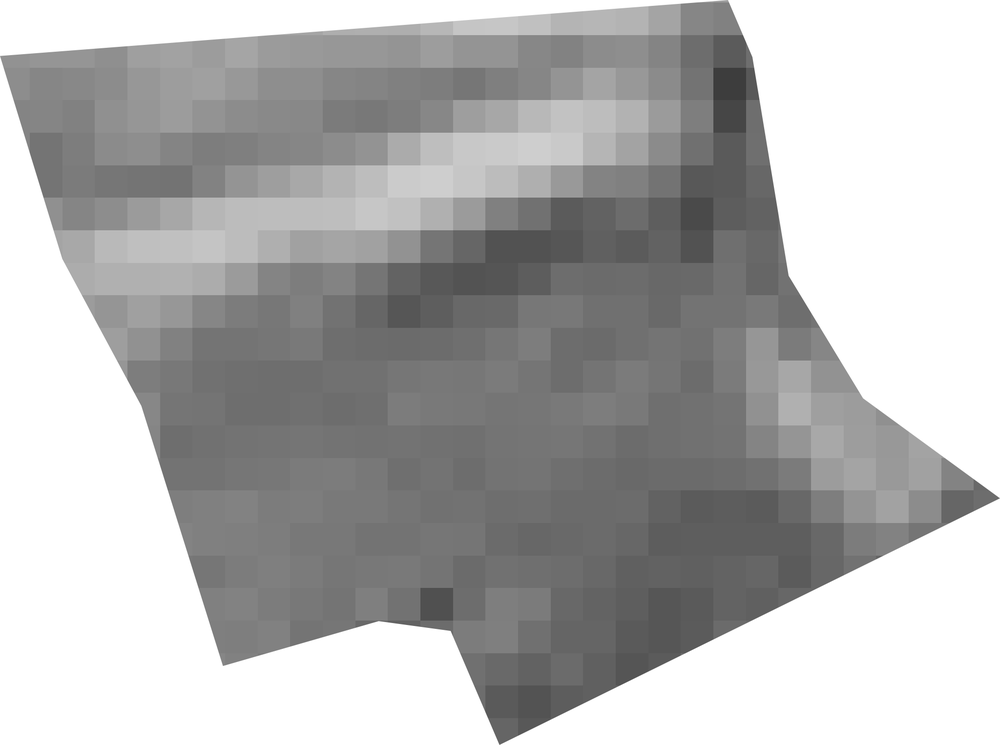 | Area: 0.2 ha Centroid: 50.4513° N, 3.7087° W Elevation (mean): 22 m Slope (mean): 11.2° Dominant aspect: E Topographic Wetness Index: 14.0 Landform: Flat 39% · Ridge 42% · Valley 18% Dominant Keyline Zone: 1 |
Flat 39% | Ridge 42% | Valley 18% |
Landform composition (proportion of parcel area)
A solid mid-range field with one clear constraint
Pooh Corner Meadow is functioning as a competent working pasture with Land Health Score 5 (high), sitting near the top of its band at 61.2 percent. Water cycling and energy capture are both in good shape for a field of this character. The constraint to focus on is species diversity, where the Community Dynamics Index (CDI) reads 58 percent. Mineral cycling at 69 percent is also lagging the strongest fields on the property. These two together suggest the biological side of the field has room to catch up with what the water and sunlight are already delivering.
Position on the land shapes how this field behaves
This is an east-facing field on noticeably steeper ground than most of the property, with slopes averaging 11.2 percent and a meaningful ridge presence. Forty-two percent of the field sits on ridge, eighteen percent in valley, and the rest on flat shoulder ground. The Keyline Zone reading shows over a third in the upper catchment (KZ1), with the remainder spread through the ridgeline shedding zone (KZ2). That means the field is primarily a water-shedding position, not a water-receiving one. The Topographic Wetness Index (TWI) of 14.0 is the lowest on the property by a clear margin, which confirms what the slope and ridge data already suggest: water moves through here, it does not pool. The fact that the Water Cycle Index (WCI) still reads a healthy 85 percent on a fast-shedding ridge field is genuinely good news. The ground cover and root structure are doing their job of slowing and infiltrating rainfall before it leaves the field.
The radar tells an interesting story
The structural biomass reading on this field is unusually high, with HV at -16.4 dB and HH at -4.2 dB. Both are among the densest signals on the grassland parcels. That points to a thick, structurally complex sward, possibly with rougher tussocky growth, standing dead material, or a coarser species mix than the more uniform pasture fields. Combined with the moderate Energy Flow Index (EFI) of 75 percent and the lagging mineral cycling reading, this is consistent with a field carrying more thatch than the system is currently breaking down. On non-brittle ground like this, thatch accumulation suppresses both mineral turnover and species expression. Litter sits on the surface, smothers low-growing diversity, and ties up nutrients in slow-decay biomass rather than feeding them back into the soil.
What this means for the next year
The headline finding is that water and energy are working; the biological cycle is the bottleneck. The most useful intervention is also the cheapest: a higher-impact grazing event that knocks down the standing material, treads it into contact with the soil, and resets the sward. On a ridge field with good drainage and east-facing aspect, this can be done relatively early in the season without poaching risk. A single mob-grazing pass at higher stock density, followed by an extended rest of 60 to 90 days, is the kind of action that typically lifts both mineral cycling and community diversity together on fields with this signature. If the rougher species composition is in fact diverse already (worth a walk to confirm), then a deferred grazing window later in the season to allow seed set would compound the gain. Worth checking on the ground whether the structural density visible in the radar is coarse uniform grass or a richer mixed sward; the answer changes which lever to pull first, but in either case the rest-then-impact-then-rest sequence is the right starting move.
Poohsticks Bridge
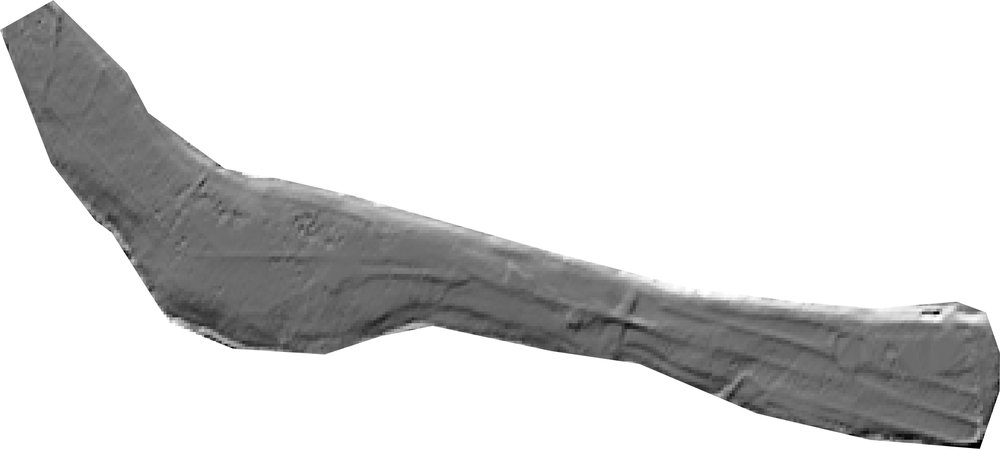 | Area: 6.1 ha Centroid: 50.4422° N, 3.6977° W Elevation (mean): 30 m Slope (mean): 13.9° Dominant aspect: S Topographic Wetness Index: 18.3 Landform: Flat 15% · Ridge 39% · Valley 47% Dominant Keyline Zone: 2 |
Flat 15% | Ridge 39% | Valley 47% |
Landform composition (proportion of parcel area)
A south-facing, steep-sided field that punches above its slope class
Poohsticks Bridge is one of the more dramatic pieces of ground on the property, a south-facing field with the steepest slope reading on the farm and well over a third of its area classified as steep terrain. Despite that, the field is functioning solidly. The Land Health Score sits at 6 (mid), placing it firmly in the recovering band and ahead of most fields on the property by a comfortable margin. For a parcel where roughly four-tenths of the area is ridge and nearly half is valley, that level of function reflects real management skill: this is the kind of topography where most farms would be watching scores erode, and here they are not. The headline reading is water cycling at 91 percent, mineral cycling at 81, energy flow at 76, and community at 65. The shape of those four numbers tells a clear story. Water capture and nutrient turnover are doing the heavy lifting, energy capture is sound but with headroom above it, and species diversity is the process furthest from its potential. None of these are problems in the usual sense; they describe a field that has built the foundations and is now waiting for the biology on top to catch up.
Water cycling is the standout result given the slope
Holding water on a south-facing 14 percent slope with a third of the parcel classed as steep is genuinely difficult, and the Water Cycle Index of 91 percent suggests the field is doing it. South aspect means high solar load and faster drying after rain, yet the Topographic Wetness Index of 18.3 indicates the landscape itself is funnelling moisture into the parcel from upslope. The ridge-and-valley split (39 percent ridge, 47 percent valley) creates internal flow paths that the management has clearly worked with rather than against. Radar structure of -15.8 dB HV is on the denser end for grassland on this property, which is consistent with a well-vegetated, structurally robust sward holding rainfall on the surface long enough to infiltrate. The implication is that the keyline-zone position of this field, with 18 percent in the catchment zone and the bulk in the ridgeline zone, is being used effectively. Water arriving at the top of the parcel is being slowed, spread, and sunk before it can run off the steep faces. This is exactly the function you want from a field in this landscape position.
Species diversity is the process with most headroom
Community dynamics at 65 percent is the lowest of the four process scores and the place where Poohsticks Bridge has most room to grow. In a non-brittle climate like Devon's, with this year's growing season bringing 348 mm of rain and only three stress weeks, diversity gains do not require dramatic intervention. The conditions are forgiving. What they require is time and the right grazing pattern. The hierarchy of action here starts with rest. Extending the recovery interval between grazings on this field, particularly through the May to July seed-set window, will let whatever species are present express, flower, and self-seed. The steeper portions of the field, which are harder to graze evenly anyway, are natural candidates for being deferred entirely in one out of every three or four rotations. Beyond rest, mob-style high-density grazing followed by long recovery is the second lever: dense impact for a short window tramples seed into contact with soil and breaks any selective pressure that has been narrowing the species mix. Bringing seed-rich hay cut from the more diverse paddocks on the property and rolling it across this field with stock is a third move, well ahead of any purchased seed.
What to watch in the next cycle
Energy flow at 76 percent has room to climb as the canopy thickens and the growing season lengthens, and it should follow the community gains as diversity builds. The trajectory to watch over the next two to three assessments is whether community closes the gap to mineral cycling. If diversity rises into the 70s while water and minerals hold their ground, this field moves into the high recovering band and becomes one of the stronger parcels on the property. The south aspect and the slope mean drought years (2025 brought three stress weeks; 2018 brought three; 2022 brought four) will test the water cycle here first, so monitoring how the Water Cycle Index holds in a dry summer is the early-warning signal worth tracking.
Rabbit's Bottom Field
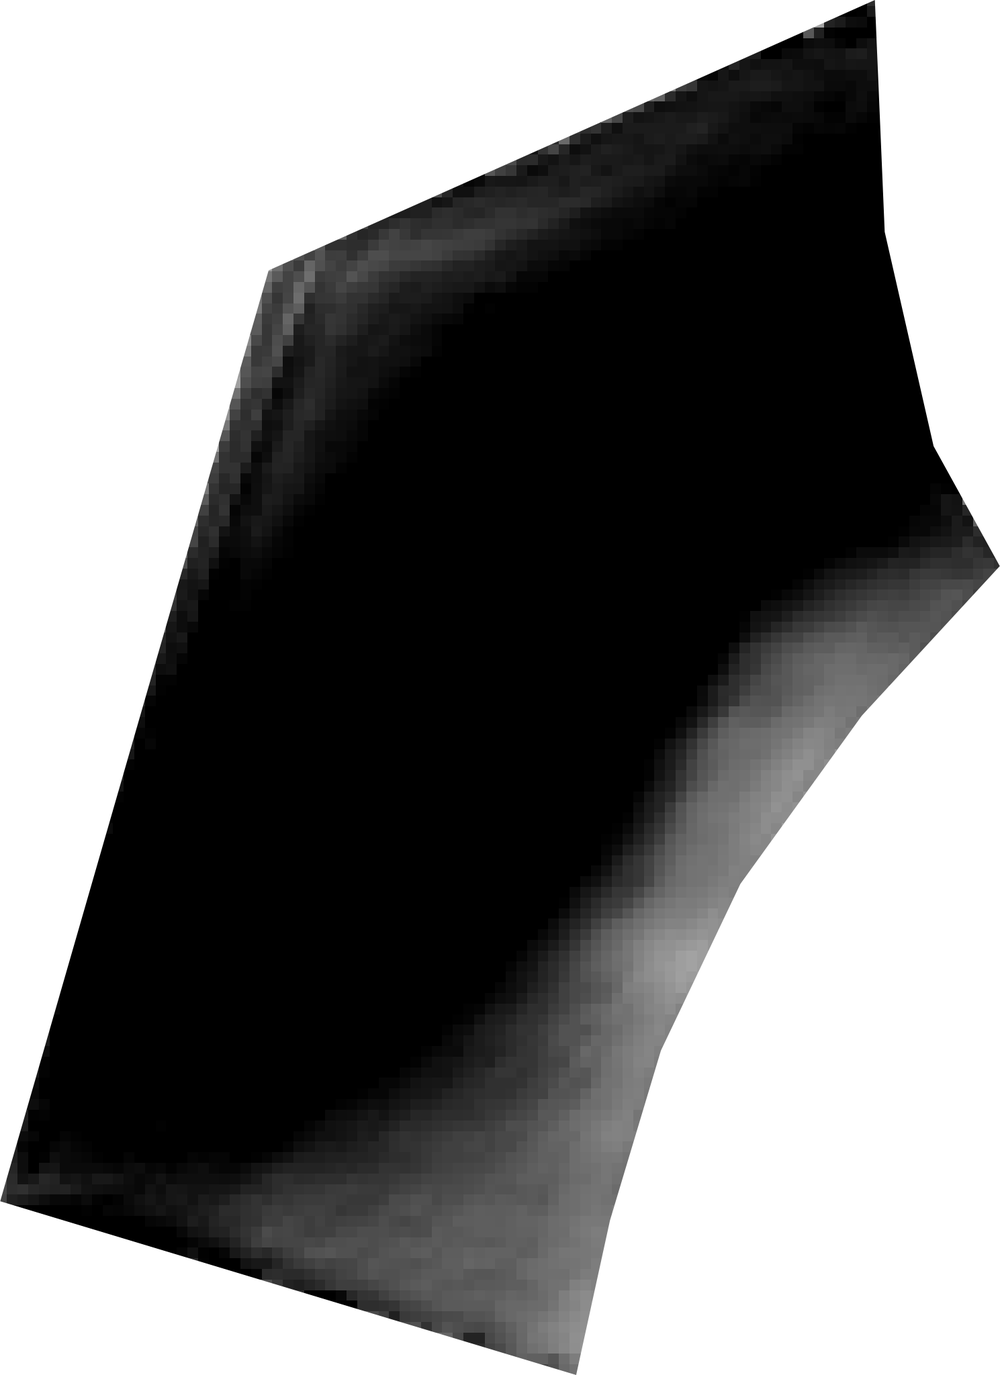 | Area: 2.7 ha Centroid: 50.4525° N, 3.6993° W Elevation (mean): 27 m Slope (mean): 7.9° Dominant aspect: E Topographic Wetness Index: 15.0 Landform: Flat 15% · Ridge 17% · Valley 68% Dominant Keyline Zone: 3 |
Flat 15% | Ridge 17% | Valley 68% |
Landform composition (proportion of parcel area)
Water and minerals are doing the heavy lifting
Rabbit's Bottom Field is functioning well overall, with the four ecosystem processes telling a coherent story about where the land's strengths lie and where attention would pay off. Water cycling is the clear leader on this parcel, with a Water Cycle Index of 86 percent indicating that rainfall is infiltrating, being held in the profile, and supporting plant growth through the year rather than running off or evaporating. Mineral cycling follows at 77 percent, which sits in the healthy range for a working pasture on this kind of valley-bottom ground. The field's overall Land Health Score 6 (mid) places it solidly in the recovering band, and the trajectory of the wider site (a holding pattern in Score 5 territory with one strong year in 2023) suggests this parcel is moving with the rest of the property rather than against it.
Energy capture is the constraint
The lagging process here is energy flow, sitting at 71 percent. That is not a low number in absolute terms, but it is the lowest of the four processes on this field and the gap is the diagnostic signal worth reading. The radar structure backs this up: the canopy volume reading of -21.8 dB HV is on the thinner side of what this site shows, which means the sward is not building the standing biomass it could given the water and minerals available. In plain language, the grass and herbs growing here are not converting as much sunlight into plant tissue as the underlying conditions would support. The Community Dynamics score of 61 percent points the same way, with species diversity sitting modestly below where it could be.
The valley position explains a lot
Sixty-eight percent of this field sits in valley landform, with very little ridge influence and a Topographic Wetness Index of 15.0 indicating a moderately moist hydrological position. The Keyline zone breakdown shows the field split between mid-slope ridge-flow (38 percent) and lower-slope valley-flow (39 percent) zones, which is a productive position for a grassland: water is moving through rather than ponding, and minerals are being delivered from upslope. The eastern aspect means morning sun and afternoon shade, which keeps the field cooler and moister in summer than a south-facing equivalent would be. That hydrological richness is what is driving the strong water and mineral scores. It also means the energy-flow gap is unlikely to be a moisture problem, the constraint is more likely about how the sward is being managed: rest length, grazing intensity, or the diversity of plants present to capture light across the full growing season.
What to watch and what to try
The 2025 growing season was on the drier side for this site (348 mm, three stress weeks) following an exceptional 2024 (486 mm, zero stress weeks). The dip in the site-wide Score from band 6 in 2023 back to band 5 in 2025 likely reflects that weather swing rather than any management drift. For Rabbit's Bottom Field specifically, the highest-leverage move is on the energy-capture side. Following the holistic management hierarchy, the first step is to extend the recovery period between grazings so the sward has time to put on full leaf area and complete its photosynthesis cycle before being defoliated again. If a single full-season deferral is feasible on this parcel, that alone often lifts both Energy Flow and Community Dynamics together as existing species express, flower, and self-seed. The water and mineral foundations are already in place to support a fuller, more diverse sward, the limiting factor is giving the plants the time to build it.
Rabbit's Top Field
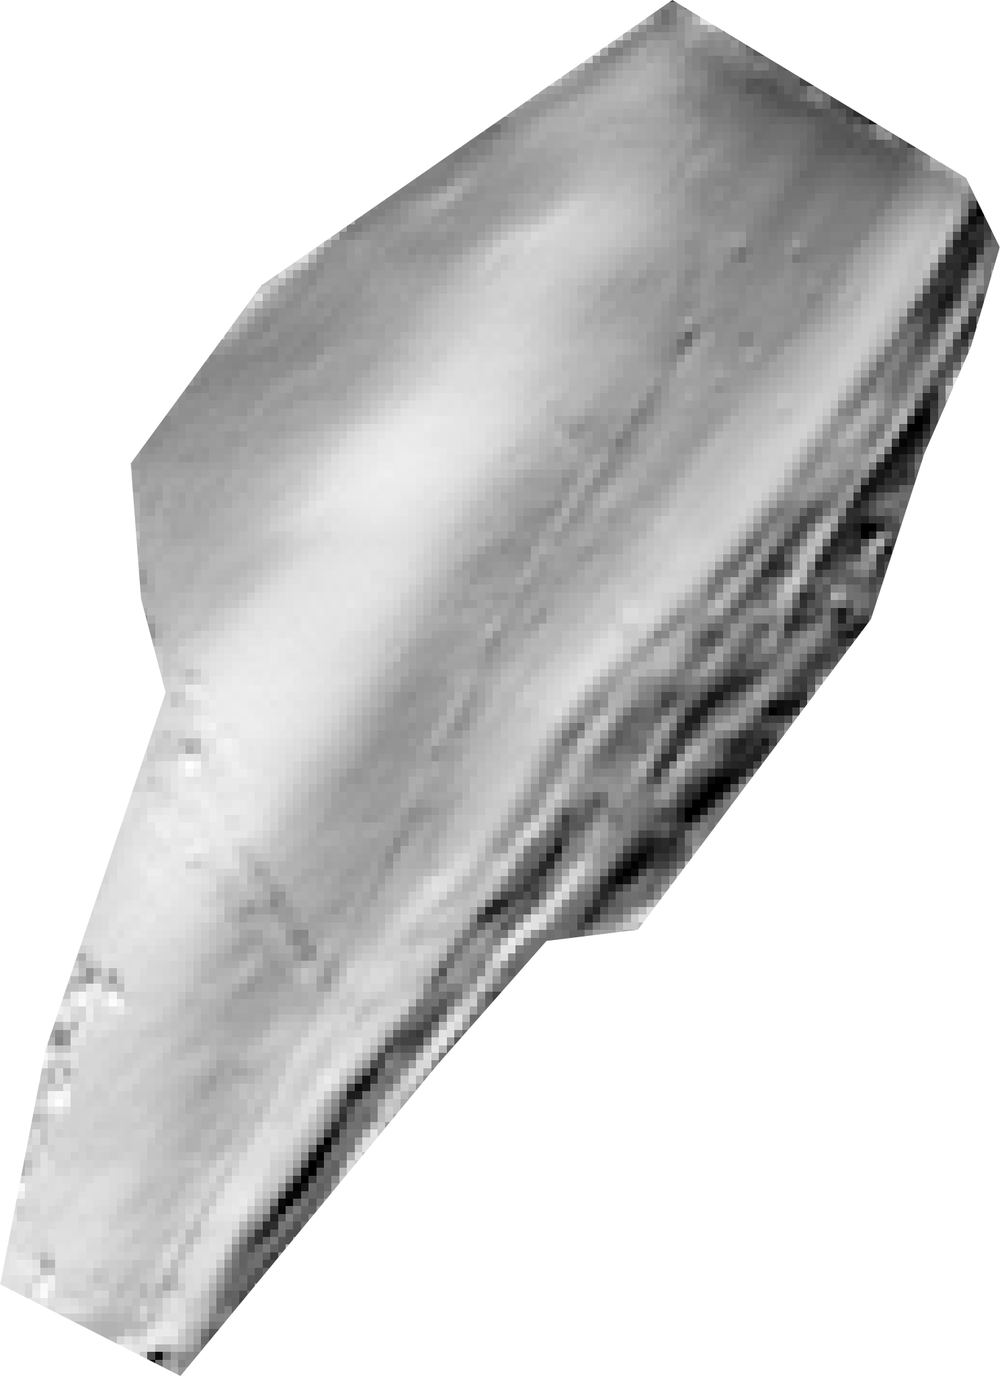 | Area: 4.8 ha Centroid: 50.4486° N, 3.6891° W Elevation (mean): 36 m Slope (mean): 6.8° Dominant aspect: E Topographic Wetness Index: 14.4 Landform: Flat 15% · Ridge 15% · Valley 71% Dominant Keyline Zone: 2 |
Flat 15% | Ridge 15% | Valley 71% |
Landform composition (proportion of parcel area)
Headline finding: a healthy field with diversity as the soft edge
Rabbit's Top Field is in good working order, landing a Land Health Score 6 (low) for 2025. Water is moving and holding well, the canopy is feeding the system, and minerals are turning over at a reasonable rate. The one process running a little behind the others is species diversity, and that is the area worth attention if you want to lift this field into the upper Score 6 band over the next two or three seasons. The shape of the four scores tells a coherent story. Water Cycle (90 percent) sits in the strong band, Mineral Cycle (75 percent) and Energy Flow (73 percent) are both in healthy working range, and Community Dynamics (60 percent) is the lowest of the four by a clear margin of 13 to 15 percentage points. That gap is the signature of a field doing most things well but carrying a thinner plant community than it could.
Landscape position explains the strong water reading
The field sits in a valley-dominated landform: 71 percent valley, 15 percent ridge, on a gentle 6.8 percent east-facing slope at 36 metres elevation. Most of the field falls within the productive valley pasture zone (73 percent in Keyline Zone 2) with a smaller proportion of lower wet pasture (15 percent in Zone 3). The Topographic Wetness Index of 14.4 is in the moderate range for this site, neither a dry ridge nor a wet sump. That landscape position explains the strong water reading. East-facing valley land at this elevation collects and holds moisture without becoming waterlogged, and the 2025 growing season delivered 348 mm of rain (a fair test year, in the middle of the property's eight-year range). A Water Cycle score of 90 percent on this kind of land says the soil is taking rainfall in and releasing it back through the plants as it should. Compaction or surface sealing would show up here as a 15 to 20 point gap between landscape position and the score, and there is no such gap.
Mineral cycling and energy capture are working as a pair
Mineral Cycle at 75 percent and Energy Flow at 73 percent are moving together, which is what you want to see. Litter is being processed, nutrients are returning to the plants, and the canopy is photosynthesising at a level appropriate to a productive valley field on the heavier soils of this part of Devon. The radar structural reading (HV at -17.8 dB) puts this field in the mid range for the property, denser than the more open western fields like Floody Place but lighter than the closed-canopy parcels. That matches a well-grazed pasture with reasonable sward bulk.
Species diversity is the constraint
Community Dynamics at 60 percent is the headline opportunity. The field has the water, the energy, and the mineral cycling to support a richer plant community than it currently carries. In the property's ranking this puts Rabbit's Top Field in the middle of the pack on diversity, behind Peter Rabbit's Patch (68 percent CDI) and Wee Willie Winkie's Meadow (65 percent) but ahead of the southern fields where the score is more clearly suppressed. The route forward is the holistic management sequence: rest first. Extending recovery between grazings, particularly through the late spring and early summer window when the wildflowers and finer grasses set seed, will let the existing species pool express itself before any thought of bringing seed in from outside. The east aspect means this field greens up moderately early in spring and holds growth well into autumn, giving you a longer window than the north-facing parcels to manipulate timing. If, after two seasons of extended rest with a single seed-set deferral each year, the diversity score has not lifted, the next step is on-farm seed transfer: cut hay with ripe seed heads from Peter Rabbit's Patch and spread it here, trampling it in with the next grazing pass. Purchased seed should not enter the conversation for this field. The species pool to draw on is already on the property.
What to watch in 2026
Two things. First, whether the diversity score moves with rest alone, that tells you the seed bank is healthy and just needs time. Second, whether Water Cycle holds at 90 percent through a drier year if 2026 turns out that way, this field's valley position should buffer it well but a drop below 80 percent in a dry season would be worth investigating for any sub-surface compaction from earlier management.
Roo's Sandy Pit
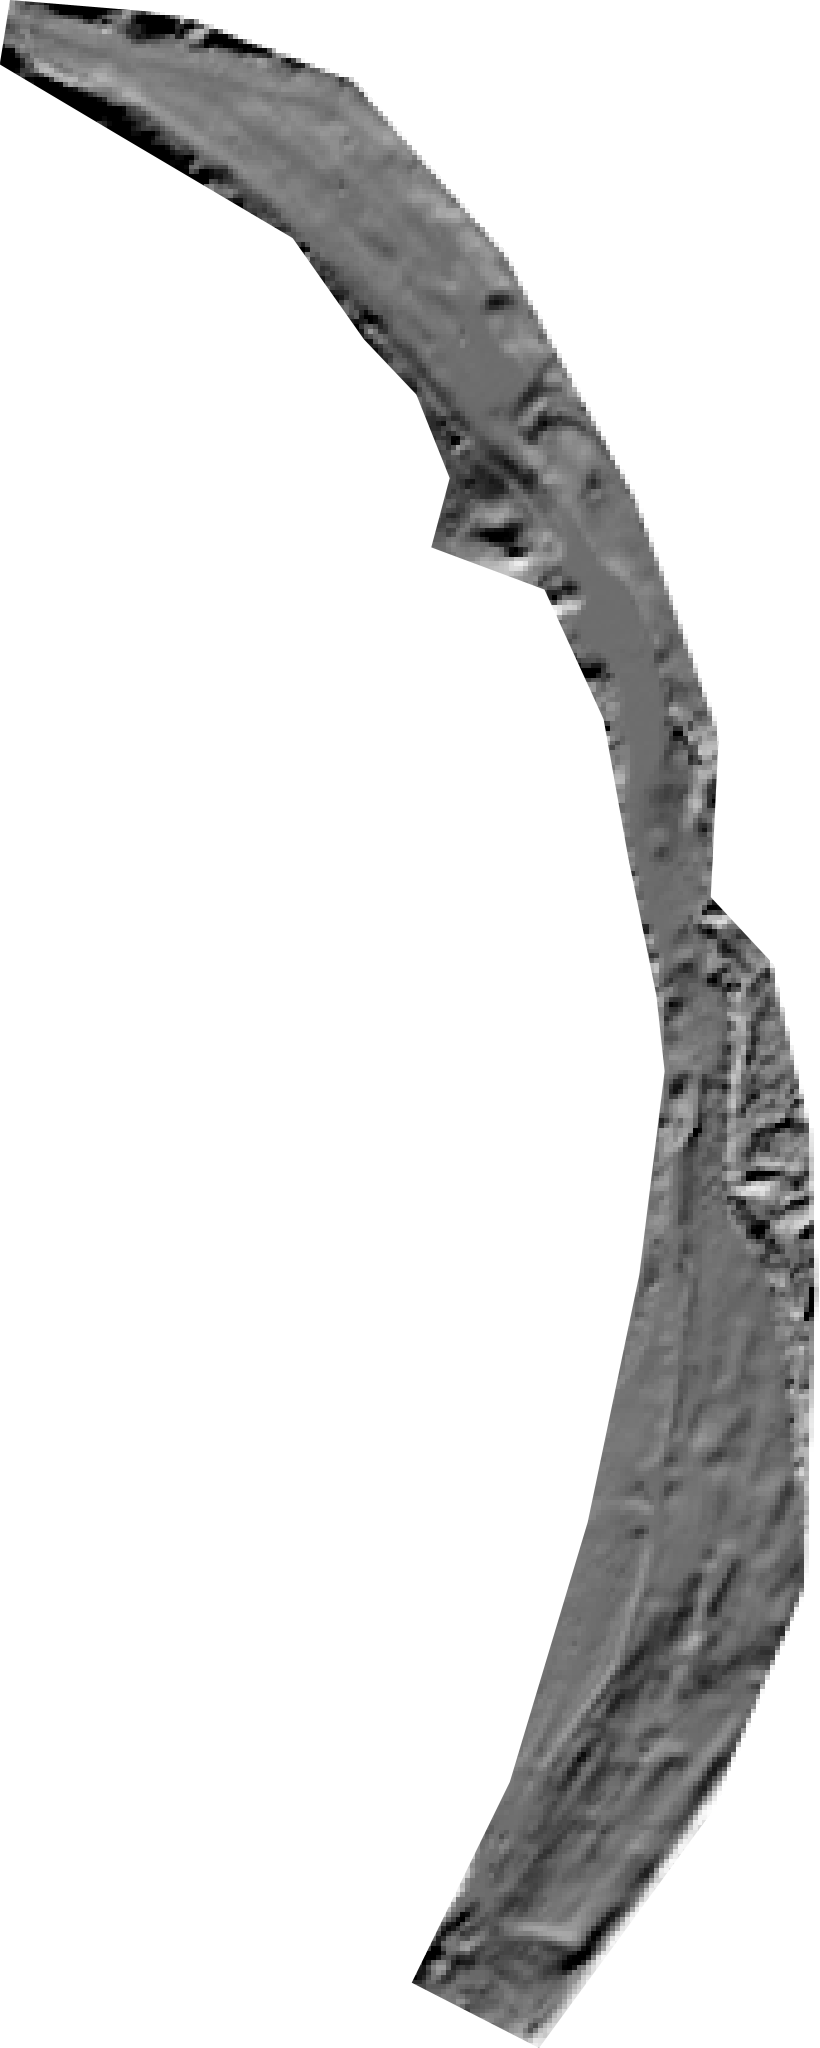 | Area: 6.3 ha Centroid: 50.4563° N, 3.6841° W Elevation (mean): 32 m Slope (mean): 11.8° Dominant aspect: N Topographic Wetness Index: 17.5 Landform: Flat 12% · Ridge 12% · Valley 77% Dominant Keyline Zone: 2 |
Flat 12% | Ridge 12% | Valley 77% |
Landform composition (proportion of parcel area)
Roo's Sandy Pit sits mid-pack and is being held back by community diversity
Roo's Sandy Pit is a north-facing valley field on the steeper end of the property, with around three-quarters of its area in true valley topography, an eighth in steep ground, and a Topographic Wetness Index of 17.5 indicating reliably moist soils. The current season puts it at Land Health Score 6 (mid), comfortably inside the recovering band and broadly typical of the central cluster of grassland parcels on this farm. Water cycling reads strong at 91 percent, photosynthetic capture is solid at 76 percent, and mineral cycling at 80 percent sits near the top of the property's grassland range. The constraint is species diversity at 63 percent, which is where this field has the most actionable lever.
A cool, moist, north-facing valley is doing what such ground should do
The thermal reading sits on the site mean, which on a north-aspect valley field is exactly the signature you want: the land is neither baking in summer nor running cold-and-waterlogged. Combined with the high Topographic Wetness Index and the strong Water Cycle Index, this tells a consistent story of rainfall arriving, infiltrating, and being held in the profile rather than running off the steeper sections. The radar structural reading at -16.0 dB cross-polarised backscatter is one of the denser grassland signals on the property, indicating a thick, three-dimensional sward with real physical volume rather than a thin green skin. Mineral cycling at 80 percent confirms that litter and dung are being incorporated efficiently, which on a moist north-facing field with active biological decay is the expected outcome under the property's non-brittle climate.
Community diversity is the lever, and rest is the first move
The gap between mineral cycling (80) and community diversity (63) is the diagnostic signal here. Water, energy and nutrient pathways are all functioning above the threshold where you would expect species expression to follow, but the diversity score has not caught up. On a north-facing valley field this pattern often reflects a sward that has been kept in a productive but narrow species composition, with the dominant grasses outcompeting forbs and legumes that would otherwise establish in the moist, cool conditions. The first move is not seed. It is rest: extending the recovery interval through one full flowering and seed-set window to let what is already in the seed bank express itself. North-facing fields senesce earlier than south-facing ones, so the deferral window needs to begin earlier in the season than you might apply to a warmer aspect.
What to watch over the next two cycles
If the property's better-scoring fields (Peter Rabbit's Patch at Score 7, and the cluster of Score 6 fields above 65 percent) are achieving their community scores in the high 60s with similar mineral cycling, the trajectory for Roo's Sandy Pit is to close that five-to-ten point diversity gap through grazing-rest management before any seed input is considered. The 2024 season delivered nine optimal growing weeks and zero stress weeks, which means the field had a genuinely fair test recently and the current reading is a fair reflection of management rather than weather. If community diversity has not moved up by three to five points by the next assessment under continued rest-led management, on-farm seed transfer from one of the higher-diversity fields would be the next step, well before any purchased seed mix enters the conversation.
Squirrel Nutkin's Field
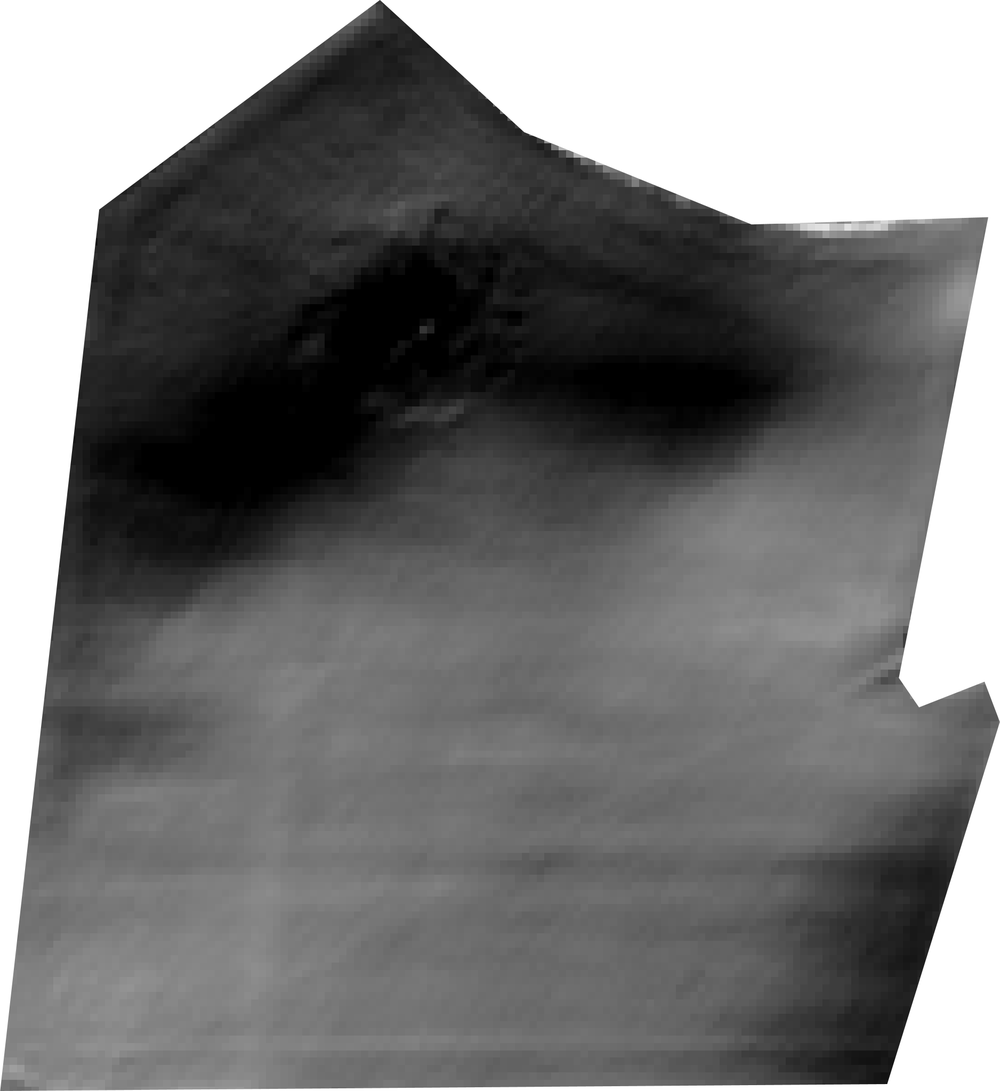 | Area: 6.3 ha Centroid: 50.4532° N, 3.7022° W Elevation (mean): 17 m Slope (mean): 11.2° Dominant aspect: N Topographic Wetness Index: 20.0 Landform: Flat 11% · Ridge 6% · Valley 83% Dominant Keyline Zone: 3 |
Flat 11% | Valley 83% |
Landform composition (proportion of parcel area)
This field is one of the more topographically distinctive parcels on the property. It sits in a north-facing valley bottom (83 percent valley, 6 percent ridge, north aspect) on noticeably steep ground, with average slope around 11 percent and 22 percent of the parcel classed as genuinely steep. The wetness index reads 20.0, the highest on the property, which tells you water collects and lingers here. Most of the parcel (78 percent) falls into the keyline accumulation zone (KZ3), the part of the landscape that receives water rather than shedding it. A cold, wet, steep northern valley with limited solar input is what you are working with, and the scores need reading through that lens.
Energy capture is the constraint, water is not the problem
Land Health Score 5 (low) places Squirrel Nutkin's Field in the transitional band, sitting roughly mid-way through the grassland portfolio at this property. Water cycling reads strongly at 83 percent, which is what you would expect from a valley sink with a high wetness index and a closed sward. Mineral cycling at 68 percent and community dynamics at 53 percent are both reasonable. The limiting ecosystem process is energy capture, sitting at 63 percent, which is the lowest of the four readings and the one to focus on. The pattern is consistent with a sward that gets less solar radiation than its neighbours through the year and probably carries a thatch layer in the wetter pockets. The radar signature (HV around -21.5 dB) confirms a thin structural canopy, lower biomass density than the structurally heavier fields on the property.
The aspect and the seasonality compound each other
A north-facing valley at this slope receives meaningfully less radiation than the south-facing parcels nearby, especially in the shoulder seasons. Spring green-up will run two to three weeks behind The Three Bears' Copse or Old Brown's Field; autumn senescence arrives earlier. The effective growing window is shorter, which directly caps photosynthesis and is the most likely reason energy capture is the limiting reading. Wetness compounds this: a cold, wet sward in spring is slow to get going, and the same wetness that gives you a strong water cycle reading is sitting on cool soil that warms reluctantly. This is a landscape constraint, not a management failure. The field is doing what a north-facing valley sink does.
What this opens up for management
The leverage point is canopy and recovery, not water or fertility. Give the sward longer recovery periods than you would on the south-facing fields, especially in spring and autumn when the radiation deficit is steepest. Defer grazing here for seed set in late summer when the field reaches its narrow window of peak growth, this is a good candidate for hay transfer of ripe seed heads from more diverse paddocks on the property. The steep 22 percent portion is worth walking after wet spells to check for poaching at livestock entry points and along any natural water tracks, the combination of slope, wetness, and north aspect makes thawing soil vulnerable. If you ever consider a tree or shelter intervention here, the valley bottom and north aspect call for shade-tolerant species rather than light-demanding ones. The trajectory to watch over the next two assessment cycles is whether energy capture lifts toward 70 percent as rest and recovery periods extend; if it does, the Score will move with it.
The Cat and the Fiddle Field
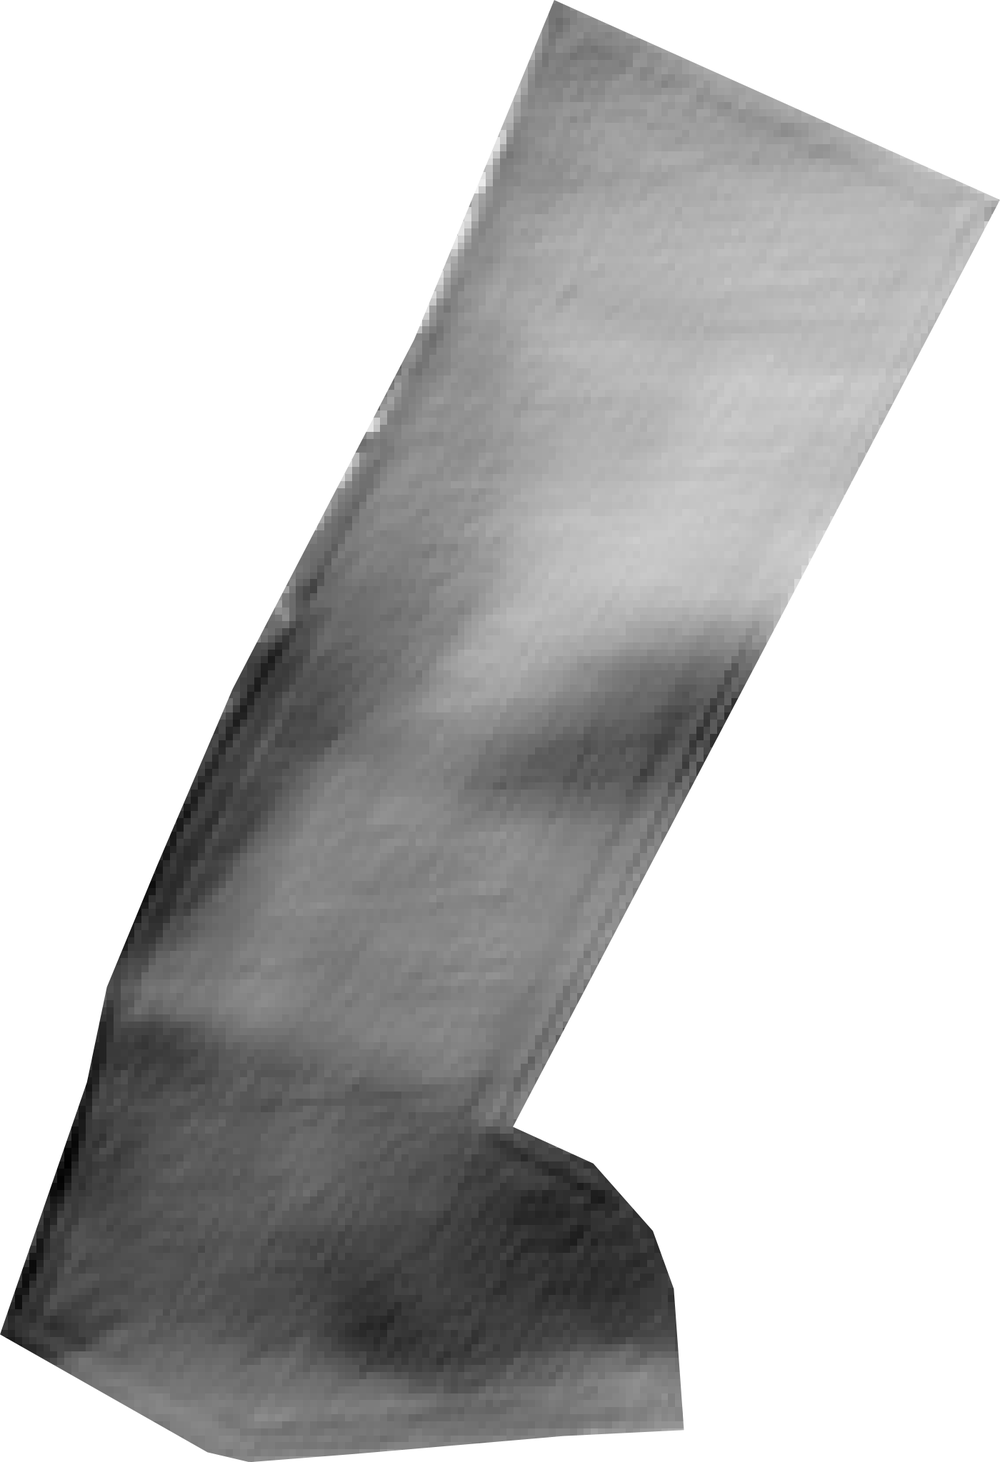 | Area: 5.7 ha Centroid: 50.4454° N, 3.6939° W Elevation (mean): 16 m Slope (mean): 3.4° Dominant aspect: E Topographic Wetness Index: 19.3 Landform: Flat 42% · Ridge 24% · Valley 35% Dominant Keyline Zone: 2 |
Flat 42% | Ridge 24% | Valley 35% |
Landform composition (proportion of parcel area)
The mineral cycle is the constraint here
The Cat and the Fiddle Field is the parcel on this property where the data asks for the most attention, and the headline is clear: mineral cycling is the limiting ecosystem process. The field sits at Land Health Score 4 (high), so it is still functioning, but it is the weakest of the grassland parcels and the gap between its processes is unusually wide. Most of your fields show the four processes moving together within ten or fifteen points of each other. Here, mineral cycling has fallen well behind, and community diversity has come down with it. The numbers tell a coherent story. Water cycling at 65 percent is decent but soft by Wilder Wood standards (the site average sits in the mid-eighties), energy capture at 51 percent is workable, mineral cycling at 38 percent is the floor, and community diversity at 40 percent confirms the diversity deficit that usually accompanies a stalled mineral cycle. When litter and dung stop being incorporated into the soil at a reasonable rate, the plants that depend on that nutrient turnover lose ground, and the sward simplifies. That is the pattern showing here.
Landscape position explains part of the story
This field sits low and wet. Elevation of 16 metres puts it in the bottom quarter of the property, the Topographic Wetness Index of 19.3 is among the highest on the farm, and 35 percent of the parcel reads as valley floor with another 38 percent as keyline gathering ground. East-facing aspect means morning sun and afternoon shade, so it warms slowly and holds moisture longer than the south-facing parcels. That combination should be an advantage. Wet, sheltered valley fields on a non-brittle property like this one (brittleness 3.4) usually carry strong mineral cycling because moisture and biological decay both run year-round. The fact that mineral cycling has stalled in a position that should favour it is the diagnostic signal worth chasing. The most common explanation in this landscape position is compaction, with poaching from livestock standing on saturated ground being the usual culprit. Water Cycle Index of 65 percent on a parcel with TWI of 19.3 is the giveaway: the field should be infiltrating beautifully, and it isn't. Water is sitting on top rather than moving through, which is exactly what a compacted topsoil layer over a wet subsoil produces.
Structure is thin and the sward is simplifying
The radar reading of -20.4 dB cross-polarised backscatter on this field sits in the thin-sward range, lower than neighbouring valley parcels like Pigling Bland's Pasture at -17.7 dB or Tom Kitten's Meadow at -17.3 dB. Structural biomass is below what the position should carry. Combined with community diversity at 40 percent (compared with 58 to 65 percent across the better-functioning grassland parcels) the picture is of a sward that has lost some of its perennial structure, probably through a combination of pugging in wet periods and a narrower species mix taking over. The good news is that this is a recoverable pattern, and the recovery sequence is well understood. The first move is rest through the wettest months to let the existing soil structure repair itself, with grazing returning only when the field is firm enough to carry stock without leaving prints. The second move is to extend recovery periods generally, giving the perennial species time to flower and self-seed, which addresses the diversity question without any seed purchase. If after a full season of rest the sward is still simplified, on-farm hay transfer from one of the high-diversity parcels (Peter Rabbit's Patch or Poohsticks Bridge both carry Land Health Score 6 to 7 and would be appropriate donors) trampled in by livestock is the next step.
What to watch in next year's assessment
The signal to track is whether the Water Cycle Index rebuilds first. If rest and timing changes are working, water cycling will move up before mineral cycling does, probably into the mid-seventies within a season. Mineral cycling will follow over the subsequent year or two as biological decay re-establishes. Community diversity is the slowest indicator and may take three growing seasons to respond. If water cycling stays below 70 percent through next year despite reduced grazing pressure in wet periods, that points to a deeper subsoil compaction issue that may warrant a one-pass keyline subsoiling on the contour to break the pan without inverting the profile.
The Crooked Man's Field
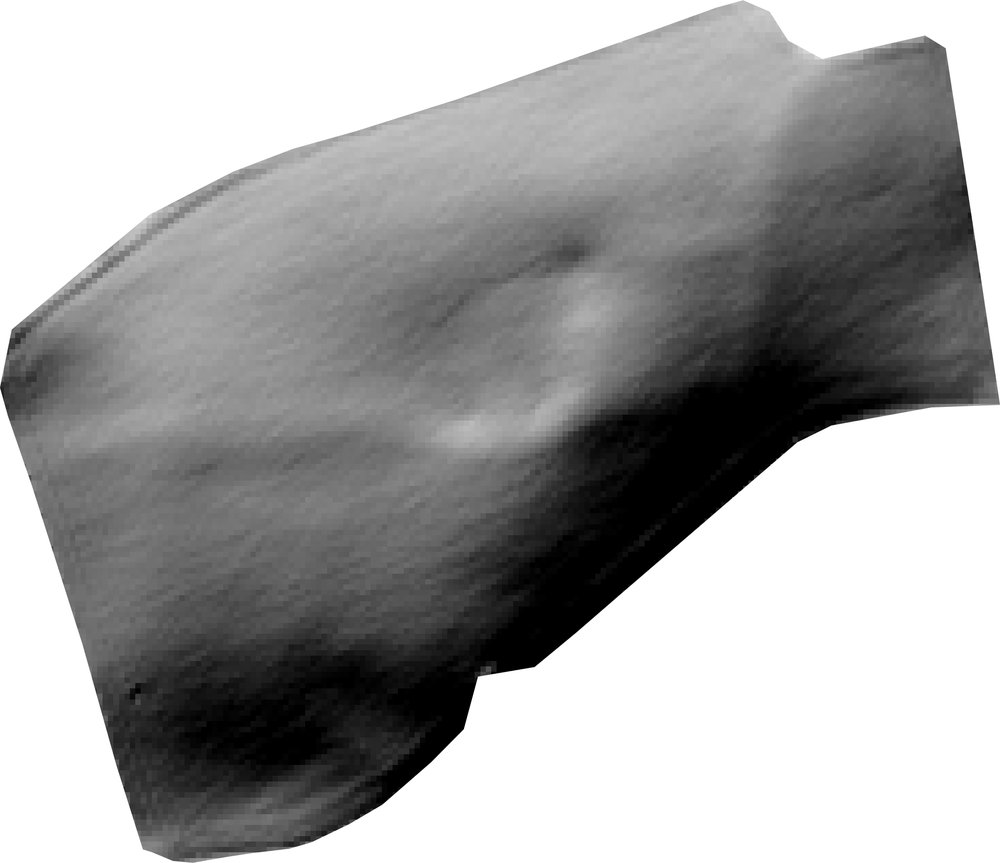 | Area: 6.8 ha Centroid: 50.4563° N, 3.6902° W Elevation (mean): 42 m Slope (mean): 4.0° Dominant aspect: E Topographic Wetness Index: 15.3 Landform: Flat 46% · Ridge 10% · Valley 43% Dominant Keyline Zone: 2 |
Flat 46% | Ridge 10% | Valley 43% |
Landform composition (proportion of parcel area)
Land Health Score 4 places the field at the lower edge of the working range
The Crooked Man's Field sits just below the transitional band, with a Land Health Score of 4 (high) and an overall reading of 53.2 percent. That puts it among the weaker grassland parcels on the property, though still clearly inside the range where management can move it in either direction. The four ecosystem processes show a recognisable pattern: water cycling is holding up reasonably (Water Cycle Index 79 percent), energy capture and mineral cycling are both running below where they should be (Energy Flow 55 percent, Mineral Cycle 58 percent), and species diversity is the weakest leg at 46 percent. This is a community-stalled signature with an energy drag behind it, and the two are connected.
Landscape position is mixed and the field reads accordingly
The parcel sits at 42 metres elevation with a moderate four percent slope and a mixed aspect, with ridge ground and valley ground in roughly equal measure (10 percent ridge, 43 percent valley, 46 percent flat). The Topographic Wetness Index of 15.3 is middle-of-the-road for this site, and half the field falls in Keyline Zone 2 with another third in Zone 3. In practical terms, this is a field with no single dominant character: parts of it shed water, parts of it gather water, and parts of it sit flat. The structural reading from radar (HV backscatter at -21.4 dB) puts the sward in the thin-to-moderate range, consistent with a pasture that is not building canopy mass through the season. Combined with the moderate Water Cycle Index, the picture is of a field where infiltration is acceptable but where the living plant community is not putting on the volume of growth a Devon pasture should at this rainfall.
Species diversity is the limiting process
The 46 percent Community Dynamics reading is the clearest signal here, and it is dragging Energy Flow down with it. A pasture with a narrow species pool captures less light over the season because different species peak at different times; lose the diversity and you lose the shoulder-season growth. The mineral cycling score of 58 percent reinforces this read: litter is not being processed efficiently, which usually points to a sward dominated by a few aggressive species rather than a mixed community with the full range of root depths and leaf litters that feed soil biology. The growing season this year was a fair test rather than a stressed one (348 mm of rain, only three stress weeks), so the weakness shows up as a real management signal, not a weather artefact.
The first moves are rest and grazing rhythm, not seed
Before reaching for a seed mix, the practical sequence on a field like this is to give the existing species pool a chance to express. Extending recovery periods between grazings, even by a couple of weeks beyond current practice, lets the slower species flower and set seed. One full deferral through the summer (taking the field out of rotation for a season) would let whatever diversity is latent in the seed bank come forward. If diversity remains thin after two seasons of rest and disciplined recovery, on-farm seed transfer from one of the stronger neighbouring parcels (Peter Rabbit's Patch or Mary's Garden, both running Land Health Score 6 or 7) would be the next step: cut hay with ripe seed heads from those fields and spread it here, then trample it in with a mob graze. The mixed aspect means there is no single seasonal window to target, the field will green up in patches, and a grazing plan that follows that patchiness rather than treating the field as uniform will help the diversity rebuild. Worth watching over the next two assessment cycles is whether the Community Dynamics score lifts in response to the rest, which would confirm the diagnosis and unlock the energy flow behind it.
The Old Grey Mare's Field
 | Area: 3.0 ha Centroid: 50.4498° N, 3.7107° W Elevation (mean): 70 m Slope (mean): 8.7° Dominant aspect: W Topographic Wetness Index: 14.2 Landform: Flat 18% · Ridge 48% · Valley 34% Dominant Keyline Zone: 2 |
Flat 18% | Ridge 48% | Valley 34% |
Landform composition (proportion of parcel area)
Energy capture is the constraint that pulls every other process down
The Old Grey Mare's Field sits at a Land Health Score 4 (mid) in 2025, and the shape of the four ecosystem processes tells a clear story: this paddock is functioning, but the engine that drives the others is running below where it could be. Water cycling is the strongest process here at 74 percent, mineral cycling sits at 57 percent, energy flow at 52 percent, and community diversity at 42 percent. The spread between water and community is wide, and that pattern is diagnostic. When energy capture lags, mineral turnover and species diversity have less to work with downstream, and the whole system idles at a lower setpoint than the landscape position would otherwise support. The within-week tracking through 2025 reinforces this read. Across the growing season the field's average energy flow ran at 21 percent and water cycling at 39 percent, with peaks reaching the low sixties only briefly. That is a paddock that flickers into good function for short windows and then drops back, rather than holding a steady productive band. Six grazing events were recorded with no mowing, so the recovery pattern is entirely driven by how livestock have moved through the field and how long the rest periods between visits were.
Landscape position is favourable, which means the headroom is real
This is the encouraging part of the picture. The Old Grey Mare's Field sits at 70 metres elevation on an 8.7 percent slope facing west, with 22 percent of its area in the catchment zone and 48 percent in the high-ridge zone. Nearly half the field is on the ridge, a third sits in the valley, and only 18 percent is flat. That mix is what you want for a paddock that captures rain at the top, moves it across a working sward, and concentrates moisture toward the lower lines. A Topographic Wetness Index of 14.2 confirms the field drains rather than waterlogs, which matches the relatively strong water cycle reading. The west aspect means afternoon sun and a slightly later spring green-up than the south-facing paddocks on this property. The radar structural signal is the surprise. HV backscatter sits at -21.2 dB, which is well below the rest of the grassland paddocks on the farm (most cluster between -16 and -19 dB). That reading is indicative of a structurally thin sward — green when it grows, but light on standing biomass volume. Combined with the modest energy flow score, this points to a sward that is being held shorter than the landscape can support, either through grazing pressure that returns before full recovery, or through a species composition that simply doesn't build much standing structure between visits.
Community diversity is the longer-term lever
At 42 percent, community diversity is the lowest of the four processes and the one that will respond slowest. This is not unusual for a paddock that has been grazed steadily without long deferrals, and the brittleness setting here (3.4, firmly non-brittle) means the standard remedy works: rest, in the right doses, lets existing species express, flower, and self-seed. Before anything else is tried, the first move worth investigating is extending the recovery interval between grazing events on this specific paddock through one full growing season. Watch what comes up. The seed bank in a Devon pasture at this elevation is usually richer than the current sward suggests, and the species pool wants a chance to set seed before any external intervention is considered. If after a season of extended rest the diversity reading hasn't lifted, the next step in sequence is mob grazing for non-selective intake and trampling — using high stock density for short durations to press seed and litter into the soil surface. Only after two or three years of working with what is already present would on-farm seed transfer from one of the species-richer paddocks (Peter Rabbit's Patch or Poohsticks Bridge, both scoring in the high sixties for community diversity) come into play. Cutting hay with ripe seed heads from those donor paddocks and spreading it here, then trampling it in with stock, is the cheapest and most genetically appropriate way to lift the species pool on this field.
What to watch in the next assessment cycle
Three things will tell you whether the field is moving. First, does water cycling hold above 70 percent through a normal-rainfall year — that confirms the landscape position is doing its job and there is no compaction layer forming under the grazing pattern. Second, does energy flow climb out of the low fifties toward the mid-sixties where the better paddocks on the farm sit — that is the signal that sward structure is rebuilding and the recovery intervals are working. Third, does community diversity begin to lift from 42 percent toward 50 percent — that is the slowest needle and the one that requires the most patience, but it is also the one that, once it moves, pulls the whole Land Health Score up with it. The 2024 growing season was a fair test on this farm (486 mm of rain, no stress weeks, nine optimal weeks), and 2025 was tighter (348 mm, three stress weeks). Comparing 2026's reading against both years will sharpen the picture of what is management-driven versus weather-driven on this paddock.
The Spider's Web Meadow
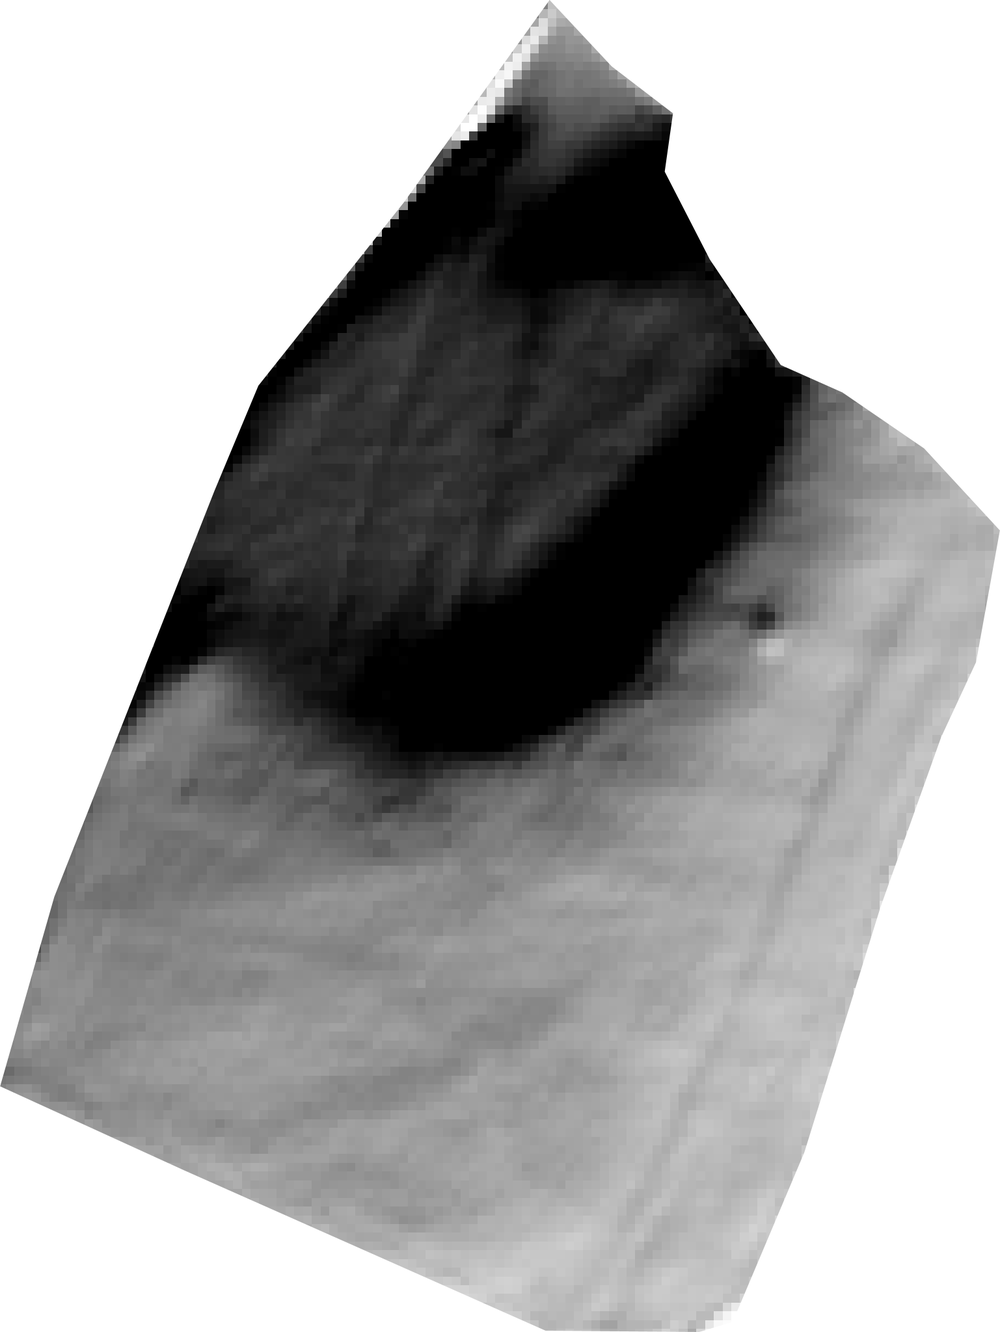 | Area: 4.1 ha Centroid: 50.4481° N, 3.6920° W Elevation (mean): 78 m Slope (mean): 5.9° Dominant aspect: E Topographic Wetness Index: 14.6 Landform: Flat 23% · Ridge 76% · Valley 0% Dominant Keyline Zone: 2 |
Flat 23% | Ridge 76% |
Landform composition (proportion of parcel area)
A strong field carrying a real diversity gap
The Spider's Web Meadow is one of the better-performing parcels on the property, sitting at Land Health Score 6 (mid) and well inside the recovering band. Water cycling, energy capture, and mineral cycling are all working at or above the levels you'd expect for a non-brittle Devon pasture in a normal-rainfall year. The one process pulling the field's overall score down is community diversity, and that gap is the most interesting thing the data has to say about this meadow. Water Cycle Index sits at 86 percent, Energy Flow Index at 73 percent, Mineral Cycle Index at 75 percent, and Community Dynamics Index at 62 percent. Read those numbers as a profile and the picture is clear: rainfall is being captured and held, the sward is photosynthesising well through the growing season, litter and dung are being turned over at a reasonable rate, and the only weak leg of the four-legged stool is the breadth of species expressing in the sward. For a meadow that names itself after a web, the metaphor cuts both ways here.
The landscape position is doing the field favours
The Spider's Web sits at 78 metres elevation on a mostly east-facing ridge, with three quarters of its area classified as ridge ground and the remainder as gentle flat. Slope averages around 6 percent, well inside the perennial pasture range. The Topographic Wetness Index of 14.6 puts the field in the moderately well-drained category, which matches the high water-cycling score: rain that lands here infiltrates, but the ridge position means it doesn't collect or pond. What's worth noticing is the keyline geometry. The field is dominated by Keyline Zone 2 (the upper-shoulder zone, 77 percent of area) with a smaller Zone 1 catchment portion (8 percent). Zone 2 is the part of the landscape where water has the most movement choice, and where keyline-pattern cultivation or grazing tracks have the strongest effect on whether water drifts toward valleys or spreads across ridges. The fact that water cycling is already at 86 percent tells you the existing sward and root structure are doing this work well without intervention. There is no water problem to solve here. The east-facing aspect gives the field morning sun and afternoon shade, which keeps evapotranspiration moderate through summer afternoons and reduces drought stress in the warmer years. The radar structure reading (HV backscatter of -19.9 dB) sits in the healthy grassland band, indicating a structurally substantial sward with good standing biomass rather than a thin or recently-grazed cover. The thermal signal shows the field tracking site mean, with no heat anomaly to suggest compaction or bare patches.
Diversity is the limiting process, and it is the manageable one
The 13-point gap between Mineral Cycle Index (75) and Community Dynamics Index (62) is the most diagnostic single feature of this field. Mineral cycling at 75 percent says the sward has the litter throughput, soil biology, and nutrient turnover to support more species than it currently expresses. Energy flow at 73 percent says there's photosynthetic headroom for a more layered canopy. The land could carry more diversity than it currently does. Something is suppressing expression rather than capability. Three contextual factors point to the likely cause. First, the field has had a normal-rainfall growing season in 2025 (348 mm with three stress weeks and four optimal weeks), so this is not a weather-driven dip. Second, the ridge position with moderate Topographic Wetness Index typically favours a mid-diversity grass-and-herb mix when managed for it, and the soils underneath would not be the constraint. Third, the meadow's name and its ridge-shoulder character suggest historical species-richness that may have narrowed under uniform grazing or mowing pressure. The data is consistent with a sward that has been selectively grazed or cut at the same time each year for long enough that early-flowering and late-flowering species have been pushed back. The remediation here follows the standard hierarchy, and the first three moves are the highest-leverage ones. Extending the recovery period between grazing events through one full growing season would let the species already present in the seed bank flower and self-seed; that alone often lifts Community Dynamics Index by 5 to 8 points over two years on a field with otherwise good mineral cycling. A single deferred summer (taking the field out of rotation from May through July) would compound that effect. If after two seasons of rest the diversity is still narrow, on-farm seed transfer from a more diverse paddock cut at ripeness and trampled in by livestock is the next step. There is no case here for purchased seed; the mineral cycle score of 75 and the energy flow of 73 say the ecology is ready to express more diversity if given the time and seed-set window.
What to watch over the next two assessment cycles
The trajectory to track is whether the Community Dynamics Index closes the gap with Mineral Cycle Index over the next two years. A move from 62 to 70 would shift the field from Score 6 (mid) into Score 7 territory and put it among the top-performing parcels on the property alongside Peter Rabbit's Patch. If diversity stays flat while the other three processes hold, that's a signal that the recovery period extensions are not long enough, or that the grazing return interval is still too uniform. If diversity weakens while the other processes also slip, look first at the 2026 and 2027 growing-season rainfall and stress weeks before reading it as a management issue. Water cycling at 86 percent on a ridge field is robust, but a genuinely dry year would test it, and a co-decline across processes is usually weather-led on a non-brittle site of this character.
The Thoughtful Spot
 | Area: 0.5 ha Centroid: 50.4510° N, 3.6879° W Elevation (mean): 40 m Slope (mean): 6.5° Dominant aspect: E Topographic Wetness Index: 17.2 Landform: Flat 26% · Ridge 30% · Valley 43% Dominant Keyline Zone: 2 |
Flat 26% | Ridge 30% | Valley 43% |
Landform composition (proportion of parcel area)
Energy capture is the limiting process here
The Thoughtful Spot is a working middle-of-the-pack field where the four ecosystem processes have separated by enough margin to point clearly at where the leverage sits. Water cycling is doing its job, mineral cycling is respectable, but energy capture and species diversity are both running below where the rest of the property sits. The Land Health Score of 5 (low) reflects that pattern: a competent field that is not yet expressing its full potential. Looking at the four processes in turn, the water cycle is the strongest at 84 percent, which is what you would expect from a field sitting partly in the catchment zone (KZ1 at 22 percent) with a moderate Topographic Wetness Index of 17.2. Rainfall lands here and stays available. Mineral cycling at 67 percent and energy flow at 65 percent are both serviceable, but the standout finding is species diversity at 51 percent, the lowest of the four processes and noticeably below the property median. The Community Dynamics Index (CDI) is telling you that the species mix on this field has thinned compared with neighbours like Peter Rabbit's Patch (68) or Poohsticks Bridge (65).
The east-facing slope and ridge-edge position shape the seasonal pattern
The field sits at 40 m elevation with a 6.5 percent slope facing east, which means morning sun, afternoon shade, and a moderate growing season window. Thirty percent of the field reads as ridge, 43 percent as valley, with the remainder flat. That ridge-and-valley split matters: the ridge portion will dry first in a stress week, while the valley portion holds moisture longer. The radar structural reading of -17.1 dB HV sits in the moderate-biomass range typical of grazed pasture with average sward density, not particularly thin and not particularly tall. The growing season data adds useful context. 2025 delivered 348 mm of rain across the growing season with three stress weeks, a fair test by recent standards but drier than the bumper 2024 (486 mm, zero stress weeks). The field's seasonal trace, with the Land Health Index averaging 41 over the year and peaking at 68, shows a sward that responds well in the good weeks but lacks the diversity buffer to hold its position through dry spells. Energy flow averaging 35 percent across the weekly trace, against a year-end reading of 65 percent, suggests the field carries reasonable peak-season canopy but spends more of the year below its capability than its neighbours do.
Species diversity is the highest-leverage opening
The recovery hierarchy points to rest and grazing management before any seed input. With CDI as the binding constraint and no mowing or grazing events recorded in the weekly trace this season, the field looks like a candidate for a deferred rotation pass: take it out of the working rotation for one full season, allow whatever species are present to flower and self-seed, and follow with a single high-density grazing pass to trample seed into contact with the soil. The east aspect favours this approach because morning sun supports good seed set without the afternoon heat stress that a south-facing field would carry. A second opening worth investigating is the ridge-edge dryness. The 30 percent ridge fraction is where diversity tends to fall first on this kind of landscape, because the moisture-loving species retreat downslope. If a hay transfer from one of the diverse neighbours (Peter Rabbit's Patch and Poohsticks Bridge both score well on diversity and sit nearby) is feasible, cutting that hay with ripe seed heads and spreading it across the ridge fraction of The Thoughtful Spot would be the next step after rest and trample have done their work. Watch the 2026 weekly trace for an earlier and higher peak in the Land Health Index. That is the signal that diversity is rebuilding.
The Three Bears' Cottage Field
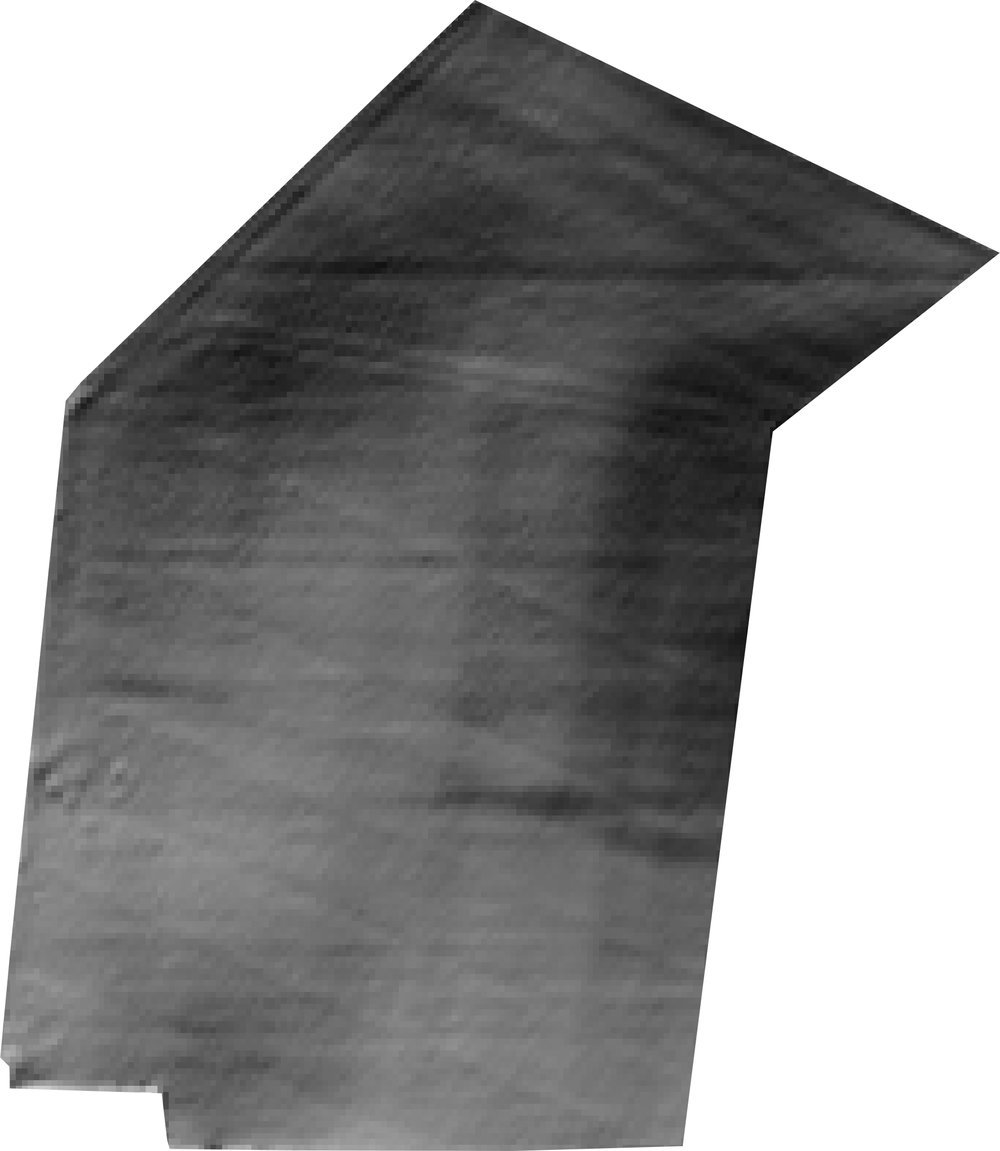 | Area: 8.4 ha Centroid: 50.4537° N, 3.7053° W Elevation (mean): 34 m Slope (mean): 2.2° Dominant aspect: S Topographic Wetness Index: 15.6 Landform: Flat 55% · Ridge 45% · Valley 0% Dominant Keyline Zone: 2 |
Flat 55% | Ridge 45% |
Landform composition (proportion of parcel area)
Energy capture is the lever that will move this field
The Three Bears' Cottage sits at Land Health Score 5 (low), which puts it in the lower half of the working-farm fields on this property. The processes are not failing, they are unevenly matched. Water cycling holds up well, mineral cycling is respectable, but energy capture and species diversity are both running behind where they could be. Of the four, energy capture is the one to focus on, because once the canopy is building biomass more consistently through the season, the others follow. In plain terms, this field is catching and holding rainfall properly but converting less of it into plant growth than its neighbours. Water Cycle Index sits at 83 percent, comfortably in the functional range, while Energy Flow Index sits at 64 percent and Community Dynamics Index at 53 percent. Mineral Cycle Index at 69 percent shows the litter-to-soil pathway is working. The pattern is classic for a field that has the moisture and the nutrient turnover to support a denser, more diverse sward but is not yet expressing it, either because rest periods have been short, because the species pool has narrowed, or because the canopy is being grazed before it reaches the height where photosynthesis is most efficient.
The landscape is doing you a favour here
The topography of this field is one of its strengths and worth knowing about. It sits at 34 metres on a gentle 2.2 percent slope, with a Topographic Wetness Index of 15.6 which is moderately wet for this property. Forty-five percent of the field reads as ridge and the rest as flat, with a south-facing aspect. That combination, gentle south-facing ground with reliable subsurface moisture, is some of the most productive land configuration you can ask for in Devon. The Keyline zones split between the upper-slope catchment band (26 percent in Zone 2) and the mid-slope pasture band (22 percent in Zone 3), meaning water moves through this field in an orderly way without ponding or running off. The radar reading of -21.9 dB HV backscatter is on the lower side for the grassland fields here, which says the standing biomass volume is thinner than fields like Heffalump Pasture or Pooh Corner Meadow. This lines up with the energy capture score. The field has the moisture, the slope, the aspect, and the mineral turnover to grow more biomass than it currently does. What it needs is more leaf area held in the sunlight for longer between grazing events.
Rest first, then look at diversity
The community dynamics score of 53 percent suggests the species mix has thinned, which is the second lever after energy. Following the holistic management hierarchy, the first move is not seed but rest. Extending the recovery window between grazings on this field through one full growing season will let the existing species flower, set seed, and self-recruit. Many UK pastures carry a richer seed bank than the standing sward suggests, and the species are waiting for the chance to express. If after one or two seasons of extended rest the diversity has not visibly improved, the next step is on-farm seed transfer: cutting hay with ripe seed heads from one of your stronger fields (Peter Rabbit's Patch at Score 7 would be an ideal donor) and spreading it here in late summer, then trampling it in with stock. Carbon flux on this field reads at +6.1 tonnes CO2 equivalent per hectare per year, which means the land is currently building productive capital rather than losing it. That is the foundation you are working from. The trajectory to watch over the next two assessment cycles is whether energy capture climbs from 64 toward the upper-70s range that the stronger fields on this property are achieving. If it does, expect the species diversity score to follow within a year or two as the longer rest periods give the existing community room to recover.
The Wild Wood
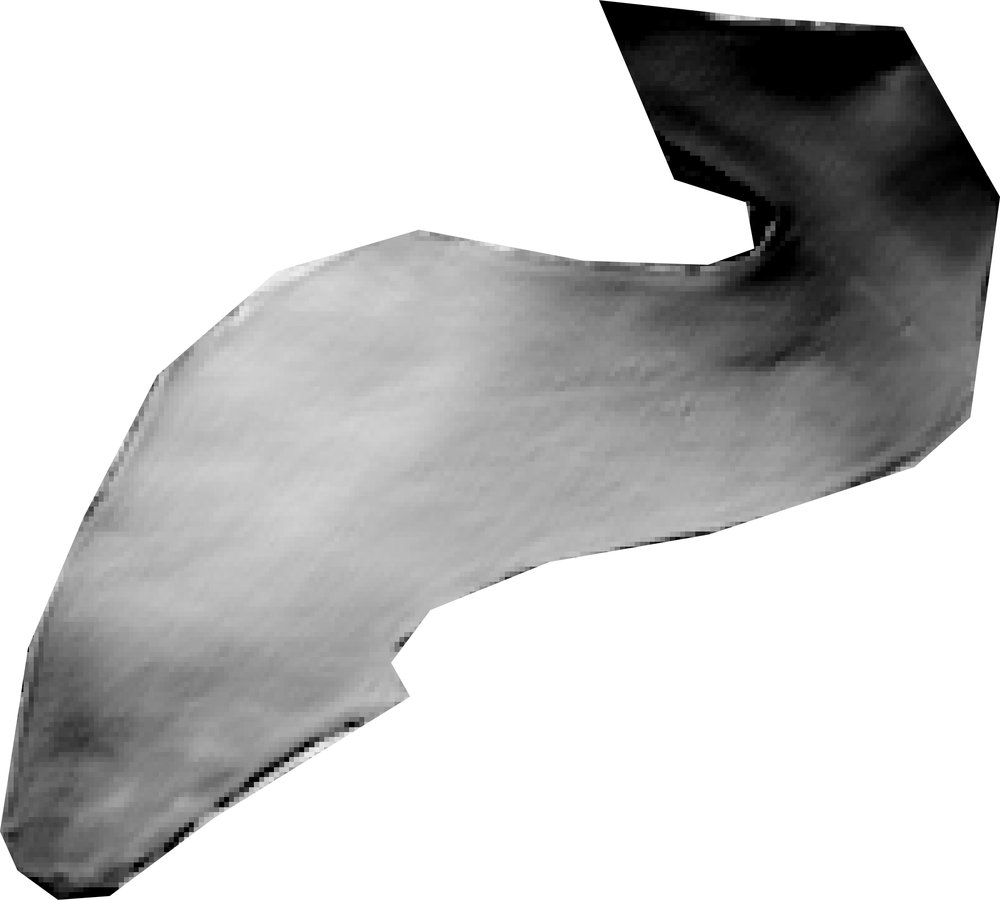 | Area: 6.4 ha Centroid: 50.4582° N, 3.6907° W Elevation (mean): 30 m Slope (mean): 7.4° Dominant aspect: W Topographic Wetness Index: 18.8 Landform: Flat 67% · Ridge 17% · Valley 16% Dominant Keyline Zone: 2 |
Flat 67% | Ridge 17% | Valley 16% |
Landform composition (proportion of parcel area)
The Wild Wood sits in the middle of the property's grassland ranking and is performing as you would expect for a sheltered, mostly flat parcel of its position. Land Health Score 5 (mid) puts it in the transitional band, very close to a clutch of similarly-functioning meadows including Tigger's Bouncing Place and Baa-Baa Pasture. The Water Cycle Index of 84 percent, Energy Flow Index of 71 percent, Mineral Cycle Index of 72 percent and Community Dynamics Index of 58 percent describe a parcel where the four ecosystem processes are working together at a respectable level, with no single channel collapsed and no single channel running ahead. For a west-facing field at 30 metres elevation on gentle ground, that balance is what good management looks like. The reading on community dynamics is the channel with the most room to improve. At 58 percent, species diversity is the limiting ecosystem process here, sitting roughly ten to fifteen points behind water cycling and a touch behind mineral cycling. This is the typical signature of a productive sward that has settled into a smaller working species pool than the land could support, and it lines up with what you see across most of the mid-ranking grassland parcels on this property. The other three processes are doing their job, so the lever is botanical, not hydrological or nutritional.
The landscape position is unusually forgiving
The topography here works in the parcel's favour and is worth pointing out because it explains why the Water Cycle Index is sitting so comfortably. Two thirds of the field is flat ground, the Topographic Wetness Index of 18.8 is high (this is a moisture-receiving position in the landscape), and almost all of the parcel sits in Keyline Zone 2, the productive shoulder zone below the ridge and above the valley floor. Ridge fraction and valley fraction are roughly balanced at 17 and 16 percent. None of the parcel is steep. That combination, gentle slope, good moisture retention, productive landscape position, west aspect catching afternoon sun, is genuinely well-suited to mixed grazing or hay. The structural biomass reading on radar (HV at -19.8 dB) is consistent with a moderately dense sward rather than a thin or recently grazed one. The growing season this year was a fair test rather than a stressed one. Rainfall of 348 mm with three weeks of moisture stress sits in the normal range for this site, the brittleness of 3.4 keeps the property in the non-brittle band where rest aids recovery, and the year-on-year Land Health trajectory across the whole property has moved between Score 5 and Score 6 without lurching in either direction. So the Wild Wood's current readings are a fair reflection of its underlying state, not an artefact of weather.
Lifting community dynamics is the next move
The honest reading is that the Wild Wood is doing well on water, energy and minerals, and the next gain is in species diversity. Because the property is non-brittle and the sward is already productive, the first move is rest and timing rather than seed. Extending the recovery period between grazing events, deferring the parcel for full seed set in one summer out of two or three, and allowing the existing species to flower and self-seed will draw out what the seedbank already holds. If after a couple of seasons the diversity has not lifted, the next step is on-farm seed transfer: cutting hay with ripe seed heads from your more diverse paddocks (Peter Rabbit's Patch is at the top of your community-dynamics ranking and would be an obvious donor) and spreading it on the Wild Wood with livestock impact to trample it in. Purchased seed is the last resort, not the first, and on this parcel the seedbank is almost certainly richer than the current expression suggests. One thing worth watching over the next assessment cycle is whether the gap between energy flow and community dynamics closes. On a productive parcel like this, energy and minerals can keep ticking along at their current level for years while diversity stays flat, which over time leaves the parcel functional but brittle to a year of real weather stress. The trajectory you want to see is community dynamics climbing five to ten points over three years while the other three processes hold steady. That would move the Wild Wood from Score 5 (mid) into the Score 6 band alongside its better-performing neighbours.
Three Blind Mice Meadow
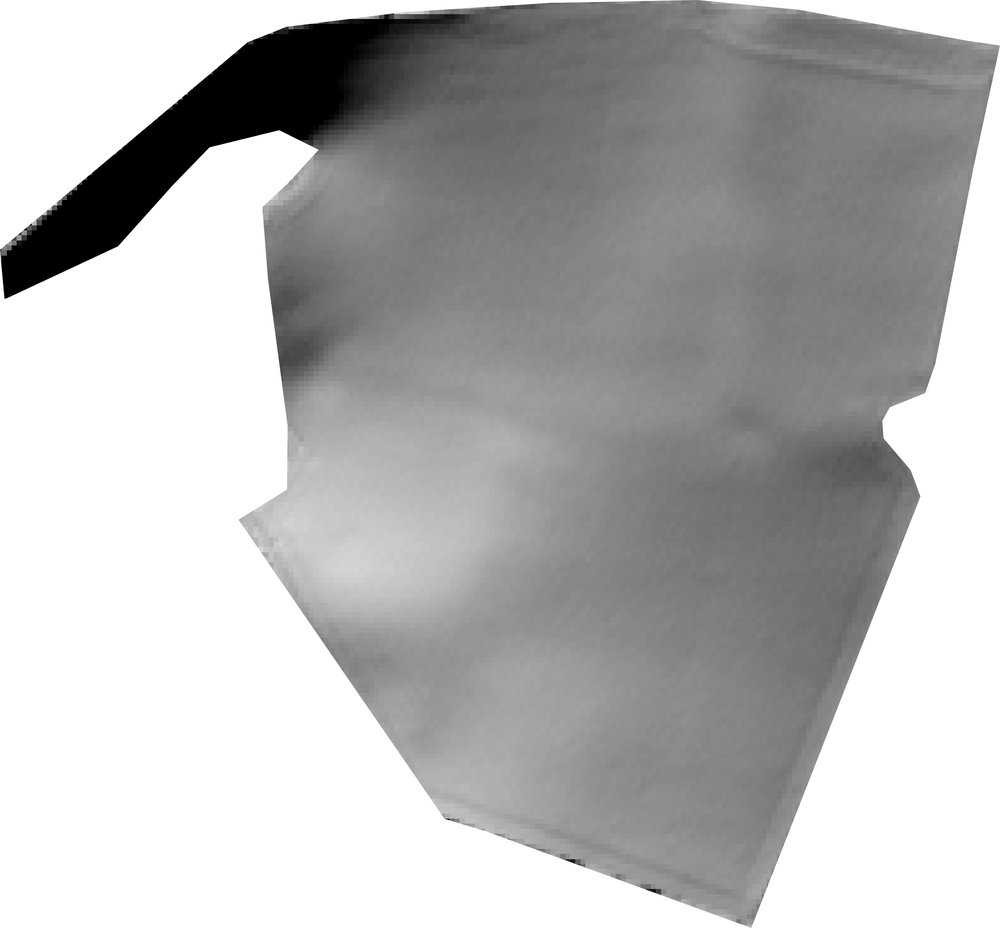 | Area: 8.4 ha Centroid: 50.4549° N, 3.6865° W Elevation (mean): 41 m Slope (mean): 2.8° Dominant aspect: W Topographic Wetness Index: 15.4 Landform: Flat 60% · Ridge 25% · Valley 15% Dominant Keyline Zone: 2 |
Flat 60% | Ridge 25% | Valley 15% |
Landform composition (proportion of parcel area)
Energy capture is the binding constraint on this field
Three Blind Mice Meadow is the field on this property where the four ecosystem processes are pulling apart most visibly, and the constraint sitting underneath the others is the plants' ability to turn sunlight into biomass. Land Health Score 3 places the field in the degraded band of the grassland reference scale, and the limiting process is clearly energy flow: Energy Flow Index (EFI) of 38 percent, Community Dynamics Index (CDI) of 30 percent, Mineral Cycle Index (MCI) of 42 percent, with Water Cycle Index (WCI) holding higher at 64 percent. The shape of that gap matters. Water arrives and is retained better than the plant community is currently equipped to use it. The radar reading reinforces what the energy score is saying. Cross-polarised backscatter of -23.2 dB is the lowest structural biomass signal of any grassland parcel on the property, and the co-polarised channel at -15.9 dB matches that picture. The sward is thin, structurally light, and not building the standing canopy needed to drive photosynthesis through the season. The synthetic weekly summary tells the same story from a different angle, with an Energy Flow Index averaging 21 percent across the year, which is well below where a Devon meadow with this rainfall profile and topography should sit. The field is not catching the light it is offered.
The shape of the landscape is not the problem
Topography rules out the easier explanations. The field sits at 41 m elevation on gentle slopes (around 2.8 percent), with a Topographic Wetness Index (TWI) of 15.4 indicating moderate accumulation of water through the profile. Ninety-six percent of the parcel falls in Keyline Zone 2, the mid-slope shoulder where most productive grassland on this property is sitting, and the parcel is balanced between ridge and valley (25 percent ridge, 15 percent valley, 60 percent flat). This is not a hard piece of ground. The neighbours in the same keyline position and similar topography, Goldilocks Field and Old MacDonald's Farmyard, sit at Land Health Score 3 as well, suggesting this corner of the property shares a common pressure rather than a site-specific quirk.
Community diversity is the lever, water is the asset
The community dynamics score of 30 percent is the second-lowest on the property and it tracks the energy reading closely. A thin sward of low diversity captures less light, returns less litter, and feeds a slower mineral cycle, which is exactly the pattern visible here. The water cycle holding at 64 percent is the asset to build from: infiltration and retention are working better than the plants are currently exploiting, which means the field has headroom if the sward can be rebuilt. In the holistic management hierarchy, that points first to rest with managed impact, not to a seed bill. An extended recovery window through a full growing season, followed by a high-density grazing pass timed to trample seed and litter into contact with soil, lets the existing species pool express itself before any thought of intervention from outside the farm gate.
What to watch in the next assessment cycle
The trajectory to watch over the next two to three years is whether Energy Flow Index begins to climb and whether the radar structural signal (HV backscatter) moves from its current -23 dB toward the -19 to -20 dB range that the better-functioning grassland parcels on the property sit at. If those two indicators move together, the community is rebuilding and the mineral cycle will follow. If the water cycle reading begins to slip while energy flow stays flat, that is the signal that the soil is starting to lose the asset it currently has, and the response window narrows. The 2024 growing season was generous (486 mm rain, nine optimal weeks, zero stress weeks), so a 2025 reading this low on a field with this topography is not weather-driven. The constraint is biological and it sits within reach of management.
Tigger's Bouncing Field
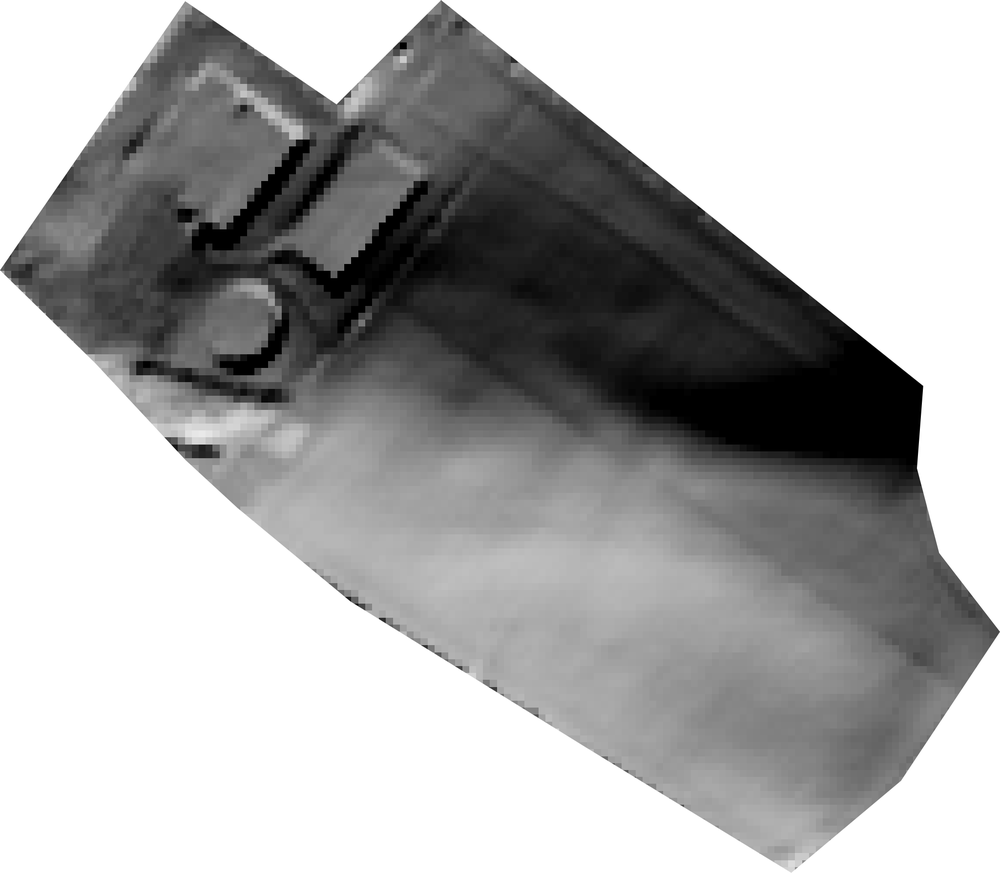 | Area: 3.9 ha Centroid: 50.4449° N, 3.6990° W Elevation (mean): 40 m Slope (mean): 4.7° Dominant aspect: E Topographic Wetness Index: 16.8 Landform: Flat 27% · Ridge 45% · Valley 28% Dominant Keyline Zone: 2 |
Flat 27% | Ridge 45% | Valley 28% |
Landform composition (proportion of parcel area)
Land Health Score sits mid-band with energy capture as the constraint
Tigger's Bouncing Field is a solidly functioning paddock with one clear ceiling on what it can do. The Land Health Score of 5 (mid) puts it just below the middle of the property's grassland parcels, with all four processes working but none of them excelling. The water cycle is doing the heavy lifting here; the mineral cycle and community diversity are steady; the bottleneck is how much sunlight the sward is converting into living plant material. Water Cycle Index of 83 percent confirms infiltration and retention are sound, Mineral Cycle Index of 71 percent shows litter is breaking down and nutrients are turning over, Community Diversity Index of 56 percent indicates a reasonable mix of species, and Energy Flow Index of 68 percent is the figure pulling the whole composite down. In plain terms, the soil is drinking the rain and the biology underground is working, but the canopy above ground is not capturing as much light as the field's position and water status would allow.
The ridge-and-valley split inside one parcel explains a lot
This is one of the more topographically complex parcels on the property, and that complexity is worth understanding before any management changes are made. Almost half the field sits on ridge ground (45 percent ridge), with another 28 percent in valley positions and only 27 percent flat. The Keyline Zone breakdown shows roughly a fifth of the parcel in catchment ground above the natural water-gathering line (KZ1 at 19 percent) and the majority in the ridge-to-valley transition (KZ2 at 60 percent). The east-facing aspect means the field warms in the morning and is shaded by afternoon, which moderates summer water stress but also shortens effective day length in the growing months. Topographic Wetness Index of 16.8 is mildly wet by site standards, sitting above the property median but well below the genuinely wet valley fields. Practically, this means the ridge portion dries out faster than the valley portion, and a single grazing or rest decision applied uniformly to the whole field will under-serve one half or the other. The radar reading (HV at -19.8 dB) confirms the sward carries moderate structural biomass, neither thin nor especially dense, consistent with a productive but not standout pasture.
Energy capture is the leverage point and it is a recoverable one
The 68 percent Energy Flow Index is the number to focus on, and the encouraging part is that it sits in a range where management can move it without needing seed inputs or significant capital. The water cycle is already supporting the canopy; what is missing is sufficient leaf area held for long enough between defoliation events to fully use the light the field receives. Three first moves are worth considering. First, extend recovery periods on the ridge portion of the field specifically, since ridge ground at this Topographic Wetness Index typically recovers more slowly than the valley portion and tends to be the part of a mixed-topography paddock that gets repeatedly under-rested. Second, watch the timing of the first spring graze; an east-facing aspect at this elevation green-ups in the second half of the typical spring window, and grazing too early on the cooler ridge ground costs energy capture for the rest of the season. Third, if the field is currently grazed as a single unit, a temporary fence splitting ridge from valley would let each half be rested on its own schedule. Community diversity at 56 percent is the next process down and will likely respond on its own once energy flow rebuilds, through longer rest periods allowing existing species to flower and set seed before grazing returns.
The growing-season context is favourable for change this year
The weather is on your side for trying something different in this paddock. The 2025 growing season delivered 348 mm of rain at a 14.8 C average temperature, which is on the dry end of the recent eight-year range but well within the normal envelope for the site, and the three stress weeks recorded are manageable rather than punishing. The site's brittleness score of 3.4 confirms what the trajectory shows: this is forgiving country where rest reliably produces recovery, and management changes here tend to express themselves within one or two grazing seasons rather than over a decade. The trajectory to watch in next year's assessment is whether Energy Flow Index moves into the low 70s while Water Cycle Index holds at or above 83 percent. If both move together, the field is on its way to the upper part of Land Health Score 6 alongside its better-performing neighbours. If energy flow climbs while water cycling slips, that would suggest the ridge portion is being pushed harder than its recovery rate allows, and the split-management approach becomes the priority rather than an option.
Tom Kitten's Meadow
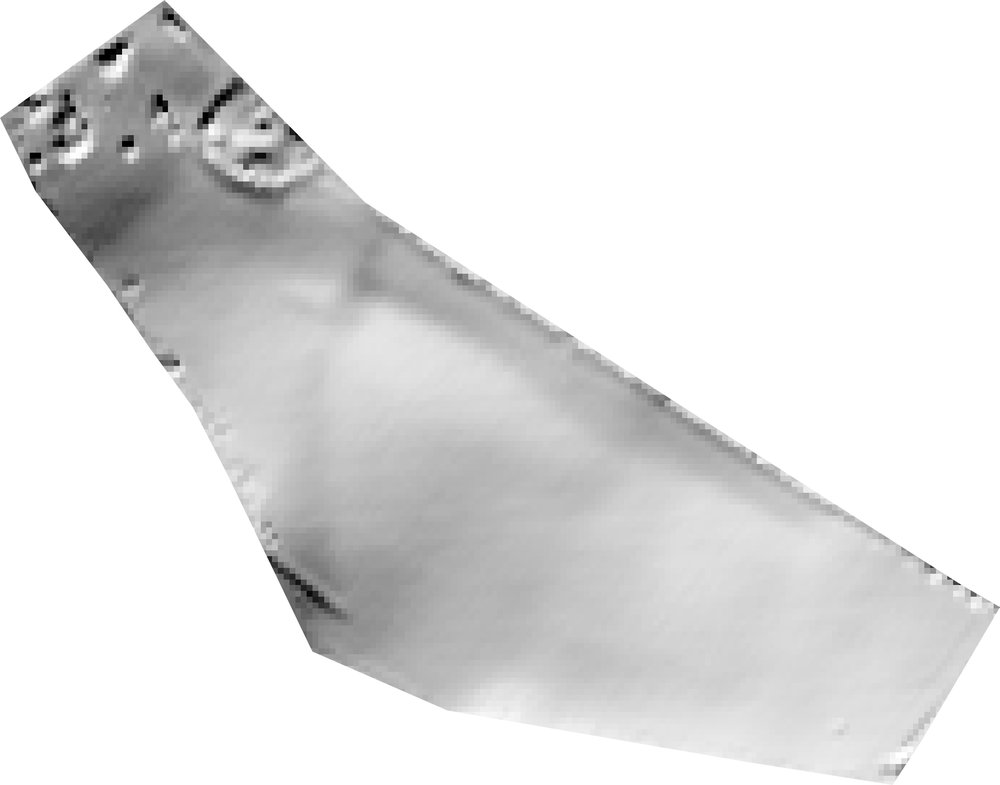 | Area: 3.9 ha Centroid: 50.4438° N, 3.6996° W Elevation (mean): 16 m Slope (mean): 9.3° Dominant aspect: E Topographic Wetness Index: 19.9 Landform: Flat 18% · Ridge 15% · Valley 67% Dominant Keyline Zone: 2 |
Flat 18% | Ridge 15% | Valley 67% |
Landform composition (proportion of parcel area)
Water is the strongest process, energy capture the weakest
Tom Kitten's Meadow is functioning well in absolute terms, with a Land Health Score of 6 (mid) that places it solidly in the recovering band. The water cycle is doing most of the heavy lifting here, infiltration and retention come through clearly in the readings, with a Water Cycle Index of 84 percent. That is no accident on this parcel. The field sits low in the catchment at 16 metres elevation with a high Topographic Wetness Index of 19.9, meaning water naturally accumulates and lingers. Two-thirds of the field reads as valley position and only 15 percent as ridge, so the landscape itself is feeding moisture into the profile rather than shedding it. The constraint is energy capture. Energy Flow Index sits at 68 percent, the lowest of the four processes and the one pulling the overall Score down from a 7 into the upper end of band 6. Mineral cycling is healthy at 74 percent and species diversity is in the mid range at 58 percent. The pattern is consistent with a meadow that has good water and reasonable biology but is not turning sunlight into biomass at the rate the site could support.
East-facing aspect and steep ground explain part of the energy gap
The terrain offers a partial explanation for the energy reading. The field faces east, with 18 percent of its area on steep ground (the highest steep fraction among your grassland parcels alongside Piglet's Patch and Poohsticks Bridge). East aspect means the canopy gets morning sun but loses afternoon radiation, which trims the daily light dose compared with south-facing neighbours like Mr Toad's Hall Field or Old Brown's Field. The steep fraction matters too, because cattle and sheep self-select away from the steepest ground, leaving uneven grazing impact and patchy regrowth. Radar structure tells a complementary story. Cross-polarised backscatter of -17.3 dB is in the middle of the grassland range, indicating a moderately dense sward, neither thin nor exceptionally bulky. Combined with the energy reading, the picture is of a sward that is present and structurally adequate but not capturing the full daylight envelope the site offers. A south-facing field with the same management would likely show Energy Flow Index a few points higher.
Species diversity has the most headroom for management response
Of the four processes, community diversity at 58 percent is where management can move the needle most quickly. The water cycle is already strong and structurally constrained by the landscape position, mineral cycling is healthy, and the energy gap is partly explained by aspect and slope that you cannot change. Diversity, however, responds to grazing pattern and rest, and the field's wet valley position with good moisture availability is exactly the niche where a wider species pool can express itself if given the chance. The first move on this field is rest timing. Extending recovery between grazing events, particularly through late spring and into early summer when more species are trying to flower, will let what is already in the seedbank express and self-seed. Tom Kitten's Meadow sits adjacent to several higher-scoring fields (Mary's Garden, Bo-Peep's Sheep Field, Little Boy Blue's Haystack) which can serve as on-farm seed donors. Cutting hay with ripe seed heads from those neighbours in late summer and spreading it onto Tom Kitten's Meadow during a high-density grazing pass is a low-cost, low-risk way to lift diversity over two to three seasons. Worth investigating before considering any purchased seed.
What to watch in the next cycle
The trajectory to track is whether the Score moves into band 7 over the next two assessments. The water cycle is unlikely to improve further (it is already near its ceiling for this landscape position), so any gain will come from energy capture and diversity. If diversity climbs above 65 percent and energy flow reaches the mid-70s, the field will cross into band 7 without needing any change to the water cycle. The east aspect and steep fraction set a soft ceiling on energy, so expecting it to match the south-facing fields would be unrealistic, but a meaningful lift from the current 68 percent is well within reach with grazing changes alone.
Wee Willie Winkie's Meadow
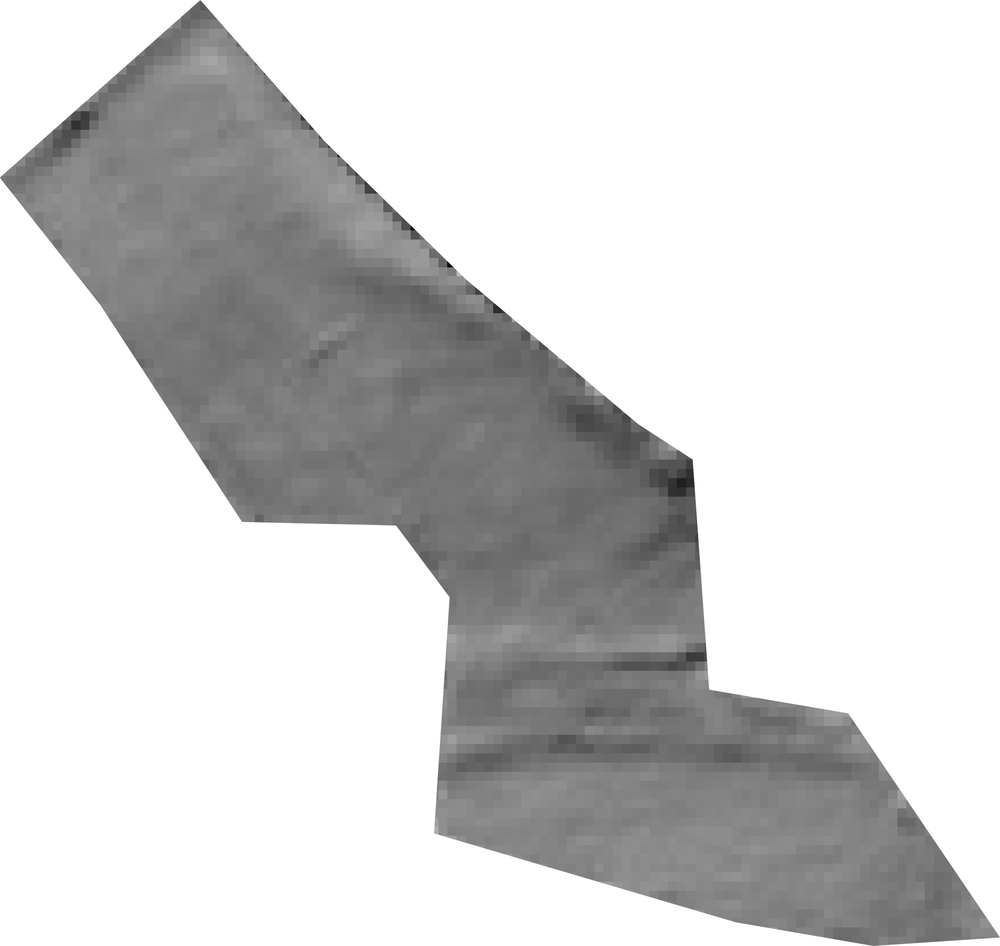 | Area: 1.5 ha Centroid: 50.4514° N, 3.7118° W Elevation (mean): 55 m Slope (mean): 7.5° Dominant aspect: E Topographic Wetness Index: 17.4 Landform: Flat 42% · Ridge 43% · Valley 15% Dominant Keyline Zone: 2 |
Flat 42% | Ridge 43% | Valley 15% |
Landform composition (proportion of parcel area)
This is one of the stronger meadows on Wilder Wood Farm. The current Land Health Score sits at 6 (mid), placing it among the top quartile of grassland parcels on the property, and the underlying processes tell a coherent story of land that is working well. Water infiltrates and is held, mineral cycling is active, energy capture is solid, and the only process that sits noticeably below the others is species diversity. For a 7.5 percent slope meadow with a ridge-and-flat structure facing east, this is roughly the profile you would expect from competent grazing management on reasonable ground. The four process scores in 2025 read 92 percent for water cycling, 79 percent for energy flow, 80 percent for mineral cycling, and 65 percent for community dynamics. The 27 point gap between water and community is the diagnostic signal worth dwelling on. Water and minerals are at or near the reference ceiling for grassland of this type, energy capture is healthy, and the diversity of plant species (with their associated insects, microbes, and root architectures) is the process with the most room to grow.
The landscape position is unusually favourable for water
The meadow sits at 55 metres elevation with a moderate east-facing slope, 43 percent ridge, 15 percent valley, and 42 percent flat ground. Seventeen percent of the field falls in Keyline Zone 1 (the catchment band above the highest conservation channel) and 58 percent in Keyline Zone 2 (the primary production band). That mix is genuinely good: water arrives from the catchment portion, slows across the flat and ridge sections, and has time to infiltrate before reaching any valley draw. The Topographic Wetness Index of 17.4 is in the moist range without being waterlogged. A water cycle score of 92 percent on this kind of ground is what well-managed grassland on a forgiving Devon landscape should look like. The east aspect helps: morning sun dries dew quickly (reducing fungal pressure), afternoon shade reduces evaporative loss in summer. The radar signal of -17.2 dB HV backscatter sits in the structurally dense grassland band, indicating real standing biomass rather than thin or recently grazed sward. Water is not the constraint here, and there is no evidence of compaction interfering with infiltration on the flat sections.
Species diversity is the limiting ecosystem process
Community dynamics at 65 percent against water at 92 percent is the classic profile of a productive, well-grazed meadow whose botanical composition has consolidated around a relatively narrow species pool. Nothing is wrong, the sward is functioning, but the toolkit of plants available to respond to drought, flood, parasite cycles, or shifts in grazing pressure is thinner than the underlying water and mineral capacity could support. On non-brittle ground like this (brittleness 3.4, with reliable Devon moisture), rest plus careful grazing impact will let existing species express, flower, and self-seed before any thought of imported seed. The first move is to extend recovery periods on this paddock by a week or two in the spring and early summer flush, allowing the wildflower and herb component already present in the seed bank to reach seed set. A second move worth considering is deferring this meadow from the rotation for a single full season once every three to four years, taking it out of grazing from April through August to allow a full reproductive cycle for slower-establishing species. Given the favourable landscape position and the strong water and mineral foundation, this is a paddock that would respond quickly to rest. On-farm hay transfer from any more diverse paddocks elsewhere on the property would be the next step before any thought of purchased seed.
The trajectory worth watching
The site-wide Land Health Score trajectory shows a 2023 peak at Score 6 followed by softening through 2024 and 2025, which is consistent with the slightly drier 2025 growing season (348 mm of rain against 486 mm in 2024, three stress weeks against zero). On this meadow specifically, the strong water cycle should buffer that variability well, and the score is holding inside the Score 6 band. The single metric to watch over the next two assessment cycles is whether community dynamics rises from 65 toward 75 percent. If it does, this meadow is on track to move into Score 7 territory and become one of the showpiece paddocks of the property. If it stalls, the deferred-rest and hay-transfer approach described above is the appropriate next step rather than a more aggressive intervention.
Section 4: Methodology & Confidence
Data Sources
Source | Res. | Revisit | Role |
|---|---|---|---|
Sentinel-2 MSI | 10 m | 5 day | Optical: 12 spectral indices |
Sentinel-1 C-SAR | 10 m | 12 day | Radar: VH, VV |
PALSAR-2 L-SAR | 25 m | Annual | Radar: HV (woody biomass) |
Landsat 8/9 TIRS | 100 m | 16 day | Thermal: LST, cooling |
ECOSTRESS | 70 m | Variable | Thermal: ISS orbit |
MODIS MOD17A2H | 500 m | 8 day | GPP calibration |
GEDI L4A | 25 m | Sparse | Lidar: AGB |
SMAP L4 | 9 km | Daily | Soil moisture |
Dynamic World | 10 m | Per-scene | Land cover (9 classes) |
ERA5-Land | 11 km | Daily | Climate variables |
SoilGrids | 250 m | Static | SOC, clay, nitrogen |
UK LIDAR | 1-2 m | Static | High-res DEM |
Scoring Framework
Land Health Scoring Framework
EcoIntel scores four ecosystem processes (Energy Flow, Water Cycling, Mineral Cycling, Community Dynamics) using weighted composites of optical indices, radar structure, and soil/litter proxies. Process scores (0-100%) are converted to a 9-level EDX classification. An 8-model weather-corrected ensemble using spectral, temporal, radar, topographic, and climate predictors. Models G and H incorporate growing-season stress weeks and evapotranspiration ratio to separate weather effects from ecosystem health. Cross-validated performance: R²=0.55, MAE=11 points, r=0.79.
Confidence Assessment
Confidence reflects the length of the assessment record and the availability of calibration data. Longer records (5+ years) provide HIGH confidence because they capture inter-annual variability and reveal genuine trends rather than single-year snapshots.
Assessment period: 8 years (2018-2025). Confidence: HIGH.
What Remote Sensing Can and Cannot Detect
Can Detect | Cannot Detect |
|---|---|
Vegetation vigour, cover, seasonal dynamics (10 m) | Individual plant species |
Canopy structure and woody biomass (25 m) | Soil biology (fungi:bacteria, earthworms) |
Soil moisture trends (10 m radar) | Root depth and architecture |
Land surface temperature (70-100 m) | Soil aggregate stability |
Multi-year productivity trends | Management intent |
Carbon flux estimation | Soil chemistry (pH, nutrients) |
Ecological Knowledge Base
The diagnostic interpretations in this report draw on a curated knowledge library of ecological principles. These include:
- Aspect-based seasonal management, how solar angle, slope, and aspect influence grazing timing, recovery periods, and drought vulnerability across the landscape.
- Brittleness ecology, the relationship between rainfall variability and ecosystem management requirements, following the Savory brittleness continuum.
- Diagnostic matrix framework, structured gap-pattern analysis linking process scores to root causes and management prescriptions by farming system.
- Keyline design principles. Yeomans-based water harvesting geometry for landscape water management.
- Soil management, soil health indicators, compaction dynamics, and organic carbon management principles.
- Vegetation indicator ecology, ecological interpretation of spectral indices and their relationship to ecosystem processes.
- Regional geology and soils, soil type characteristics and their implications for land management.
These principles are applied programmatically through the diagnostic matrix and inform the site-specific interpretations throughout this report. The knowledge base is maintained by Ecological Intelligence and draws on published ecological science.
Glossary
Water Cycle Index (WCI)
| Level | Range | What this level means |
|---|---|---|
| 9Flourishing | 95-100% | The landscape acts as a sponge, rainfall infiltrates fully and soils hold steady through extreme events. |
| 8Thriving | 90-95% | Excellent infiltration with rare runoff. The water cycle is doing its job through normal storms. |
| 7Healthy | 85-90% | Good infiltration with only occasional runoff in heavy rain. Soils are mostly stable. |
| 6Recovering | 80-85% | The water cycle is working but with some runoff during storms. Foundations are sound and the room to improve is in capture and retention. |
| 5Transitional | 70-80% | A transitional water cycle, working in places, weakening in others. Targeted landscape design (keyline, swales, ponds) would unlock real gains. |
| 4Stressed | 60-70% | The water cycle is weakening across the system, frequent sheet flow and pedestals around plants signal active soil loss. |
| 3Degraded | 50-60% | Significant dysfunction in the water cycle, rills and runoff are common across the landscape. |
| 2Depleted | 40-50% | Severe weakening of the water cycle; most rainfall is lost to runoff and the soil surface is widely capped. |
| 1Collapsed | 0-40% | The water cycle has effectively collapsed, rainfall runs off immediately and erosion is severe. |
Energy Flow Index (EFI)
| Level | Range | What this level means |
|---|---|---|
| 9Flourishing | 95-100% | Peak photosynthetic capacity throughout the year, the system captures all available solar energy. |
| 8Thriving | 85-95% | Strong biomass production with a stable canopy through normal disturbance. |
| 7Healthy | 75-85% | Healthy canopy growth with only brief stress-related dips. |
| 6Recovering | 60-75% | The canopy is doing real work, with seasonal stress dips that recovery has not yet smoothed out. Energy capture is on the right side of the curve. |
| 5Transitional | 40-60% | Energy capture is uneven across the year, strong in spring, weakening in summer. Recovery management would lift this further. |
| 4Stressed | 30-40% | A thin canopy with patchy litter; the system is producing biomass but slowly and unreliably. |
| 3Degraded | 20-30% | Low photosynthetic capacity even in growing season; canopy is sparse and slow to respond. |
| 2Depleted | 10-20% | Very low photosynthesis; the canopy is nearly absent for much of the year. |
| 1Collapsed | 0-10% | Canopy has collapsed or is dominated by standing dead material. |
Mineral Cycle Index (MCI)
| Level | Range | What this level means |
|---|---|---|
| 9Flourishing | 90-100% | Rapid, complete nutrient cycling, the soil builds organic matter continuously. |
| 8Thriving | 80-90% | Strong mineral cycling with fast litter incorporation and high microbial activity. |
| 7Healthy | 70-80% | Good mineral turnover with only occasional seasonal slow-down. |
| 6Recovering | 60-70% | Mineral cycling is working but slows in dry or cold periods. The biological engine is in place, the next step is to keep it warm year-round. |
| 5Transitional | 50-60% | Litter is starting to accumulate without breaking down; cycling is uneven across the site. |
| 4Stressed | 40-50% | Poor litter incorporation, nutrients are locked in undecomposed material on the surface. |
| 3Degraded | 30-40% | Mineral cycle largely broken; bare ground and compacted surfaces are common. |
| 2Depleted | 20-30% | Active erosion is stripping soil and nutrients; cycling has effectively collapsed. |
| 1Collapsed | 0-20% | Soil mineral cycle is non-functional and nutrient cycling has effectively collapsed. |
Community Dynamics Index (CDI)
| Level | Range | What this level means |
|---|---|---|
| 9Flourishing | 85-100% | Rich functional diversity across all groups; rare species thrive. |
| 8Thriving | 75-85% | Well-structured communities with low presence of undesirable species. |
| 7Healthy | 65-75% | Healthy functional groups; rare species appear occasionally. |
| 6Recovering | 55-65% | Diversity is recovering, the foundation species are in place and the rarer functional groups are working their way back in. |
| 5Transitional | 45-55% | Some functional groups are uneven, and undesirable species are starting to gain ground. Extended recovery periods are the lever here. |
| 4Stressed | 35-45% | Key functional groups are noticeably weakening; diversity is declining. |
| 3Degraded | 25-35% | Undesirable species are common; rare species rarely seen. |
| 2Depleted | 15-25% | Functional groups are actively failing and diversity is sharply reduced. |
| 1Collapsed | 0-15% | The community has collapsed to a handful of stress-tolerant species. |
- Land Health Score
- The headline metric, a property's overall ecological condition, given as a level from 1 (Collapsed) to 9 (Flourishing) with its band label.
- Band
- The name attached to each level: Collapsed, Depleted, Degraded, Stressed, Transitional, Recovering, Healthy, Thriving, Flourishing. Each band has one fixed colour.
- EDX, Ecological Diagnostic Index
- The underlying 0-100% index from which the Land Health Score level is derived. Used in methodology only.
- EHI, Ecological Health Index
- The composite that combines the four ecosystem-process scores into the EDX value.
- Ecosystem processes
- The four functional lenses assessed on the same nine-level scale: Water Cycle, Energy Flow, Mineral Cycle and Community Dynamics.
- Evidenced · Positioned · Baseline · Documented
- Confidence language for each finding, from multiple corroborating signals (Evidenced) through to recorded but not yet corroborated (Documented). This report never uses pass / fail.
- VVB, Validation & Verification Body
- An accredited third party that verifies carbon or biodiversity claims for market use.
EDX Land Health Score
The Land Health Score classifies each property into one of nine bands. EDX is the technical name for the band number, so “EDX8 Thriving” is the same as “Land Health Score Level 8”. The entries below describe each band in detail: the ecological characteristics that define it, the typical process score ranges, and the practical steps required to move up to the next band. For an at-a-glance comparison across all nine bands see Section 1.4.1 of the Master Report; for this site’s current band see Section 2.2 of the Master Report.
See the concept introduction in Section 1.4.1 of the Master Report and Section 2.2 of the Master Report for the site-specific reading.
EDX9, Flourishing
Ecosystems not only resilient but actively improved by disturbance, with highly efficient water infiltration, negligible erosion, vigorous canopy with strong solar energy capture, and diverse communities where rare species thrive. Water cycles effectively with minimal runoff, soils remain stable under stress, and functional groups are vigorous across the full diversity spectrum. This represents the pinnacle of ecological health where the system builds capacity through interaction with its environment.
Process | Range | Characteristics |
|---|---|---|
Water Cycling (WCI) | 95-100% | Infiltration efficient; minimal runoff |
Energy Flow (EFI) | 95-100% | High live canopy; strong capture/conversion |
Mineral Cycling (MCI) | 90-100% | Soil surface stable; negligible erosion |
Community Dynamics (CDI) | 85-100% | Diverse; desirable FGs vigorous; rares present |
Path to improvement: EDX9 represents optimal function. Maintain through adaptive management that responds to system feedback, protect rare species habitat, continue monitoring for early warning signals, and share knowledge with broader community to support regional ecosystem health.
EDX8, Thriving
Ecosystem processes are efficient and mutually reinforcing, creating robust ecological health that recovers quickly from disturbance. Good water infiltration with rare erosion events, stable soils showing no active degradation, high photosynthetic biomass production, and well-structured communities with low undesirable species presence. Systems at this level maintain function through normal climate variability and disturbance events.
Process | Range | Characteristics |
|---|---|---|
Water Cycling (WCI) | 90-95% | Good infiltration; rare rills |
Energy Flow (EFI) | 85-95% | High photosynthetic mass |
Mineral Cycling (MCI) | 80-90% | Stable; no active pedestals |
Community Dynamics (CDI) | 75-85% | Good structure; low undesirables |
Path to improvement: To reach EDX9: Enhance habitat complexity for rare species, eliminate remaining stress points in seasonal dips, fine-tune intervention timing to phenological and moisture cycles, increase functional group diversity in weak areas, and build deeper soil organic matter reserves through strategic carbon inputs.
EDX7, Healthy
Good infiltration, stable soils, strong canopy growth, and healthy community dynamics characterize this band, representing solid ecosystem function suitable for sustained productivity. Water cycles are mostly effective with occasional limitations, soils are predominantly stable, photosynthesis is robust with only short stress-related dips, and functional groups are healthy with rare species appearing occasionally. This is the threshold where regenerative management typically aims to maintain or exceed.
Process | Range | Characteristics |
|---|---|---|
Water Cycling (WCI) | 85-90% | Mostly effective; occasional limits |
Energy Flow (EFI) | 75-85% | Robust growth; short stress dips |
Mineral Cycling (MCI) | 70-80% | Mostly stable |
Community Dynamics (CDI) | 65-75% | FGs healthy; rares occasional |
Path to improvement: To reach EDX8: Address seasonal stress periods with better recovery management, increase litter cover uniformity across landscape, strengthen water infiltration in limited areas, boost functional diversity in weaker zones, and refine disturbance timing to match plant vigor cycles for faster recovery.
EDX6, Recovering
Ecosystem cycles are mostly working but with limited resilience and patchy diversity, indicating improvement from lower states but not yet fully functional. Some runoff events occur during heavy rainfall, minor soil instability is beginning to show, canopy exhibits evident seasonal stress dips, and some functional groups show weakness or patchiness. Land in this band is on a positive trajectory but requires continued management attention.
Process | Range | Characteristics |
|---|---|---|
Water Cycling (WCI) | 80-85% | Some runoff events |
Energy Flow (EFI) | 60-75% | Seasonal dips evident |
Mineral Cycling (MCI) | 60-70% | Minor instability showing |
Community Dynamics (CDI) | 55-65% | Some FG weakness/patchiness |
Path to improvement: To reach EDX7: Reduce bare ground exposure through improved canopy cover and understorey density, extend non-intervention periods between operations, address weak functional groups through enrichment planting or habitat creation, improve water distribution to eliminate dry spots, and build soil organic matter through increased litter retention and reduced soil disturbance.
EDX5, Transitional
Some ecosystem processes are holding while others are weakening, creating uneven canopy cover and diversity across the landscape. Runoff is frequent during storms, localized erosion and soil capping appear in vulnerable areas, canopy is uneven with variable vigor, and undesirable species are beginning to increase. This band represents a critical threshold where management decisions will determine whether the system improves toward EDX6 or weakens toward EDX4.
Process | Range | Characteristics |
|---|---|---|
Water Cycling (WCI) | 70-80% | Runoff frequent storms |
Energy Flow (EFI) | 40-60% | Uneven canopy |
Mineral Cycling (MCI) | 50-60% | Localized erosion/capping |
Community Dynamics (CDI) | 45-55% | Undesirables creeping |
Path to improvement: To reach EDX6: Urgent need to stop degradation trend. Immediately reduce soil disturbance, dramatically increase ground cover through enrichment planting and assisted natural regeneration, address erosion hotspots with targeted interventions, extend non-intervention periods significantly, and reduce harvesting pressure to allow ecosystem recovery. This is the last easy intervention point before major restoration becomes necessary.
EDX4, Stressed
Patchy vegetation cover, stuttering ecosystem cycles, and weakening functional group integrity characterize this vulnerable state. Water infiltration is poor with frequent sheet flow across the surface, pedestals begin to appear around plant bases indicating active soil loss, canopy is thin with patchy litter distribution, and key functional groups are noticeably weakening. Systems in this band are highly vulnerable to further degradation without significant management intervention.
Process | Range | Characteristics |
|---|---|---|
Water Cycling (WCI) | 60-70% | Poor soak; frequent sheet flow |
Energy Flow (EFI) | 30-40% | Canopy thin; litter patchy |
Mineral Cycling (MCI) | 40-50% | Pedestals appear |
Community Dynamics (CDI) | 35-45% | Key FGs weakening |
Path to improvement: To reach EDX5: Major management redesign required. Cease all extractive operations and implement canopy retention, establish emergency ground cover through pioneer nurse species, address all visible erosion with mechanical and biological fixes, implement non-intervention zones for worst areas, introduce missing functional groups through assisted natural regeneration, and develop long-term soil rebuilding strategy. Expect 3-5 year recovery timeline with intensive inputs.
EDX3, Degraded
Poor water infiltration, visible erosion signals, low photosynthetic capacity, and rising dominance of undesirable species indicate significant ecosystem dysfunction. Regular runoff and rill formation occur, erosion indicators are common across the landscape, biomass production is low with slow recovery from disturbance, and undesirable species are becoming common while rare species are rarely seen. Land in this band requires comprehensive management redesign to prevent further decline.
Process | Range | Characteristics |
|---|---|---|
Water Cycling (WCI) | 50-60% | Regular runoff; rills |
Energy Flow (EFI) | 20-30% | Low biomass; slow recovery |
Mineral Cycling (MCI) | 30-40% | Erosion signals common |
Community Dynamics (CDI) | 25-35% | Undesirables common; rares rare |
Path to improvement: To reach EDX4: Comprehensive restoration program essential. Halt all extraction immediately, implement mechanical erosion control structures, establish pioneer nurse species for canopy rebuilding and soil stabilisation urgently, protect remaining seed trees as mycorrhizal refugia, consider importing topsoil for worst areas, develop 5-10 year restoration plan with staged interventions, seek expert guidance and potentially external funding. Economic returns unlikely for many years - focus must be on stopping collapse.
EDX2, Depleted
Severe weakening of water and mineral cycles, weak canopy, and failing diversity indicate land on the edge of collapse requiring urgent intervention. Little water infiltrates with most rainfall lost to runoff, active erosion with widespread soil surface capping, low photosynthetic activity producing minimal biomass, and functional groups actively failing with sharply reduced diversity. Without immediate management changes, systems in this band are likely to collapse to EDX1.
Process | Range | Characteristics |
|---|---|---|
Water Cycling (WCI) | 40-50% | Little infiltration |
Energy Flow (EFI) | 10-20% | Low photosynthesis |
Mineral Cycling (MCI) | 20-30% | Active erosion; capping widespread |
Community Dynamics (CDI) | 15-25% | FGs failing; low diversity |
Path to improvement: To reach EDX3: Emergency restoration required. Total cessation of all disturbance mandatory, intensive mechanical stabilisation of erosion features, emergency planting of nurse species and pioneer trees with mycorrhizal inoculation where networks have been destroyed, potential need for irrigation support in establishment phase, soil amendment programs to restart biological activity, professional restoration expertise essential. Timeline 10+ years, significant investment required. Consider whether restoration is economically viable or if alternative land use needed.
EDX1, Collapsed
Water runs off immediately, severe soil erosion is active, canopy is nearly absent or dominated by standing dead material, and ecological communities have collapsed toward a handful of stress-tolerant species. Flashy water loss occurs with every rainfall event, erosion is severe and ongoing, bare ground or dead vegetation dominate the landscape, and biological diversity has effectively collapsed. This represents complete ecosystem dysfunction requiring intensive, long-term restoration intervention.
Process | Range | Characteristics |
|---|---|---|
Water Cycling (WCI) | 0-40% | Flashy water loss |
Energy Flow (EFI) | 0-10% | Bare/standing dead dominate |
Mineral Cycling (MCI) | 0-20% | Severe erosion |
Community Dynamics (CDI) | 0-15% | Collapse towards few stress-tolerant species |
Path to improvement: To reach EDX2: Requires intensive, long-term restoration commitment. Engineering solutions essential for hydrological stabilisation - terracing, check dams, retention structures. Imported soil substrate and mycorrhizal inoculum likely necessary. Phased assisted regeneration with pioneer nurse species and intensive irrigation for establishment. May require 15-20+ years and investment exceeding land value. Alternative consideration: managed retreat to less intensive land use, conservation easement, or habitat restoration with public funding support. Traditional productivity may not be recoverable.
Other Terms
Term | Definition |
AGB | Above-Ground Biomass, standing plant biomass above the soil surface, estimated from PALSAR-2 L-band radar (tC/ha) |
BNG | Biodiversity Net Gain. UK planning requirement for measurable habitat improvement |
BSI | Bare Soil Index, spectral measure of exposed soil |
Catena | Soil sequence from ridge to valley |
CDI | Community Dynamics Index, structural diversity and vegetation complexity |
CIred | Chlorophyll Index Red-edge, canopy chlorophyll concentration derived from Sentinel-2 red-edge bands |
CV | Coefficient of Variation, standard deviation divided by mean, a measure of relative variability |
DEM | Digital Elevation Model, gridded terrain height data (UK LIDAR 2m used in this report) |
Dynamic World | Google Dynamic World, near-real-time 10m land cover classification from Sentinel-2 |
ECOSTRESS | ECOsystem Spaceborne Thermal Radiometer on the International Space Station, high-resolution thermal imaging |
EDX | EcoDynamic Index, 9-level classification derived from EHI |
EFI | Energy Flow Index, photosynthetic capacity and biomass production |
EHI | Ecosystem Health Index, composite score across all four processes (0-100% scale) |
EHI~ | EHI on the ground-truth scale (−140 to +120), the closest approximation to verified ecosystem health |
EOV | Ecological Outcome Verification. Savory Institute field assessment protocol for measuring ecological health outcomes |
ERA5 | ECMWF Reanalysis v5, global climate dataset |
ESRS | European Sustainability Reporting Standards. EU mandatory disclosure framework (E1 = climate, E4 = biodiversity) |
ET/PET | Actual/Potential Evapotranspiration ratio |
EVI | Enhanced Vegetation Index, improved greenness measure that reduces atmospheric and soil background effects |
GHG Protocol | Greenhouse Gas Protocol, international corporate standard for greenhouse gas accounting |
GPP | Gross Primary Productivity, total photosynthetic carbon capture (gC/m²/yr) |
GS | Growing Season, the period of active vegetation growth, typically April-October in UK temperate climates |
GT / GT* | GT = Ground Truth (in-field ecological assessment score). GT* = weather-corrected ground truth, removing assessor bias caused by weather conditions on the day of assessment |
HV / VH / VV | Radar polarisation modes. VH = vertical-horizontal (Sentinel-1, biomass proxy). HV = horizontal-vertical (PALSAR-2, woody biomass). VV = vertical-vertical (Sentinel-1, moisture/roughness) |
ISO 14064-2 | International standard for quantification and reporting of greenhouse gas emission reductions at project level |
LST | Land Surface Temperature, satellite-derived surface thermal emission, used for thermal environment characterisation |
MCI | Mineral Cycling Index, nutrient turnover and soil stability |
MOD17A2H | MODIS Gross Primary Productivity product, 8-day GPP estimates used for carbon flux calibration |
MTCI | MERIS Terrestrial Chlorophyll Index, canopy chlorophyll content from Sentinel-2 red-edge reflectance |
NBP | Net Biome Production, carbon balance after exports (tCO₂e/ha/yr) |
NDMI | Normalised Difference Moisture Index, canopy and soil water content from Sentinel-2 shortwave infrared |
NDVI | Normalised Difference Vegetation Index, greenness measure |
NEE | Net Ecosystem Exchange. GPP minus respiration |
PALSAR-2 | JAXA ALOS-2 PALSAR-2. L-band Synthetic Aperture Radar satellite for woody biomass and structural estimation |
Reco | Ecosystem Respiration, carbon released through biological activity |
RS | Remote Sensing, satellite-derived ecosystem scores, as distinct from ground-truth (GT) field assessments |
Shannon H | Shannon Diversity Index, information-theoretic measure of spectral class diversity across the landscape |
SMAP | NASA Soil Moisture Active Passive, satellite-derived surface soil moisture estimates |
SOC | Soil Organic Carbon, carbon stored in soil organic matter, estimated from SoilGrids 250m baseline |
SoilGrids | ISRIC SoilGrids 250m, global gridded database of soil properties including organic carbon, bulk density, and texture |
TNFD | Taskforce on Nature-related Financial Disclosures, framework for organisations to report nature-related risks and opportunities |
TPI | Topographic Position Index, landscape position (ridge/valley/flat) |
TWI | Topographic Wetness Index, predicted soil moisture from terrain |
VPD | Vapour Pressure Deficit, atmospheric dryness stress indicator |
WCI | Water Cycling Index, water infiltration and retention effectiveness |
Brittleness
See the concept introduction in Section 1.4.3 of the Master Report and Section 3.5 of the Master Report for the site-specific reading.
Understanding Brittleness
All terrestrial environments fall somewhere along a continuum from non-brittle to very brittle.⁴ Environments can be classified along this continuum according to how well humidity is distributed throughout the year, and how quickly dead vegetation breaks down, rapidly through biological decay in non-brittle environments, or slowly through weathering and physical breakdown in brittle ones. This distinction is fundamental because it determines which management tools will be effective and which will cause harm.
In non-brittle environments (1-3 on the scale), reliable year-round moisture supports continuous biological decomposition. Dead plant material breaks down rapidly through fungal and invertebrate activity. Rest, the absence of disturbance, is a powerful regeneration tool because biological processes operate continuously. In brittle environments (7-10), moisture is erratic and unreliable. Dead material accumulates rather than decomposing, creating fuel loads. Rest alone cannot regenerate these landscapes, planned disturbance (including animal impact) is required to cycle nutrients.
Key Management Principle
One way to think about regeneration is as cycles of impact and rest. The impact must deliver a well-timed disturbance that creates maximum positive stress. The right period of recovery and rest can then work with the consequence of the impact, plant life and soil life will now lean in.
Very non-brittle (1-2)
In very non-brittle environments, rainfall is highly reliable and biological decomposition runs continuously through the year. Risk sits at the opposite extreme to brittle land: undisturbed rest combined with high productivity can produce rank growth and litter mats, so the management lever is selective disturbance and species diversity rather than rest.
Non-brittle (2-4)
In non-brittle environments, biological processes work continuously to build soil health. The balance tips towards rest. Longer recovery periods between disturbances allow fungi, invertebrates, and mycorrhizal networks to do the heavy lifting of decomposition and nutrient cycling.
Semi-brittle (4-6)
In semi-brittle environments, the balance between impact and rest shifts. Seasonal moisture patterns mean biological processes slow during dry periods. Time disturbances to coincide with reliable moisture windows so that recovery can begin immediately.
Brittle (6-8)
In brittle environments, rest alone cannot regenerate the land. Without disturbance, dead material accumulates rather than decomposing, creating fuel loads. Planned impact, including animal impact, is required to cycle nutrients and break down standing dead material.
Very brittle (8-10)
In very brittle environments, active intervention is essential. Passive restoration cannot reverse degradation. Water harvesting, nurse species, and soil rehabilitation are required. All interventions are opportunistic; pre-position for deployment when rains arrive.
Recovery Periods by Land State
Permanent Grassland
- Grassland: Recovery between grazing events typically 30-90 days depending on season and growth rate.
- Longer rest in the growing season (60-90 days) allows root reserves to rebuild and seed heads to set.
- Shorter rest in dormancy (30-45 days) prevents excessive litter accumulation that can smother new growth.
- Soil biology responds rapidly, fungal networks can re-establish within one growing season if compaction is avoided.
Wood Pasture
- Silvopasture: Trees provide the long-term structural framework; grazing manages the understorey.
- Recovery between grazing events: 45-120 days to protect tree regeneration and understorey diversity.
- Canopy interventions (thinning, pollarding) on longer cycles: 5-15 years for broadleaf, 15-25 for oak.
- Mycorrhizal networks connecting trees and grasses are the engine of nutrient cycling, minimise soil disturbance.
Woodland
- Woodland: Recovery operates on longer timescales than open ground.
- Understorey recovery: 2-5 growing seasons after coppicing or selective thinning.
- Canopy closure after gap creation: 10-25 years depending on species and light availability.
- Deadwood retention is critical, fungi decompose fallen wood over 5-15 years, recycling nutrients into the soil.
How the Score is Calculated
EcoIntel computes brittleness from reanalysis climate data. Precipitation CV (coefficient of variation) measures month-to-month rainfall variability across all assessment years. A low CV means rainfall is evenly distributed; a high CV means it arrives in bursts separated by dry periods.
The precipitation CV is converted to a raw brittleness score using a piecewise mapping, then adjusted for ecoregion. The zone baseline reflects the regional climate norm. The final score blends the precipitation-derived value (70%) with the zone baseline (30%).
The brittleness score and precipitation CV are related but distinct measures. The CV is a pure statistical measure of rainfall variability. The brittleness score incorporates the CV but also adjusts for regional context, a CV of 0.5 in Atlantic Britain (where the baseline expectation is reliable rainfall) has different ecological implications than the same CV in the Mediterranean (where seasonal drought is the norm). The score reflects the ecological meaning of the variability, not just the variability itself.
For general illustration, the chart below shows how synthetic daily rainfall patterns differ across brittleness levels. Non-brittle climates (green) have consistent small rainfall events throughout the year. Semi-brittle climates (gold) show distinct wet and dry seasons. Brittle climates (orange) have long dry periods punctuated by intense downpours.
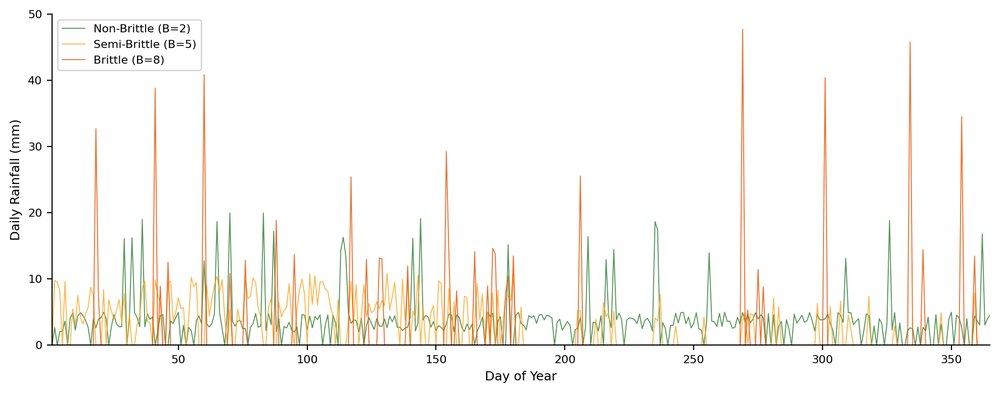
Precip CV (raw) | Brittleness (raw) | Category | Characteristics |
|---|---|---|---|
< 0.30 | 1-2 | Very Non-Brittle | Even rainfall, year-round growth, humid decomposition. |
0.30 to 0.50 | 2-4 | Non-Brittle | Rainfall well spread, short dry season. |
0.50 to 0.70 | 4-6 | Semi-Brittle | Rainfall patchy, longer dry spells. |
0.70 to 1.00 | 6-8 | Brittle | Long dry season; rainfall arrives in bursts. |
≥ 1.0 | 8-10 | Very Brittle | Rainfall erratic; ecosystem inactive for long periods. |
How to read this table alongside the headline score: the table shows the RAW brittleness score derived from CV alone. The score reported in the property profile is the FINAL ecoregion-adjusted score, blending the raw value (70%) with the regional zone baseline (30%). A site whose raw value lands in one band can be reported in an adjacent band once the regional context is applied; the headline category in the property profile is always the final classification.
What this would look like for your land
This Field Operations Profile is one of four deliverables in the EcoIntel Land Health Report suite. The demonstration property is Wilder Wood Farm; the same analysis applies to any property with at least 1 hectare and 5 years of satellite-observable history.
- Same satellite stack, same scoring engine, same prose.
- Typical turnaround: normally within hours but within 2 working days.
Understand your land by signing up today:
ecointel.io/join • accounts@ecointel.io
Land Health Reports are produced by EcoIntel’s analytical pipeline: 12-platform satellite data integration with AI-synthesised ecological interpretation, calibrated to your property’s regime and ecoregion.