Section 1: About This Report
This is a comprehensive land-health assessment, framed for corporate sustainability and ESG-disclosure use. It draws on 8 years (2018-2025) of continuous satellite monitoring across twelve sensor platforms. Sentinel-2 optical, Sentinel-1 radar, PALSAR-2 L-band radar, MODIS thermal and primary-productivity, ERA5-Land climate reanalysis, ISRIC SoilGrids 2.0, FAO GSOCmap v1.5, ESA CCI Biomass v4, NASA GEDI L4A/L4B, Hansen Global Forest Change v1.13, Copernicus Global Land Cover, and Dynamic World , integrated through ecoregion- and regime-aware scoring models.
The report covers ecosystem condition (water cycle, energy flow, mineral cycling, community dynamics), carbon capital and flux (soil organic carbon, above-ground biomass, net biome productivity), multi-channel disturbance detection, climate context, terrain and topographic position, and a structured risk-and-opportunity snapshot. Findings are mapped onto the disclosure information requirements of ISO 14064-2, the GHG Protocol Land-Sector and Removals Guidance, the TNFD LEAP framework (Locate / Evaluate / Assess / Prepare), ESRS E4 (Biodiversity and Ecosystems), and ESRS E1 (Climate Change). A disclosure-readiness dashboard is on section 3.
Carbon-stock figures (soil organic carbon and above-ground biomass) are independently cross-checked at every parcel against authoritative public reference datasets. ESA CCI Biomass, NASA GEDI, ISRIC SoilGrids, FAO GSOCmap, the Italian National Forest Inventory (INFC2015) where applicable, IPCC 2019 Refinement Tier-1 defaults, AGFORWARD (agroforestry), and Rothamsted RothC. Per-reference verdicts use a published-σ band: green within 1σ, amber within 2σ, red outside 2σ. The full per-reference and per-parcel detail is in section 9.
Other indicators, water-cycle integrity, biological function, multi-year trajectory, risk and opportunity scoring, remain in active calibration. They are direction-and-magnitude indicators rather than precision measurements. The report uses "indicative of" language wherever a satellite indicator stands in for a directly measured variable.
This is NOT a Measurement, Reporting and Verification (MRV) submission. The cross-checks are made against authoritative published references. They do not constitute formal verification under any carbon-market standard, all of which require an accredited third-party Validation/Verification Body (VVB). The outputs here are decision-support and disclosure-evidence indicators, they support corporate disclosure narratives, baseline-setting, and trajectory monitoring, and they identify where ground-based investigation will be highest-leverage.
Indicative Use Only
Thank you for being part of EcoIntel’s journey! We are building a platform to help everyone understand their land and build a healthier relationship with it. We couldn’t do it without you.
What you’re seeing is substantive and comprehensive, but it is not yet complete.
This report is indicative, not advisory. It cannot constitute formal ecological, agricultural, financial, or land management advice and should not be treated as such.
Section 2: Property Profile
Attribute | Value |
|---|---|
Property | Wilder Wood Farm |
Location | Devon, UK (demonstration property) |
Ecoregion | Atlantic Central (ATC) |
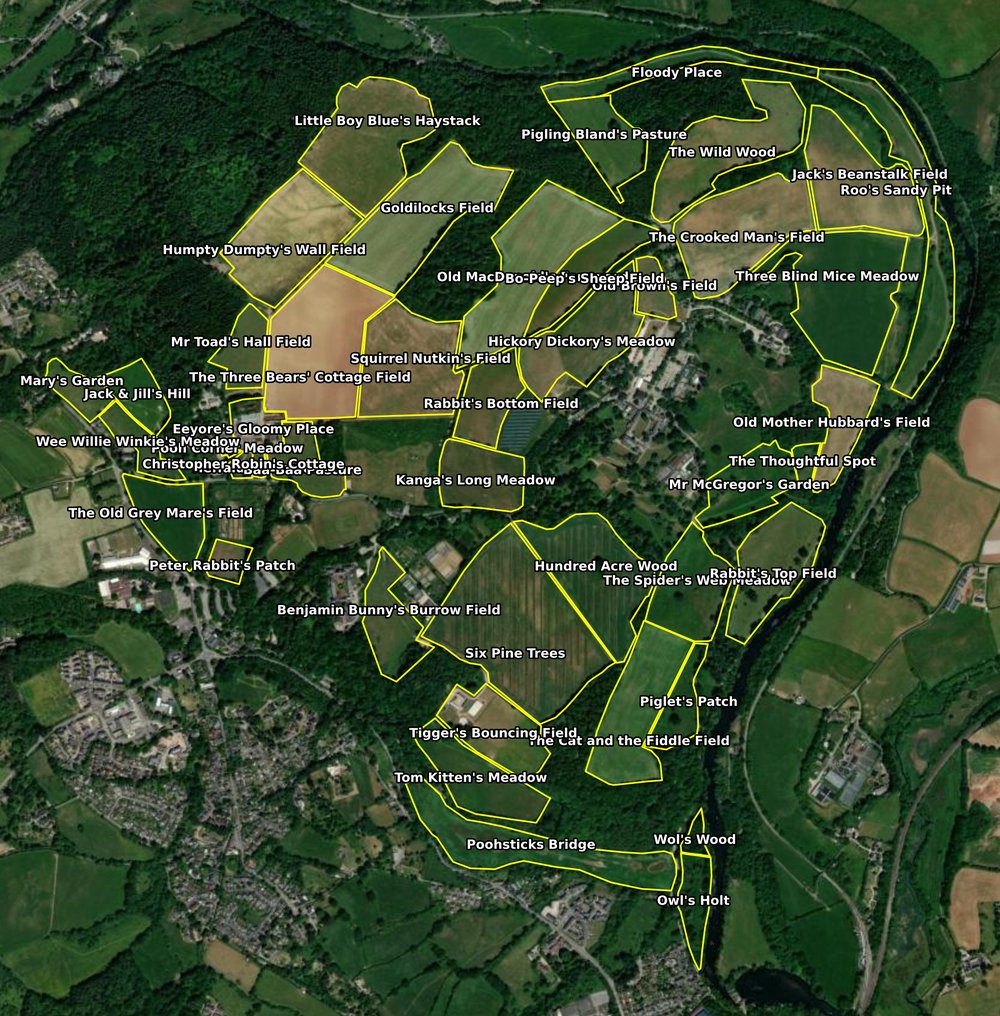
Area | 175.2 ha across 44 fields |
Stewardship | - |
Tenure | Family-owned (the Robin family, demonstration) |
Assessment period | 8 years (2018-2025) |
Brittleness | Non-brittle (3.5/10) |
Weather context | NORMAL |
Property context:
Wilder Wood Farm is a 175-hectare family-run estate in the South Davonia hills, held continuously by the Robin family across the eight-year satellite window.
The property carries an unusual breadth of land use for a single holding: thirty-eight grassland parcels running from permanent pasture through floodplain meadow to a set of twelve fields that move between arable and temporary grassland year to year, plus two agroforestry alley-cropping blocks and two wood-pasture parkland parcels tracked separately on the forest scoring reference. The variety is the property's defining character. The report treats it as one integrated land system with several tracks rather than a collection of separate experiments. The satellite record covers eight complete years, 2018 through 2025. The scoring engine uses two reference tracks in parallel because the property warrants it: the grassland ensemble covers the thirty-eight pasture and rotational fields, and a forest-track reference covers the two alley-cropping blocks (Hundred Acre Wood and Six Pine Trees) and the two wood-pasture parcels (Owl's Holt and Wol's Wood). There is no single site-wide headline number for a property this varied, and this report does not invent one. Grassland readings are stated for the grassland cohort; wooded parcels are stated on their own reference. The climate context matters. The estate sits in the Atlantic Central ecoregion with a brittleness score of 3.4 out of 10, firmly non-brittle. Growing-season rainfall across the record ranged from 314 mm (2018) to 486 mm (2024), and every year in the eight-year window classified as Normal or Favourable. No drought events, no stressed seasons. The land has been given a fair test, not a punishing one.
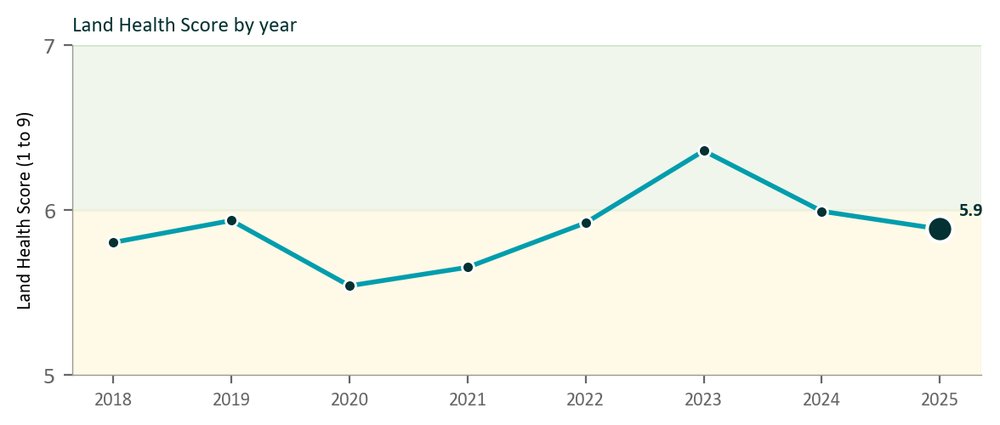
Across the eight-year record the grassland aggregate has climbed from Land Health Score 5 (low) at 58.0 percent in 2018 to Land Health Score 6 (mid) at 63.6 percent in 2023, then settled back to Land Health Score 5 (mid) at 58.8 percent in 2025. Averaged across the run, that is a rate of gain at the upper end of what published regenerative case studies report for temperate grassland on non-brittle sites. What makes the signal trustworthy is how evenly it distributes across the property. Peter Rabbit's Patch leads at Land Health Score 7, with Poohsticks Bridge, Jack & Jill's Hill, Wee Willie Winkie's Meadow, Mary's Garden, Floody Place and Roo's Sandy Pit all sitting at Land Health Score 6 (high). This is not three flagship fields dragging up an average; it is a broad, coherent lift across the pasture platform. The 2024 to 2025 softening is worth naming clearly. Growing-season rainfall dropped from 486 mm to 348 mm and stress weeks rose from zero to three, so the small step back is weather-shaped rather than management-driven. Two-to-three point movements in individual field scores across that transition are within the weather envelope for a non-brittle Atlantic site. Movements larger than five points are the ones that would warrant explanation.
Section 3: Headline Results at a Glance
Wilder Wood Farm • 175.2 ha across 44 fields • Devon, UK (demonstration property) stewardship • Baseline year 2025 • 8-year monitoring record (2018-2025) |
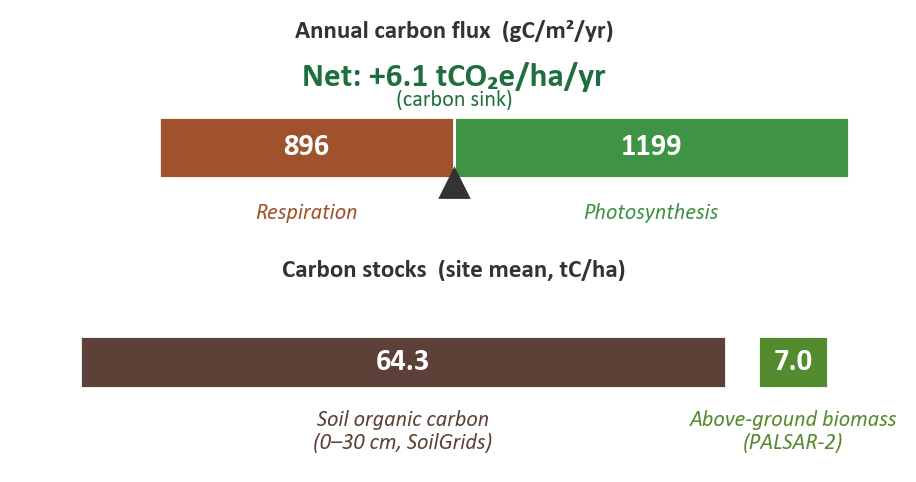
ECOSYSTEM CONDITION Score 5 Land Health, Transitional EDX5 · EHI 58.8% | TRAJECTORY Steady mid level, 8-yr record 58 disturbance detections in 2025 | CARBON BALANCE +6.1 tCO₂e/ha/yr (net sink) Cumulative +45.3 tCO₂e/ha |
CARBON STOCKS (INDICATIVE) 12490 tC site total (SOC + AGB) SOC 11265 tC • AGB 1225 tC | LIMITING PROCESS Community Dynamics 56% of reference state WCI 83 • EFI 63 • MCI 66 • CDI 54 | DISTURBANCE, 2025 58 detections S1 VH Pixel Concentrated Drop • S1 VH Step First Pass • S1 VH Step Partial Harvest • +1 more |
Note on the +6.1 tCO₂e/ha/yr flux: measured across the 2025 growing season, before the late-year partial-harvest events recorded in section 7. Next year's flux will reflect the post-harvest condition and is expected to be temporarily lower while canopy regenerates.
Independent carbon corroboration (10 authoritative references)
✓ within 1σ 5 | ~ within 2σ 3 | ✗ outside 2σ 0 | , no data 2 |
How to read: each authoritative reference dataset returns one verdict per parcel, green if our value is within 1 standard deviation of the published reference, amber within 2σ, red outside 2σ. "No data" covers references where the reference value isn't available at this site, for example a jurisdiction-specific dataset whose coverage does not extend to this country, or a satellite sampling pass that did not intersect the parcel polygon. See section 9 for the per-reference and per-parcel detail, including a "References not applicable on this site" panel naming each omitted reference and the reason.
Disclosure coverage
TNFD Nature disclosure | ESRS E4 Nature disclosure | GRI 101 Nature disclosure | SBTN Nature disclosure |
ISSB / IFRS S1 Nature disclosure | Carbon group Carbon & climate | ESRS E1 Carbon & climate | EUDR Regulatory readiness |
How to read: green frameworks are fully supported by the satellite evidence in this report (carbon stocks + flux + net land-sector balance). Amber frameworks are partially supported, the report provides the satellite baseline (ecosystem condition, climate context) but client-side inputs (transition plan, policies, actions) are required to lift them to fully provided. Grey frameworks are not yet assessed in this version of the report. Full per-row detail, including the assurance ceiling for each framework, in section 10.
This report is indicative, decision-support information, informed by the ISO 14064-2, GHG Protocol, TNFD, CSRD/ESRS E4 and ESRS E1 frameworks. It is not a statement of compliance, not assurance, and does not constitute an explicit and unreserved statement of compliance under IFRS S1. EcoIntel is not a verifier (VVB) and is not affiliated with, endorsed by, or certified by any framework body.
Top risk: The biggest thing that could go wrong on this property is a genuine summer drought landing on the ridge-top pastures at the same time as a stocking peak.
Top opportunity: The single largest upside on this property sits in roughly a dozen grassland parcels where community dynamics is the drag on everything else.
What’s needed next: Provide ESRS E4-1 transition plan, E4-2 policies, and E4-3 actions to lift the three client-data rows from Baseline to Documented (operator-attested).
Section 4: Executive Summary
Verdict
The land is healing, and the record is long enough now to say that with confidence.
Across eight years of measurement the property has moved from the low fives into a solid Score 5 (mid), touched Score 6 (mid) in 2023, and has held the higher ground since. The 2025 reading of Land Health Score 5 (mid) came out of a normal weather year with three stress weeks in the growing season, so this is what the land genuinely is, not what a wet summer made it look like. Water is working, minerals are cycling, carbon is being built. The reader should feel encouraged. The site has done the hard early work of getting the hydrology right, and the remaining constraint is a specific, addressable one rather than a systemic problem.
Diagnosis
Reading BLUE to GREEN to BLACK, the diagnosis is unusually clean for a farm this varied.
Water cycling is the strongest process on the property, running at 83 percent site-wide with only a nine-point spread across the grassland parcels, which says the water story is being managed at the whole-farm level rather than in a handful of showcase fields. Rain lands, infiltrates, and stays available to plants across almost every parcel. Mineral cycling holds close behind at 66 percent, a healthy band below water but comfortably above the threshold where nutrient turnover starts to stall. Energy capture at 63 percent is respectable, twenty-nine of the thirty-eight grassland parcels sit above 65 percent on Energy Flow. The limiting ecosystem process, and it is a clear one, is community dynamics: the diversity and functional richness of the plant community. Across 43 diagnosed parcels, 36 come back with community dynamics as the weakest of the four processes, averaging 56 percent and running ten to fifteen points below the others on almost every field. In practical terms, the sward is productive but narrow. It catches sunlight and turns it into growth well enough in a fair year, but it lacks the species toolkit that would carry the farm through a genuinely difficult one. Above all that, the carbon balance is a strong positive: the property is drawing roughly six tonnes of CO2-equivalent per hectare per year out of the air, gross primary productivity around 1,200 grams of carbon per square metre per year against ecosystem respiration of around 896. That is productive capital being built, and it is the reward of the water and biology working together rather than something happening despite constraints.
What stands out
A few observations sit in the data that the ground-level view would not easily reveal.
The first is how tight the water cycle is: only nine points separate the best and worst grassland parcels on Water Cycle Index, which is genuinely unusual on a property this varied and says the hydrological management is site-wide rather than field-by-field. The second is that the two agroforestry fields, Hundred Acre Wood and Six Pine Trees, are the highest-scoring parcels on the entire property (Land Health Score 7 mid), outperforming their landscape position on flat mid-slope ground where nothing about the topography demands they excel. The alley-cropping regime is doing real work there. The third observation is the wood-pasture parkland at Owl's Holt, which reads at Land Health Score 3 (low) with energy flow at 20 percent and a run of biomass-loss signals across recent years, this parcel has taken a knock and is now the weakest ecological reading on the property, worth flagging because the visual character of parkland can mask a functional problem underneath. And the fourth is the pattern in the bottom third of the grassland: Three Blind Mice Meadow (Score 3 mid), Goldilocks Field (Score 3 low), and the smaller weakest parcels all share the same diagnostic fingerprint. They are not water-limited, they are diversity-limited, and the fix is the same across all of them.
Action
Looking forward from this baseline, the actionable lever on this property is the diversity gap in the weakest third of the grassland.
If the community-dynamics constraint lifts over the next two to three growing seasons, the signature will be visible in the record: the ten-to-fifteen-point gap between community dynamics and mineral cycling will start to close on parcels like Three Blind Mice Meadow, Goldilocks Field, and The Cat and the Fiddle Field, and the site aggregate will move from Land Health Score 5 (mid) toward the Recovering band that was briefly touched in 2023. On the disturbed wood-pasture at Owl's Holt, the next three growing seasons are the recovery window, energy flow rebuilding into the forest-reference range as canopy structure re-establishes will be the readable test of whether the disturbance was a one-off reset or the start of a slower decline. The carbon signal is worth watching year on year as the ecological ceiling lifts, if the diversity gap closes, the sink strength should hold or grow rather than plateau.
Section 5: Site Context
Ecoregion
The site sits within the Atlantic Central (ATC) environmental zone. Reference-state scoring is calibrated against the ecological function expected for the regime, ecoregion, and brittleness combination present here.
Topography
The property reads as a river-valley pattern with mountain shoulders
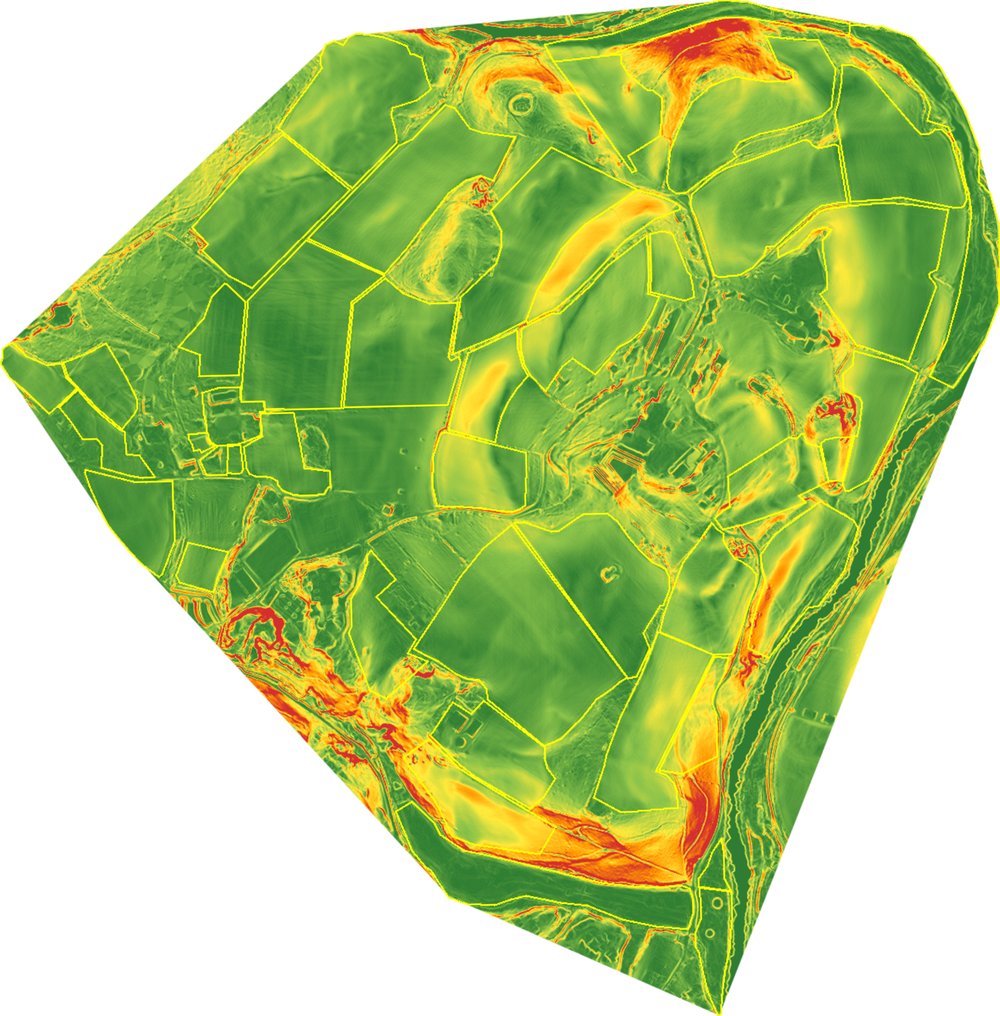
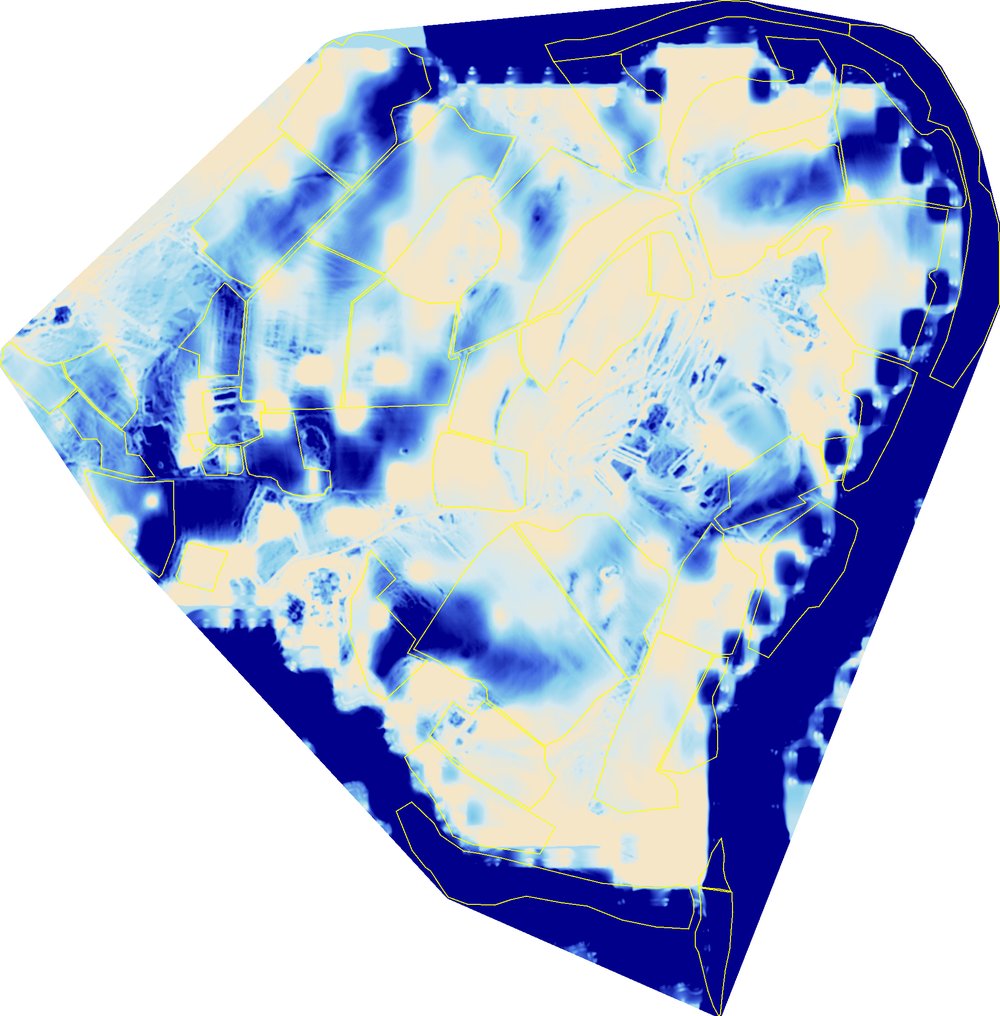
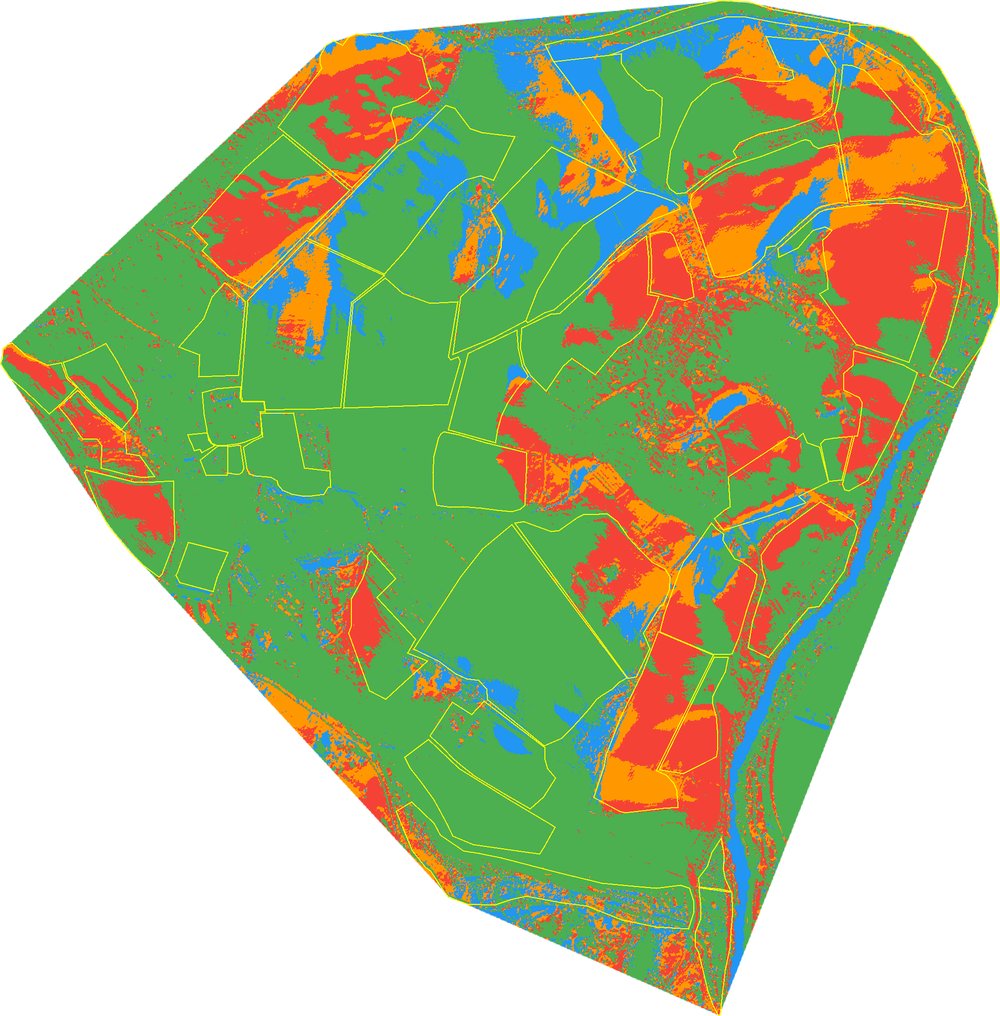
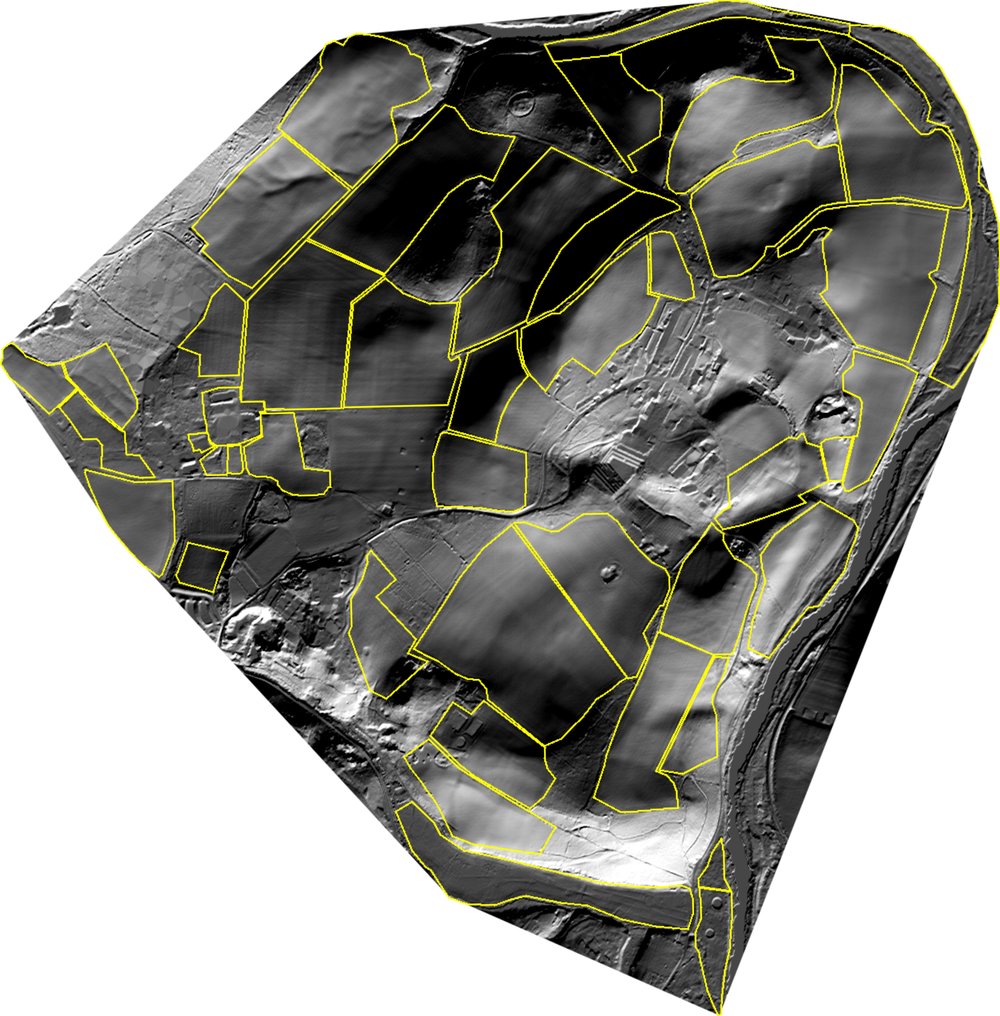
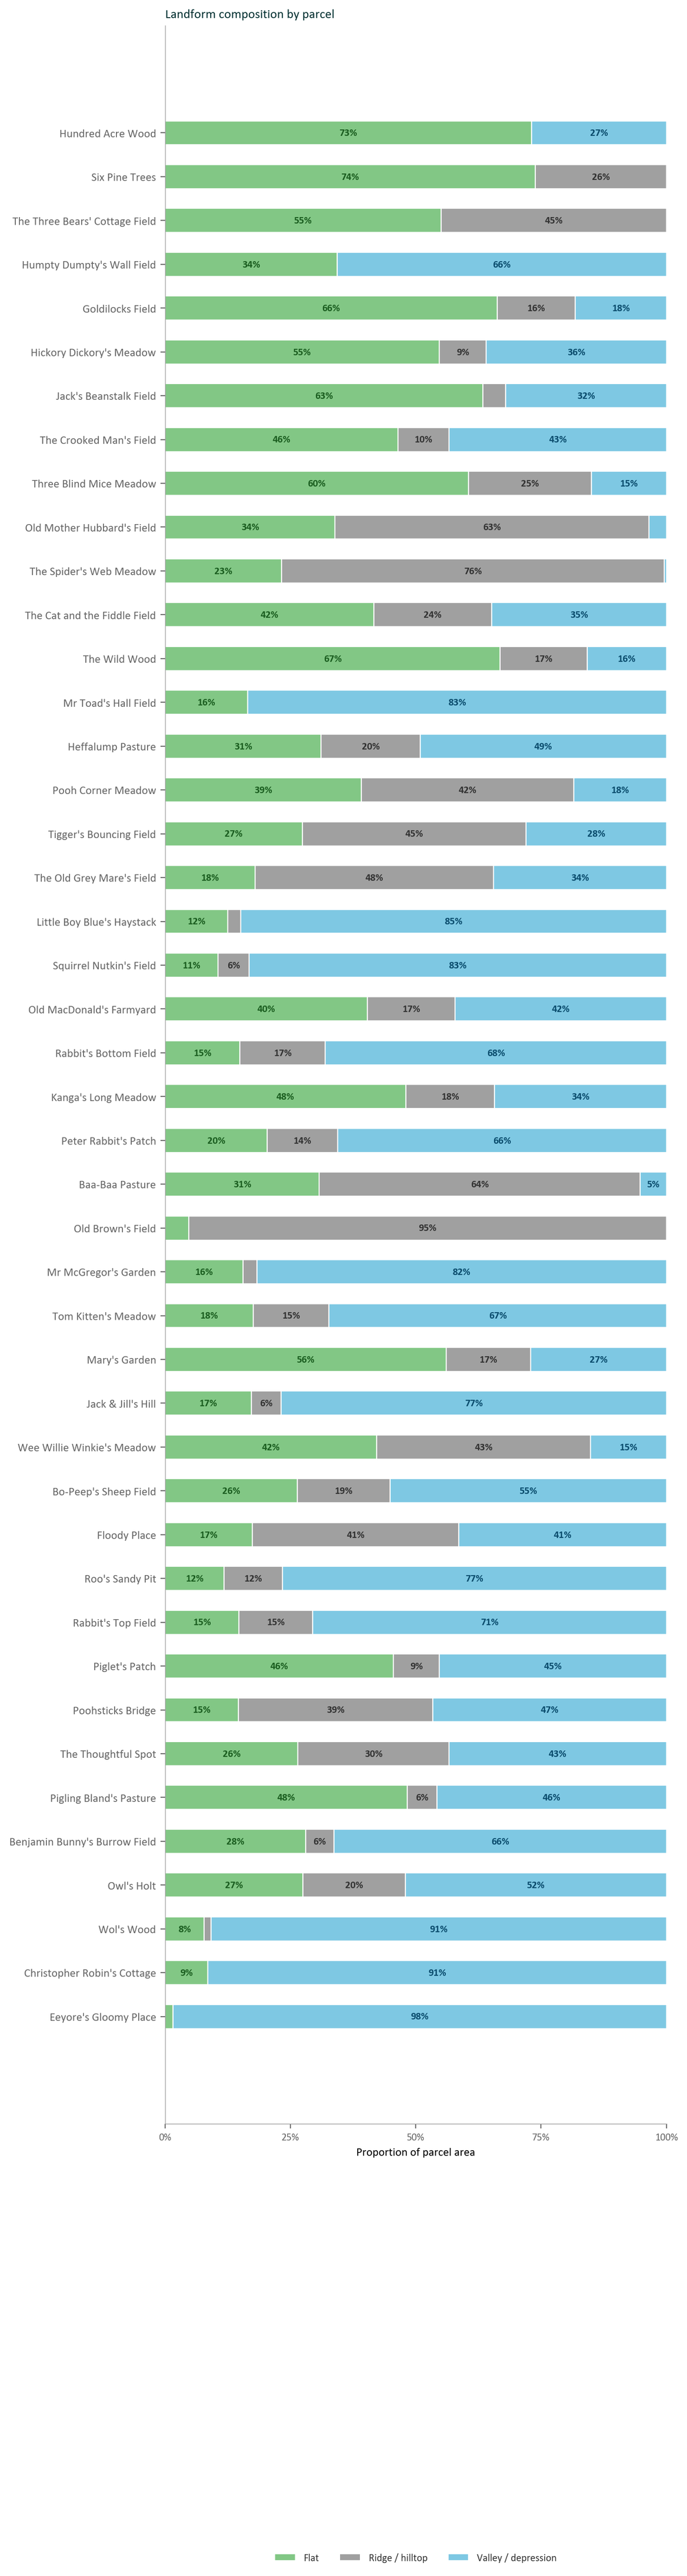
Wilder Wood Farm sits low in a river valley system, with elevations running from 6 metres near the water to 84 metres on the highest shoulder. Nearly half the property (45 percent) is valley floor and drainage line, another third is flat working ground, and roughly a fifth of the land forms the ridge and shoulder features that frame the valley. The dominant aspect is east, which is a favourable orientation in this part of Devon: morning sun to dry off dew, afternoon shelter from the strongest heat, and moderate radiation loading across the growing season. Mean slope of six and a half degrees is easy country, with only about four and a half percent of the farm crossing into genuinely steep ground. The pattern that jumps out is the split between the water-collecting bottoms and the water-shedding tops. Mean Topographic Wetness Index (TWI, a measure of where water tends to accumulate) sits at 16.4, which is on the wet side of typical for mixed farmland. The lowest-lying valley fields (Squirrel Nutkin's Field, Little Boy Blue's Haystack, Tom Kitten's Meadow, the farmstead parcel) read TWI values around 19 to 20, indicating strong water accumulation. The ridge shoulders (Old Mother Hubbard's Field, The Spider's Web Meadow, Old Brown's Field, Baa-Baa Pasture) sit at 14 to 15 with 60 to 95 percent ridge coverage. This is a textbook keyline landscape: primary ridges to hold and shed water, main valleys to concentrate it, and a broad middle band of shoulder and flat working ground between them.
Keyline zones are heavily weighted toward the middle of the property
The keyline zone distribution across the site is telling. Zone 2 (the primary ridge-and-valley shoulder band, where most keyline design work concentrates) covers 58 percent of the farm. Zone 3 (mid-slope working ground) covers 16 percent, Zone 1 (upper catchment above the highest conservation channel) covers only 6 percent, and Zone 4 (near-river or wet-flat ground) covers a token 1 percent. In plain terms, the operational heart of the farm sits in the shoulder zone where a keyline plough pattern, off-contour ripping, and swale placement would have the greatest hydrological effect. Fields like Peter Rabbit's Patch (100 percent Zone 2), Heffalump Pasture (97 percent Zone 2), Kanga's Long Meadow (96 percent Zone 2), and Three Blind Mice Meadow (96 percent Zone 2) are the classic candidates for this kind of water-spreading work. The Zone 4 signal is important to read carefully. It only appears meaningfully in four parcels: Owl's Holt (3 percent), Wol's Wood (7 percent), the farmstead parcel (21 percent) and an outbuilding parcel (29 percent). These are your genuinely wet-footed fields, the ones closest to running water or with the highest sustained wetness. Christopher Robin's and Eeyore's between them carry over 90 percent valley coverage each and TWI values in the very high band. These are not fields to push production on; they are fields to protect for their hydrological and biodiversity function, and the data broadly reflects that reading already.
The wettest fields hold their function; the ridge shoulders show the widest range of outcomes
Cross-referencing topology with the ecosystem process scores reveals an interesting pattern. The wet valley fields with the highest TWI values (Squirrel Nutkin's Field, Little Boy Blue's Haystack, Tom Kitten's Meadow) hold Water Cycle Index (WCI) readings of 83 to 90 percent, which is what you would expect and want: water is being received and retained where the landscape says it should be. The concern instead sits on the ridge shoulders. Baa-Baa Pasture (64 percent ridge, WCI 85), Old Brown's Field (95 percent ridge, WCI 86), and The Spider's Web Meadow (76 percent ridge, WCI 86) are all still holding water reasonably well, but the two struggling parcels on the property (Old MacDonald's Farmyard at Land Health Score 3, and Goldilocks Field at Land Health Score 3) are lower-slope Zone 2 fields with adequate wetness by the terrain reading but weakening across the biological processes. The topology says these fields should be productive; the ecosystem scores say something else is limiting them, and it will not be a water-availability problem. The steepest ground on the property (Poohsticks Bridge at 37 percent steep-slope area, Floody Place at 31 percent, Piglet's Patch at 29 percent, Squirrel Nutkin's Field at 22 percent) is a management priority to note. Slope thresholds in the regenerative literature put anything above 20 percent in the conservation-only category and anything above 10 percent as forestry or silvopasture ground rather than pasture. Poohsticks Bridge and Floody Place in particular carry significant portions of ground that are steeper than pasture-suitable, and the fact that Poohsticks Bridge nonetheless holds a Land Health Score 6 (mid) suggests the management there is doing well against a difficult brief. These steep parcels are strong candidates for tree integration, either widening existing shelter belts, planting scattered standards for stock shade, or transitioning the steepest sections toward silvopasture. That would work with the landscape rather than against it and would strengthen the water-holding role that the ridge-and-valley pattern is already trying to play.
 |  |
 |  |
North -facing slope | East -facing slope | South -facing slope | West -facing slope |
Aspect drives solar exposure, drying rate, and growing-season length. South-facing slopes warm earliest in spring and dry fastest in summer; north-facing slopes stay cooler and moister.
Climate
The last eight years have been kind to this property
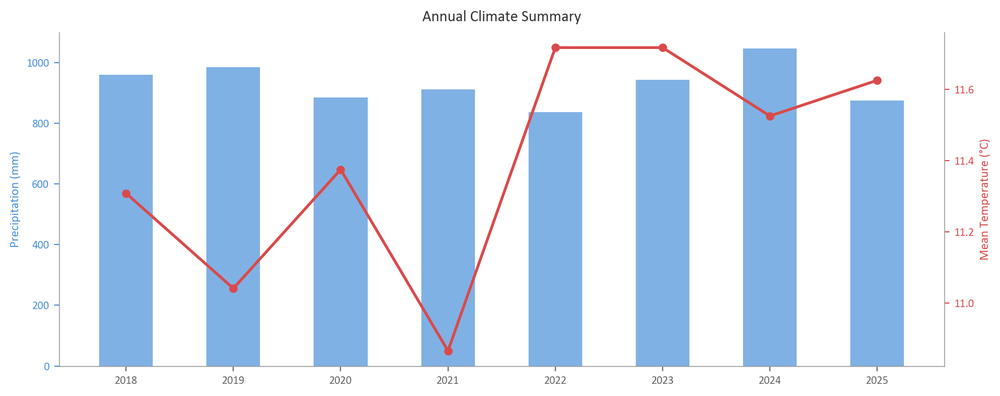
Devon has given Wilder Wood Farm a workable weather hand over the assessment period. Every year from 2018 through 2024 came in as either Normal or Favourable, with no severely stressed seasons and no drought years that would have forced destocking or emergency management. Growing-season rainfall ranged from 314 mm in 2018 (the driest year) to 486 mm in 2024 (the wettest), a spread that any Devon farmer would recognise as ordinary variation rather than climate shock. The oceanic setting and low brittleness score (3.4 out of 10) mean the land has consistent moisture through the year, which shows up in the reliably high Water Cycle scores across the property.
Stress is concentrated in summer, and always has been
Across all eight years, stress weeks cluster in summer, with a secondary peak in autumn. Winter is uniformly dormant (all twelve weeks, every year), spring is the most productive season, and summer is where the property gets tested. The 2020 and 2021 seasons stand out as the more difficult years, with 13 stress weeks each, driven by dry spring windows (six stress weeks in spring 2020, five in spring 2021). Yet even in those years the site accumulated 24 to 26 optimal weeks, more than half the growing season. This is what non-brittle country looks like in the data: bad years are still workable years, and the ecosystem processes stay intact because moisture returns before the sward loses ground.
The 2024 to 2025 flip is the pattern worth watching
The single most interesting signal in the eight-year record is the transition from 2024 to 2025. In 2024 the property had its best year of the period: 486 mm of growing-season rain, zero stress weeks over the full year (7 stress weeks fell outside the growing season), 32 optimal weeks, and a Favourable classification. In 2025, growing-season rain dropped to 348 mm and stress weeks appeared in spring and summer. Land Health Scores across the site dipped from 6.2 in 2023 to 5.7 in 2024 and 5.6 in 2025. Some of that dip is genuine (particularly at Owl's Holt, where a canopy disturbance event compounded the weather signal), but a portion is simply the sward absorbing a drier finish after a very wet lead-in. This is exactly the kind of context that matters when reading single-year Score changes.
The climate resilience read is good, with one caveat
Non-brittle country in the Atlantic Central ecoregion is among the most forgiving land in Europe from a management perspective, and the eight-year record confirms it. No year in the period pushed the property into severe stress, growing-season length is stable, and the seasonal signature (dormant winter, productive spring, tested summer, mixed autumn) is holding its shape. The caveat is that summer stress weeks have been present in every year of the record, ranging from 2 to 6 per summer, and the two years with the driest springs (2020 and 2021) produced the weakest Score readings of the eight-year window. If Devon's summer rainfall becomes less reliable over the coming decade (a plausible trajectory under regional climate projections), the fields that already read weakest, those in the lower right of the score table like Three Blind Mice Meadow, Goldilocks Field, and Old MacDonald's Farmyard, will feel it first. Building infiltration capacity and shade cover on the more exposed south-facing and west-facing parcels is the resilience investment that pays best against this specific risk profile.
A fair test, drier than the last two years but well within normal
The 2025 growing season delivered a fair, if slightly harder-working, year for Wilder Wood Farm. After two unusually kind seasons in 2023 and 2024, the land had to earn its keep in 2025. Growing season rainfall came in at 348 mm, down substantially from 486 mm in 2024 and 360 mm in 2023, and closer to the drier end of the eight-year record (2018 sat at 314 mm, 2022 at 340 mm). Temperature ran warm at 14.8°C, the hottest growing season on record for the site alongside 2018 and 2023, and the ET/PET ratio of 0.51 was the lowest of the eight years, meaning the atmosphere was pulling more water out than the land was comfortably supplying. The verdict is a normal year on a non-brittle Atlantic site, three degrees of stress harder than 2024, but nowhere near a drought year.
Spring and summer carried the stress, autumn recovered well
The stress was not evenly distributed through the year, which matters for reading the scores. Spring opened well after winter dormancy but then hit a three-week dry patch in weeks 11 to 13 (late March into early April), just as pastures were trying to get their first growth flush away. The main growing window from mid-April through late June was strong, with ten weeks of optimal conditions back-to-back. Summer was where the year showed its teeth: two short but sharp low-moisture stress periods bracketed the main summer growth, one in late July (weeks 31 to 32) and another in mid-September (weeks 38 to 39). Autumn then recovered handsomely, delivering nine optimal weeks and closing the year on a strong note for late-season regrowth, litter cycling, and root reserves going into dormancy.
Read the 2025 scores as a slight step back from a very good 2024
Land Health Score movements between 2024 and 2025 should be read against this weather backdrop. The site-wide score for the grassland parcels ticked down from Score 5 (high) at 59.9 percent in 2024 to Score 5 (mid) at 58.8 percent in 2025, a movement of roughly one percentage point. That is exactly what a drier, warmer, higher-VPD (Vapour Pressure Deficit) year produces on a non-brittle Atlantic site: water-cycle scores hold up (the land infiltrates and retains rainfall reliably), but energy flow and community dynamics soften slightly because the growing weeks were shorter and hotter than the prior two years allowed. Any field showing a two- to three-point drop between 2024 and 2025 is almost certainly weather-driven and not a management concern. Fields showing five points or more of decline warrant a closer look, because that magnitude of movement is larger than the weather alone would explain on a site of this brittleness class.

Brittleness
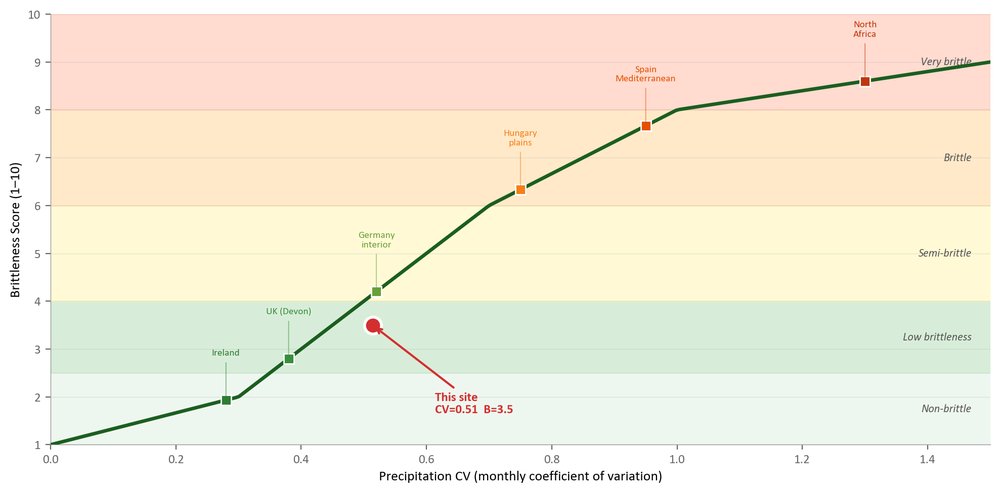
Brittleness describes how an environment responds to rest. The concept originates with Allan Savory and is computed by EcoIntel from the coefficient of variation in monthly rainfall, adjusted for the ecoregion baseline. Non-brittle environments (scores near 1) have year-round biological decay and recover readily under rest alone. Semi-brittle environments (around 5) have seasonal moisture variability with decay slowing in dry periods; rest works but timing matters. Brittle environments (toward 10) have long dormant phases and require periodic disturbance to maintain ecosystem function. The site's position on this continuum frames every management decision about rest, disturbance, and recovery period.
This site scores 3.5/10 (non-brittle). At this position on the brittleness continuum, biological decay operates year-round and management decisions on rest, disturbance, and recovery period are framed accordingly.
Section 6: Ecosystem Condition Evidence
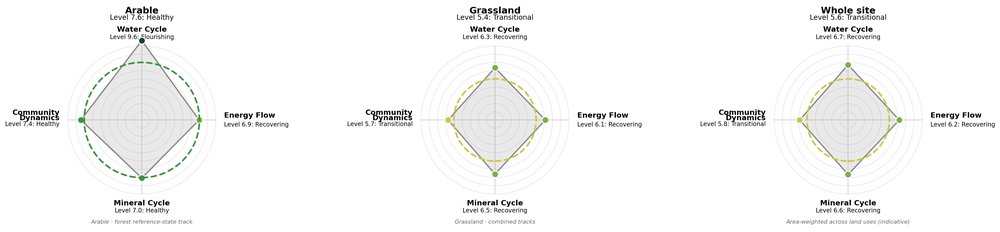
This section sets out the evidence for the site's ecological condition, organised by the four core ecosystem processes: water cycling, energy flow (canopy productivity), mineral cycling, and community dynamics (structural diversity). Each process is scored separately so the reader can see which part of the system is limiting and which is performing.
Each score is benchmarked against the reference state expected for a healthy ecosystem of this regime, ecoregion, and brittleness combination. The composite of all four scores maps onto the nine-level EDX classification (Collapsed → Flourishing) that the report's headline EDX number describes.
The narrative below is organised by colour band. BLUE (water), GREEN (living systems, covering energy flow and mineral cycling), and BLACK (carbon and productivity), and the section closes with multi-year, per-pixel EDX maps that show how the classification has shifted across the assessment window.
BLUE. Water Cycle
Water cycling is the strongest process on this property
Water is doing its job across Wilder Wood Farm. Rain lands, infiltrates, and stays available to plants in the great majority of parcels, which is exactly what you want on a mixed Devon property with the range of slopes and aspects here. The Water Cycle Index sits at 83 percent across the site, comfortably above the threshold where hydrological function starts to compromise everything else, and the spread from best to worst grassland parcel is only nine points. That tightness matters. It says the water story is being managed at the whole-property level, not just in a few showcase fields. The grassland parcels cluster in a healthy band. Wee Willie Winkie's Meadow and Mary's Garden lead at 92 percent, with Peter Rabbit's Patch, Poohsticks Bridge, Floody Place, and Roo's Sandy Pit all at 91 percent. These are the fields where infiltration, retention, and plant-available moisture are effectively at reference for lowland Devon pasture. Even the weaker readings on the grassland side sit at 79 to 83 percent (Mr Toad's Hall Field, The Crooked Man's Field, Bo-Peep's Sheep Field), which for a non-brittle site (brittleness 3.4) is still functional territory. The forest-track parcels tell a consistent story: Hundred Acre Wood at 100 percent, Six Pine Trees at 92 percent, and Owl's Holt at 80 percent. Wol's Wood reads slightly lower at 77 percent, tracking with the canopy disturbance recorded there in 2021 and 2022.
The weather has been kind, and the ground is holding it well
The last eight growing seasons have delivered adequate to generous rainfall, with 2024 in particular a very good year (486 mm of growing-season rain and zero stress weeks). 2025 has been drier at 348 mm with three stress weeks, and yet the Water Cycle Index has held. That is the diagnostic point worth naming: in a normal-to-dry year, water cycling on this property does not wobble. The evapotranspiration ratio (ET/PET) has sat in the 0.51 to 0.61 range across the record, meaning the land is using roughly half to two-thirds of the available atmospheric demand for water. On a non-brittle site that reads as ground cover and litter doing their job, keeping soil temperatures moderate and evaporative losses in check.
A handful of parcels are worth watching
Three grassland parcels sit below 70 percent and deserve attention before the pattern extends. The Cat and the Fiddle reads at 65 percent Water Cycle Index; Goldilocks Field at 64 percent; Three Blind Mice Meadow at 64 percent; Old MacDonald's Farmyard at 68 percent. These four also carry the lowest overall Land Health Scores on the grassland side (Score 3 to 4), which means the water constraint is not isolated. It is showing up together with weak mineral cycling and low community diversity, the pattern the diagnostic framework calls uniform-low. On this kind of property that usually points to compaction, poor ground cover, or a legacy of continuous grazing on the same footprint. Worth walking these four in wet conditions to see where water is sitting on the surface rather than moving into the profile.
Landscape position explains most of the variation
The topology data reveals a pattern that is easy to miss from the ground. The strongest water-cycling parcels sit in valley or valley-flat position with high Topographic Wetness Index (TWI) readings: Peter Rabbit's Patch (TWI 15.1, 66 percent valley), Floody Place (TWI 13.7, high ridge-valley mix in a keyline collector zone), and Roo's Sandy Pit (TWI 17.5, 77 percent valley) all benefit from receiving water from upslope. The weaker parcels tend to sit in ridge or ridge-flat positions where water arrives only as direct rainfall and any compaction or thin cover shows up immediately in reduced infiltration. Old Brown's Field (95 percent ridge, south-facing) and The Spider's Web Meadow (76 percent ridge) are the fields where warm-aspect exposure and ridge position combine to demand the tightest ground-cover management in a dry year. So far they are holding at 86 percent, which is a credit to how they are being run, and the reading to watch closely if 2026 arrives dry.
What to watch in the next cycle
Water cycling is not the limiting process at Wilder Wood Farm and does not need remediation across the site. The management priority is protective: keep ground cover unbroken on the ridge parcels through summer, keep hoof traffic off wet valley fields in winter, and treat the four low-scoring grassland parcels as a compaction-and-cover problem rather than a water problem in isolation. In the forest-track parcels, Wol's Wood is the one to watch as the canopy recovers from the 2021 to 2022 disturbance signal; the water-cycle reading there should rebuild toward Six Pine Trees' level over the next three years as the canopy closes back in.
GREEN. Living Systems
Living systems on this farm are the story of a property doing very well on the biology, and now hitting the ceiling that always shows up next: the diversity of what actually lives in the sward. Water is largely sorted. Minerals are cycling. The plants are catching sunlight and turning it into forage across almost every parcel. The question the data raises is whether the community of species doing that work is broad enough to carry the farm through the harder years that will come.
Energy capture is strong across the grassland
Sunlight is being caught and turned into growth across most of the working ground. Twenty-nine of the thirty-eight grassland parcels sit above 65 percent on Energy Flow, and the top of that range (Wee Willie Winkie's Meadow, Peter Rabbit's Patch, Mary's Garden, all at 75 to 79 percent) is genuinely excellent for a mixed-topography Devon farm. Growth is coming from a living, photosynthesising sward rather than from a thin veneer over bare ground, which is the pattern you would see on a farm that has been running planned grazing for some years. The year helped. The 2025 growing season delivered 348 mm of rain and four optimal growing weeks against only three stressed weeks, which is a fair test rather than a stressed one. Read against the 2024 baseline (486 mm, nine optimal weeks, no stress weeks at all), 2025 looks like a modest step back rather than a real setback. The Land Health Score of 5 (high) for the whole site reflects that: the property is holding its ground in a normal year, and the small dip from 2024's Score 5 (high) to 2025's Score 5 (mid) reads as weather, not management.
Community diversity is the constraint, and it is uniform
Species diversity is the process that is capping this farm's overall Land Health Score. Community Dynamics sits at 56 percent site-wide and is the lowest-scoring process on nearly every grassland parcel. It is not one broken field dragging the average down. Even Peter Rabbit's Patch, the top-scoring grassland at Land Health Score 7 (low), reads 68 percent on community diversity against 82 percent on minerals and 91 percent on water. The pattern is the same on Wee Willie Winkie's Meadow, Mary's Garden, and Poohsticks Bridge. The best fields have a diversity ceiling; the weakest fields have a diversity floor. At the bottom of the range this becomes stark. Three Blind Mice Meadow reads 30 percent community diversity, Goldilocks Field 33 percent, Old MacDonald's Farmyard 35 percent. On these fields the community is thin enough that the sward is running on a handful of species doing all the work. In a wet, kind year like 2024 that is invisible. In the dry summer of 2018, or a repeat of 2022's four stress weeks, a thin community is what fails first: the two or three dominant species hit their limit and there is nothing behind them.
Diversity limits show up in different ways across the farm
The community-diversity constraint is not the same problem everywhere and it should not be addressed the same way everywhere. On the top-tier grasslands (Peter Rabbit's Patch, Mary's Garden, Wee Willie Winkie's Meadow, Jack and Jill's Hill), the sward is productive and mineral cycling is strong, but the species mix is narrower than the site could carry. These are candidates for the gentlest interventions on the hierarchy. Extending recovery periods through the next full season would let the species already present flower and set seed. One or two of these paddocks deferred for a full seed cycle, then grazed hard with high stock density in the following autumn to trample seed into the surface, would broaden the community without importing anything. The mid-range grasslands (Pooh Corner Meadow, Piglet's Patch, Heffalump Pasture, and the parcels reading between 55 and 62 percent) are where on-farm seed transfer will pay best. Cutting hay with ripe seed heads from the more diverse paddocks (the species-rich margins of Old Brown's Field, sitting on that south-facing ridge, would be a good donor) and spreading it onto these mid-range fields with livestock trampling it in will do more than any purchased seed mix and costs almost nothing beyond the cutting and carting. The weakest grasslands are a different situation. The Cat and the Fiddle (community diversity 40 percent, minerals collapsed to 38 percent), Three Blind Mice Meadow, Goldilocks Field, and Old MacDonald's Farmyard are all reading a coupled weakness across community and minerals. Community diversity on these fields is not going to respond to a light-touch intervention because the mineral cycle underneath is also weakening. The order of work on these is: rest and manage grazing impact through 2026 to see what the existing seed bank offers, then hay transfer from donor paddocks through 2026 and 2027. Purchased seed should be the last option and only after two seasons of watching what the land can do itself.
The Wild Wood corner tells its own story
The four wooded parcels (Owl's Holt, Hundred Acre Wood, Six Pine Trees, Wol's Wood) are on the forest scoring track and read very differently. Hundred Acre Wood and Six Pine Trees are both at Land Health Score 7 (mid to high), which is healthy for alley-cropping on this ecoregion, and Wol's Wood has recovered from a 2024 dip back to Score 6. The one that needs attention is Owl's Holt, which has fallen from Score 4 in 2022 through Score 2 in 2024 and now sits at Score 3 (low). The disturbance record shows a run of biomass drops from 2018 through a partial harvest in 2022, and then a moderate severity event flagged in September 2025 (a 0.32 dNBR break, consistent with a partial-harvest signature rather than a clearfell). Canopy cover on Owl's Holt has slipped 2.2 percentage points year on year to 66.7 percent
BLACK. Carbon & Productivity
Living systems are rebuilding, with community diversity the pace-setter
Above the water layer, the site's green processes are working in a coordinated way. Photosynthesis and litter incorporation are both in the recovering band, with mineral cycling running a step ahead of energy capture (mineral cycling around 66 percent, energy flow around 63 percent across the grassland fields). This is the pattern you would expect on a well-managed non-brittle site: rainfall reliability keeps the water layer intact, which lets plants capture light and cycle nutrients, which in turn is starting to broaden the sward. Community diversity, the fourth process, sits at around 54 percent, and is the slowest to respond. That is normal. Species diversity always lags behind the recovery of the three physical processes, because it depends on them being in place first.
Community diversity is the site-wide constraint
The limiting process across the property is community dynamics, sitting in the recovering band around 56 percent site-wide. In plain terms, the grazing platform is functioning but the plant community is still narrower than it could be. On the top-tier fields, Peter Rabbit's Patch, Wee Willie Winkie's Meadow, and Mary's Garden, community diversity is already running in the high sixties, which shows what this land can carry. On the fields at the tail (Old MacDonald's Farmyard, Goldilocks, Three Blind Mice Meadow), diversity is closer to the low thirties, and this is where the biggest gains are available. Because rainfall is dependable here (2024 delivered nearly 490 mm across the growing season with zero stress weeks, and 2021 was similarly generous), extended rest and full seed-set periods will do most of the work on their own. Purchased seed is not the first move.
The trajectory is upward, with a few fields to watch
Of the 44 fields, 34 are improving, 3 are holding steady, and 7 are weakening. That ratio (roughly five improving for every one going backwards) is a strong signal that the overall management direction is right. The multi-year Land Health Score arc confirms it: from 58 percent in 2018 the site climbed to 63.6 percent in 2023, then eased back to 58.8 percent in 2025 as two drier growing seasons (2022 and 2025, both under 350 mm) tested the system. This is a fair test rather than a stressed year, and the fact that the top-quartile fields held their scores through it is the more informative reading. The declining seven, concentrated in Old MacDonald's Farmyard, Goldilocks, Three Blind Mice Meadow, and The Cat and the Fiddle, are the priority for closer attention in year two.
Three deflection events flagged for follow-up
Three multi-signal deflection events were detected across the site this cycle, meaning changes visible on more than one satellite channel at the same time (structural biomass on radar, greenness, and moisture together). These are worth walking. In our experience these events are usually explainable (a hedge cut, a reseed, a heavy rotation, a hay cut timed differently), but the point of flagging them is to make the invisible visible. Section 10 lists the events by field and date. The forest and agroforestry parcels (Hundred Acre Wood, Six Pine Trees, Wol's Wood, Owl's Holt) also show harvest-related signals that are covered separately under the forest-track scoring in section 7, because grassland scoring does not apply to them.
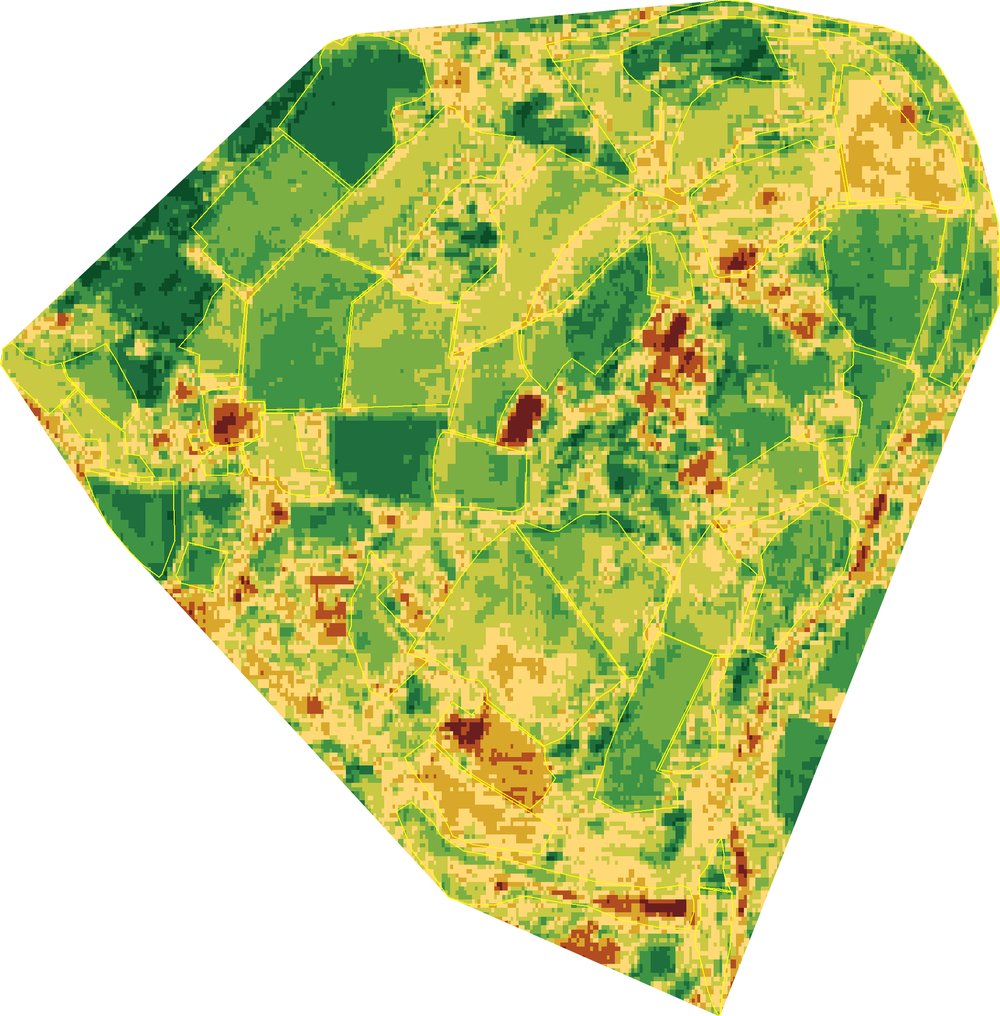
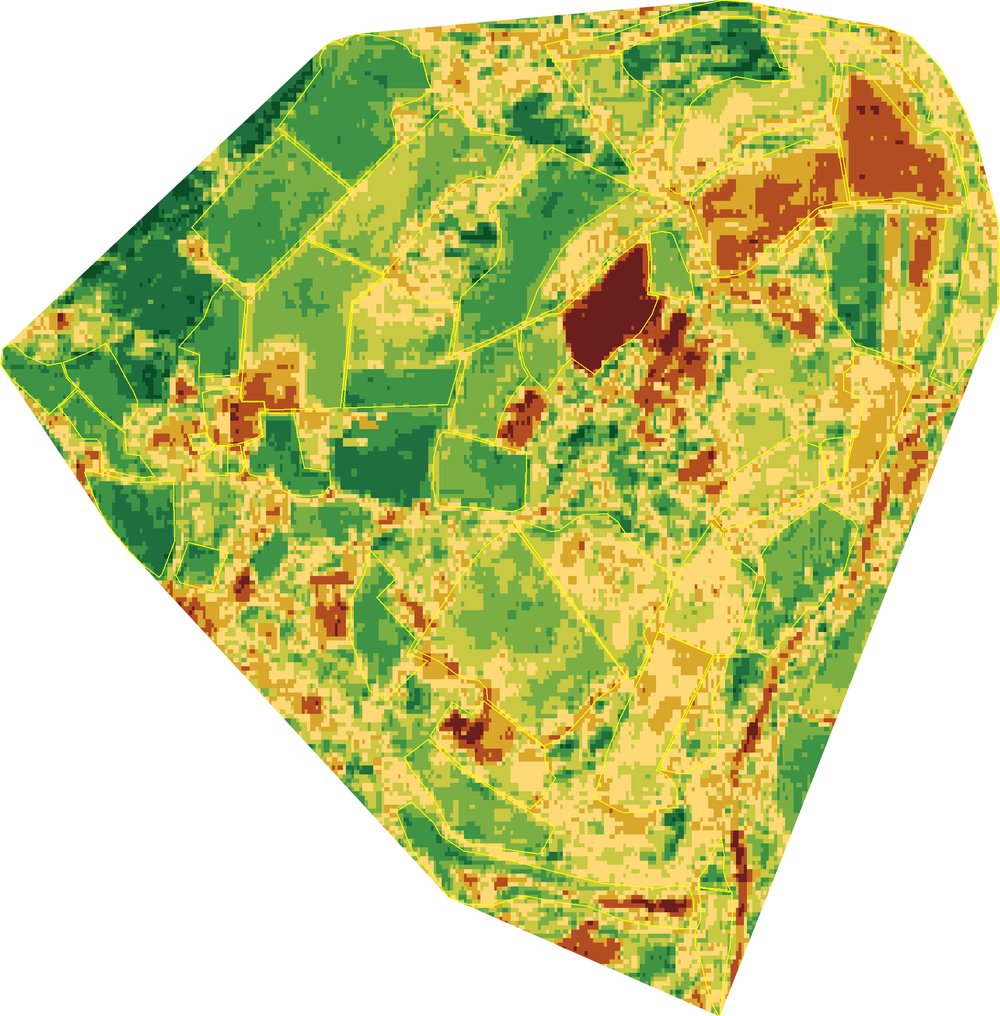
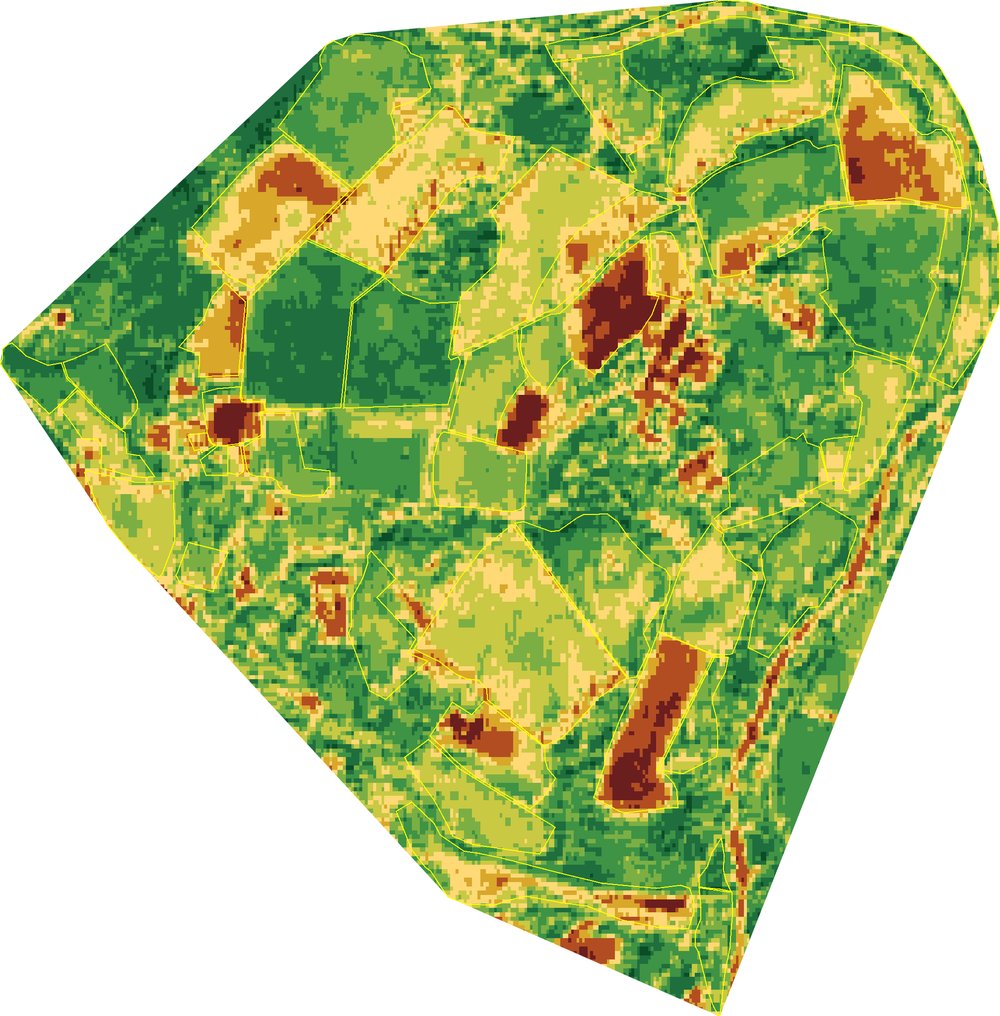
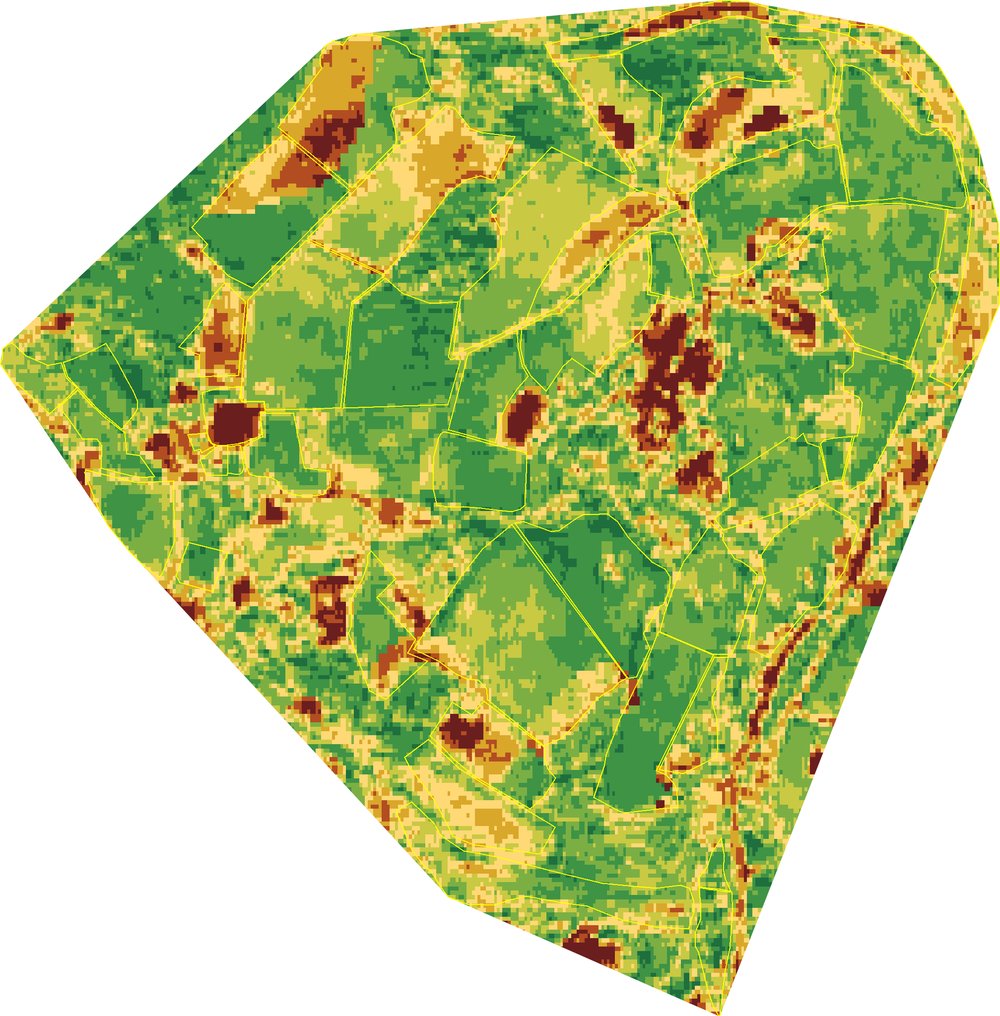
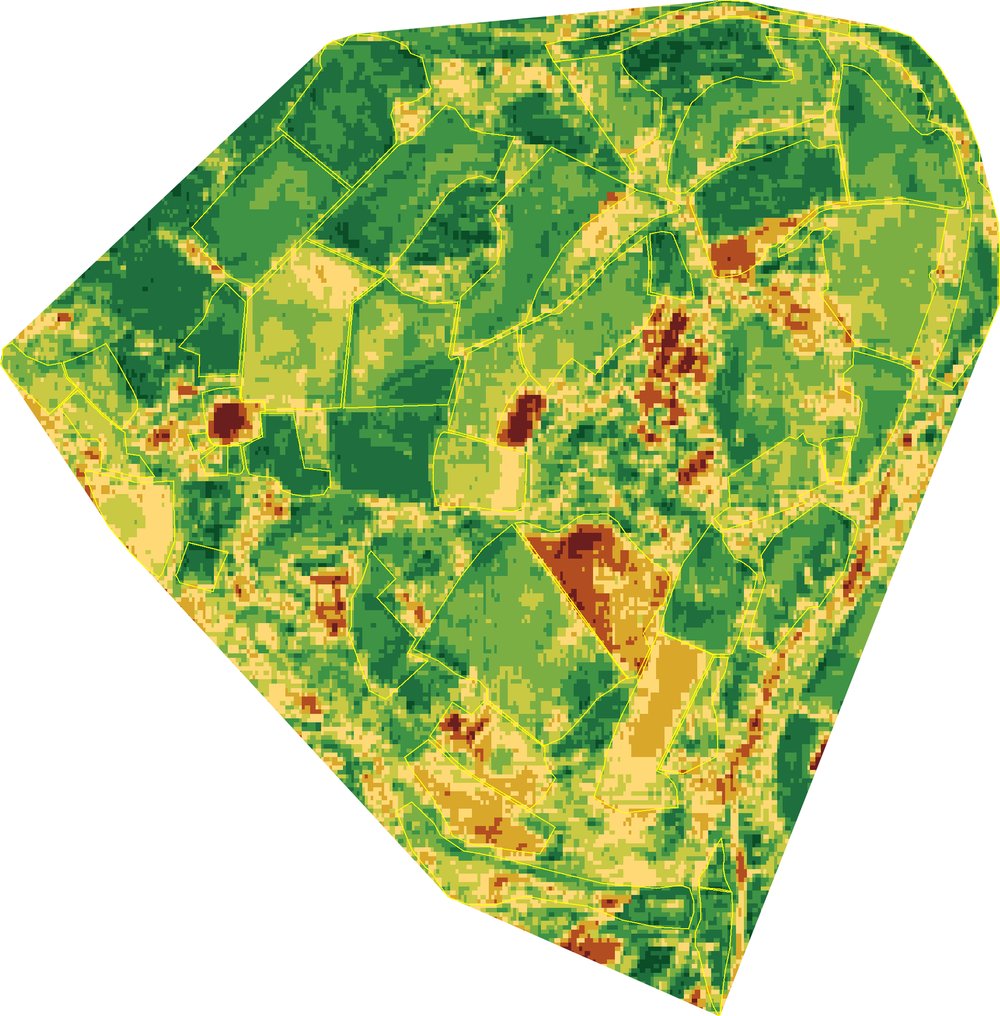
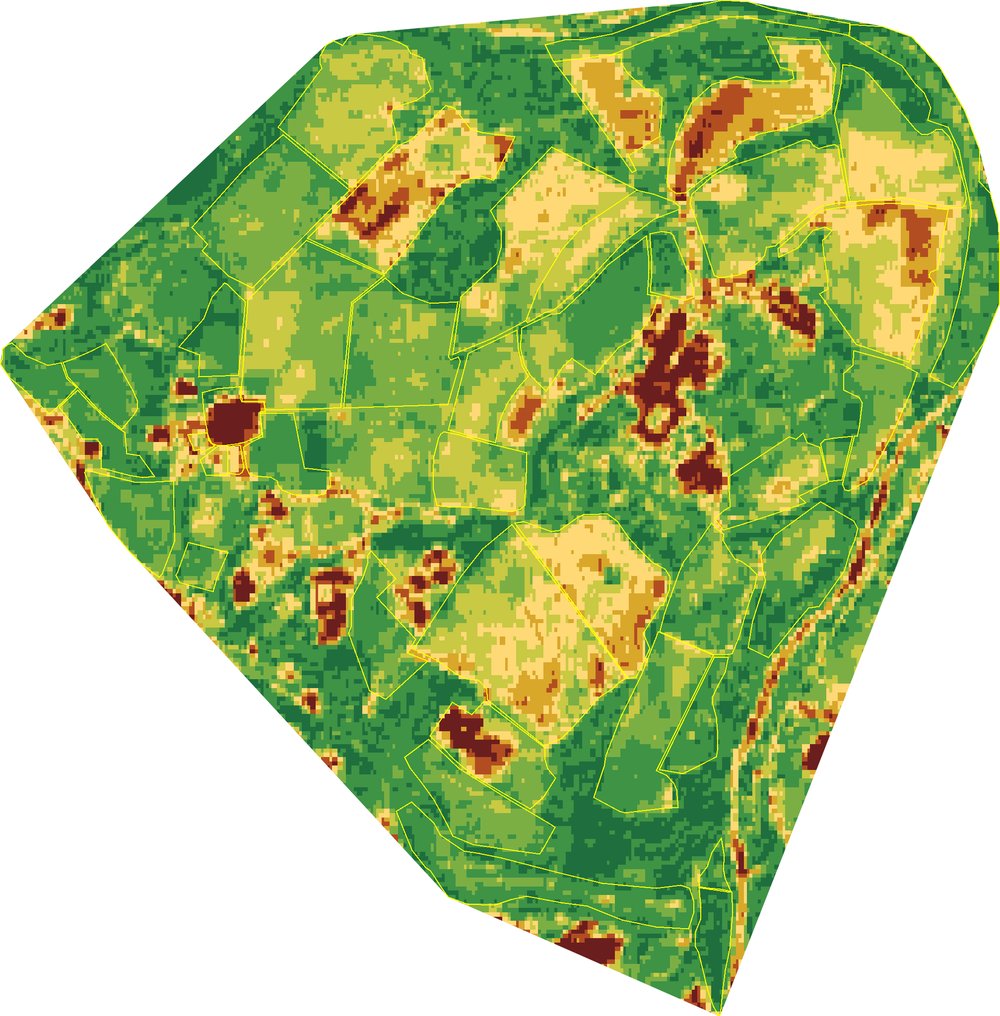
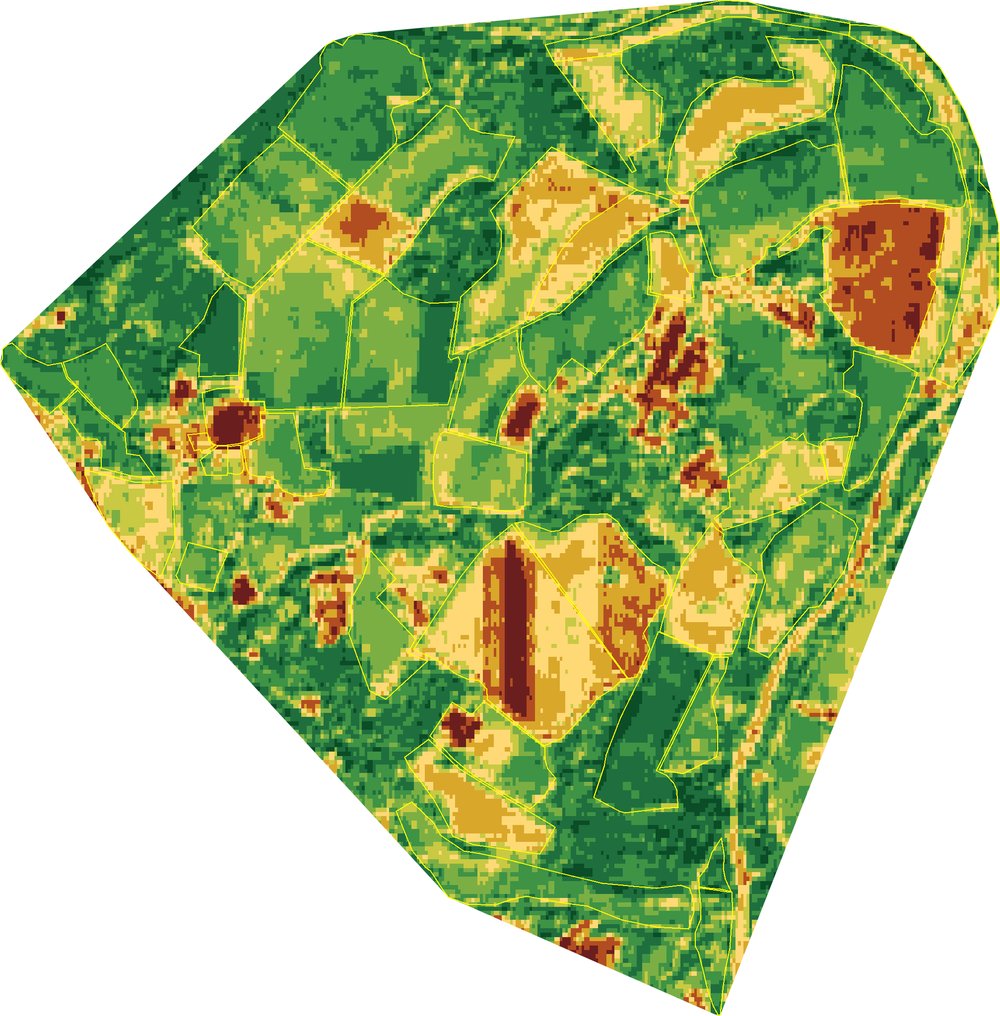
Per-year EDX classification maps
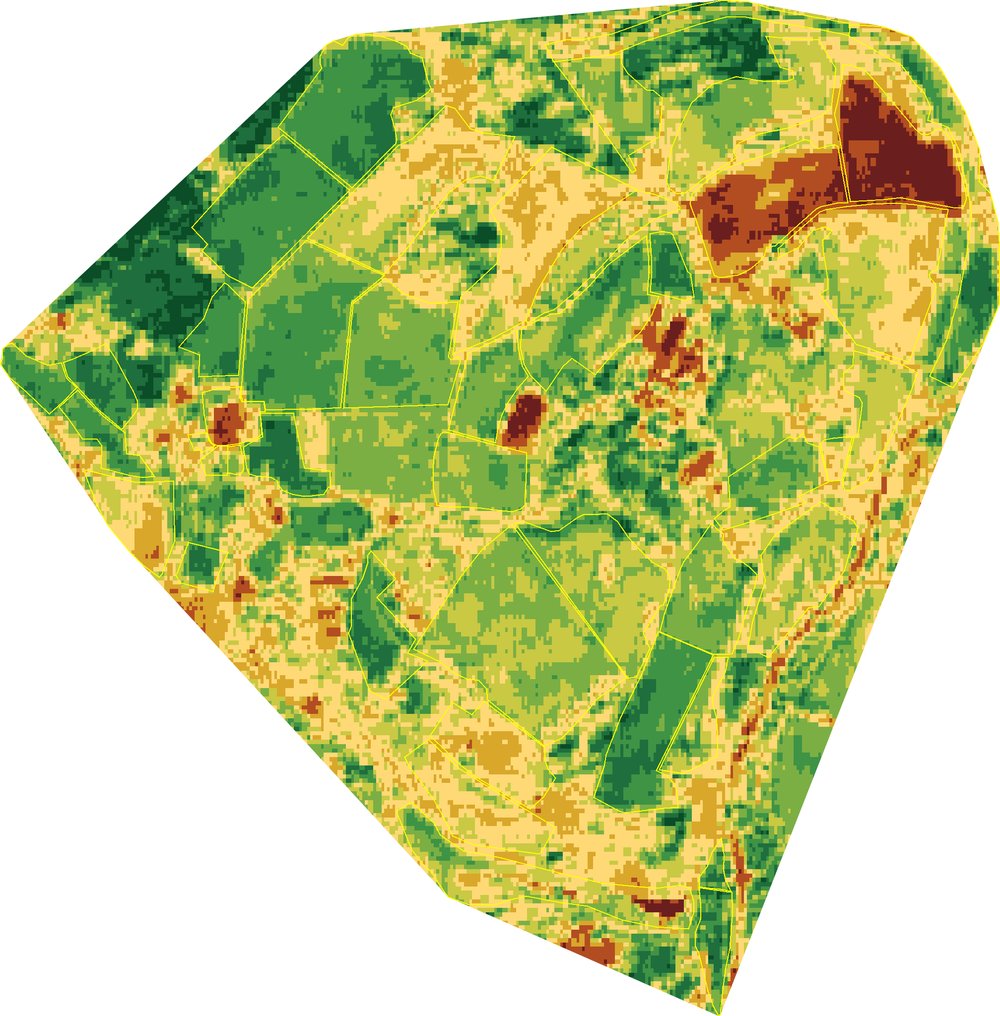
Per-pixel EDX state for each assessment year. Colours match the colour key above (red = collapsed → dark green = flourishing). Yellow boundaries trace the parcel polygons.
 |  |  |
2018 | 2019 | 2020 |
 |  |  |
2021 | 2022 | 2023 |
 |  | |
2024 | 2025 |
EDX classification, colour key
EDX9 Flourishing | EDX8 Thriving | EDX7 Healthy | EDX6 Recovering | EDX5 Transitional | EDX4 Stressed | EDX3 Degraded | EDX2 Depleted | EDX1 Collapsed |
EHI 69.2% sits within the EDX7 (Healthy) band, 0-100% is the position within the band. Two EHI numbers may appear together (e.g. "EDX7, 69.2%, ~40") because EHI~ tilde is the halo-corrected underlying signal with weather-driven noise removed (full definitions in section 13 Glossary).
Section 7: Disturbance Chronology
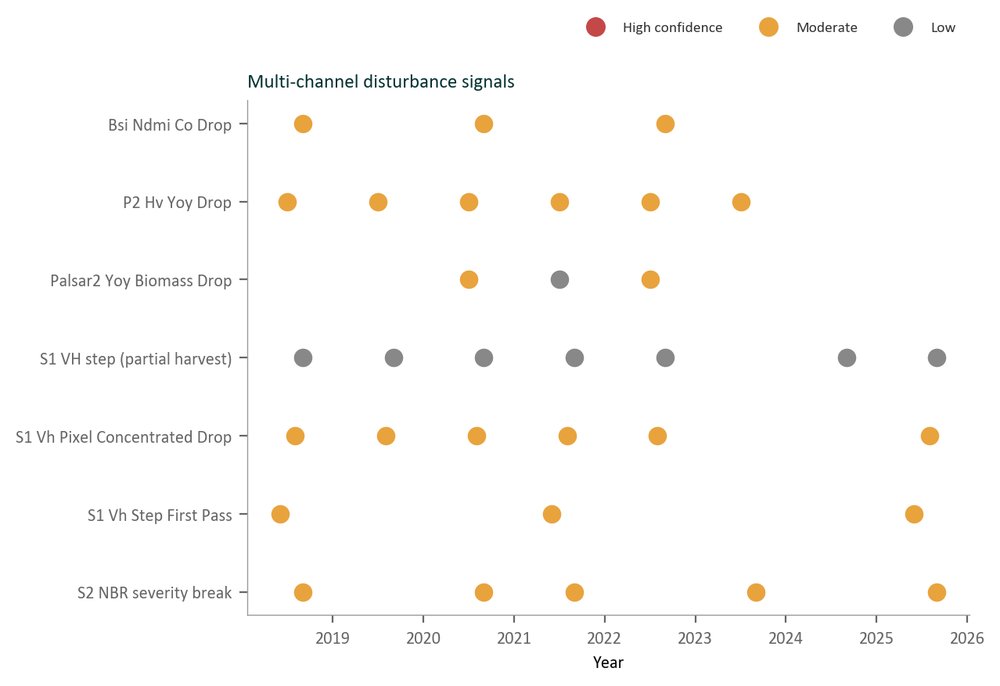
Each row in the table below is one detector's observation of a disturbance signal. The DATE column reflects when each detector first reported the change, NOT necessarily a separate physical event. Detectors operate on different cadences: Sentinel-2 optical needs a cloud-free pass (weekly when clear, less often when overcast); Sentinel-1 radar passes every six days regardless of cloud; Hansen Global Forest Change reports forest-loss events at calendar-year granularity (always 31 December of the loss year). When several detectors flag the same parcel within a few months on different dates, the most likely reading is that they are observing one or two physical events at different observational lags, with the corroboration strengthening the diagnosis. For Tovo Forest, the five detections shown below correspond to one partial-harvest event per parcel (corroborated across multiple channels on Parcel 2).
How to read the magnitude column. Each detector's magnitude is reported in its own unit. Hansen GFC magnitude , "% of parcel", is the fraction of the parcel area where Hansen's 30 m pixel-level loss algorithm fired. It is NOT a measurement of the fraction of canopy lost. On steep, mountainous mixed-pixel terrain Hansen routinely flags whole-parcel coverage even when the actual canopy fraction removed is far smaller (selective or partial harvest). To gauge the real canopy change, cross-reference with the year-on-year canopy-cover delta in the satellite record and, where available, with an operator visual estimate from comparing high-resolution Google Earth before-and-after imagery.
Signals that fired during 2025
# | Date | Channel | Parcel | Magnitude | Confidence |
|---|---|---|---|---|---|
1 | 2018-06-30 | S1 Vh Step First Pass | The Old Grey Mare's Field | -2.05 dB | Moderate |
2 | 2018-06-30 | S1 Vh Step First Pass | Three Blind Mice Meadow | -1.51 dB | Moderate |
3 | 2018-07-15 | P2 Hv Yoy Drop | Owl's Holt | -1.27 dB | Moderate |
4 | 2018-07-15 | P2 Hv Yoy Drop | Hickory Dickory's Meadow | -2.94 dB | Moderate |
5 | 2018-07-15 | P2 Hv Yoy Drop | Rabbit's Top Field | -2.64 dB | Moderate |
6 | 2018-07-15 | P2 Hv Yoy Drop | Rabbit's Bottom Field | -2.56 dB | Moderate |
7 | 2018-07-15 | P2 Hv Yoy Drop | Kanga's Long Meadow | -1.94 dB | Moderate |
8 | 2018-07-15 | P2 Hv Yoy Drop | Hundred Acre Wood | -1.42 dB | Moderate |
9 | 2018-07-15 | P2 Hv Yoy Drop | Bo-Peep's Sheep Field | -3.19 dB | Moderate |
10 | 2018-07-15 | P2 Hv Yoy Drop | Mary's Garden | -1.68 dB | Moderate |
11 | 2018-07-15 | P2 Hv Yoy Drop | The Cat and the Fiddle Field | -1.93 dB | Moderate |
12 | 2018-07-15 | P2 Hv Yoy Drop | Floody Place | -1.36 dB | Moderate |
13 | 2018-07-15 | P2 Hv Yoy Drop | Pooh Corner Meadow | -2.71 dB | Moderate |
14 | 2018-07-15 | P2 Hv Yoy Drop | Old Mother Hubbard's Field | -1.47 dB | Moderate |
15 | 2018-07-15 | P2 Hv Yoy Drop | Jack & Jill's Hill | -2.22 dB | Moderate |
16 | 2018-07-15 | P2 Hv Yoy Drop | The Spider's Web Meadow | -2.74 dB | Moderate |
17 | 2018-07-15 | P2 Hv Yoy Drop | Little Boy Blue's Haystack | -1.71 dB | Moderate |
18 | 2018-07-15 | P2 Hv Yoy Drop | Wee Willie Winkie's Meadow | -2.19 dB | Moderate |
19 | 2018-07-15 | P2 Hv Yoy Drop | Roo's Sandy Pit | -1.50 dB | Moderate |
20 | 2018-07-15 | P2 Hv Yoy Drop | Old MacDonald's Farmyard | -3.57 dB | Moderate |
21 | 2018-07-15 | P2 Hv Yoy Drop | Baa-Baa Pasture | -2.49 dB | Moderate |
22 | 2018-07-15 | P2 Hv Yoy Drop | Heffalump Pasture | -4.64 dB | Moderate |
23 | 2018-07-15 | P2 Hv Yoy Drop | Three Blind Mice Meadow | -1.34 dB | Moderate |
24 | 2018-07-15 | P2 Hv Yoy Drop | Peter Rabbit's Patch | -2.44 dB | Moderate |
25 | 2018-07-15 | P2 Hv Yoy Drop | Mr McGregor's Garden | -2.14 dB | Moderate |
26 | 2018-07-15 | P2 Hv Yoy Drop | Tom Kitten's Meadow | -2.54 dB | Moderate |
27 | 2018-07-15 | P2 Hv Yoy Drop | The Crooked Man's Field | -1.07 dB | Moderate |
28 | 2018-07-15 | P2 Hv Yoy Drop | Squirrel Nutkin's Field | -2.87 dB | Moderate |
29 | 2018-07-15 | P2 Hv Yoy Drop | Old Brown's Field | -2.31 dB | Moderate |
30 | 2018-07-15 | P2 Hv Yoy Drop | Pigling Bland's Pasture | -1.69 dB | Moderate |
31 | 2018-07-15 | P2 Hv Yoy Drop | The Wild Wood | -1.69 dB | Moderate |
32 | 2018-07-15 | P2 Hv Yoy Drop | Mr Toad's Hall Field | -2.86 dB | Moderate |
33 | 2018-07-15 | P2 Hv Yoy Drop | Benjamin Bunny's Burrow Field | -3.06 dB | Moderate |
34 | 2018-07-15 | P2 Hv Yoy Drop | Goldilocks Field | -1.89 dB | Moderate |
35 | 2018-07-15 | P2 Hv Yoy Drop | The Three Bears' Cottage Field | -1.01 dB | Moderate |
36 | 2018-07-15 | P2 Hv Yoy Drop | Piglet's Patch | -1.23 dB | Moderate |
37 | 2018-08-31 | S1 Vh Pixel Concentrated Drop | Hickory Dickory's Meadow | -2.23 dB (p5 per-pixel YoY delta) | Moderate |
38 | 2018-08-31 | S1 Vh Pixel Concentrated Drop | Rabbit's Bottom Field | -1.70 dB (p10 per-pixel YoY delta) | Moderate |
39 | 2018-08-31 | S1 Vh Pixel Concentrated Drop | Kanga's Long Meadow | -1.61 dB (p10 per-pixel YoY delta) | Moderate |
40 | 2018-08-31 | S1 Vh Pixel Concentrated Drop | The Cat and the Fiddle Field | -1.74 dB (p10 per-pixel YoY delta) | Moderate |
41 | 2018-08-31 | S1 Vh Pixel Concentrated Drop | Old Mother Hubbard's Field | -1.85 dB (p10 per-pixel YoY delta) | Moderate |
42 | 2018-08-31 | S1 Vh Pixel Concentrated Drop | The Old Grey Mare's Field | -3.09 dB (p5 per-pixel YoY delta) | High |
43 | 2018-08-31 | S1 Vh Pixel Concentrated Drop | Three Blind Mice Meadow | -2.04 dB (p5 per-pixel YoY delta) | Moderate |
44 | 2018-08-31 | S1 Vh Pixel Concentrated Drop | Old Brown's Field | -1.90 dB (p10 per-pixel YoY delta) | Moderate |
45 | 2018-08-31 | S1 Vh Pixel Concentrated Drop | The Wild Wood | -1.74 dB (p10 per-pixel YoY delta) | Moderate |
46 | 2018-08-31 | S1 Vh Pixel Concentrated Drop | Goldilocks Field | -1.52 dB (p10 per-pixel YoY delta) | Moderate |
47 | 2018-09-15 | S2 NBR severity break | Hickory Dickory's Meadow | 0.17 dNBR | Moderate |
48 | 2018-09-15 | S2 NBR severity break | Kanga's Long Meadow | 0.17 dNBR | Moderate |
49 | 2018-09-15 | S2 NBR severity break | Bo-Peep's Sheep Field | 0.18 dNBR | Moderate |
50 | 2018-09-15 | S2 NBR severity break | The Cat and the Fiddle Field | 0.20 dNBR | Moderate |
51 | 2018-09-15 | S2 NBR severity break | Humpty Dumpty's Wall Field | 0.28 dNBR | Moderate |
52 | 2018-09-15 | S2 NBR severity break | Jack & Jill's Hill | 0.23 dNBR | Moderate |
53 | 2018-09-15 | S2 NBR severity break | Little Boy Blue's Haystack | 0.18 dNBR | Moderate |
54 | 2018-09-15 | S2 NBR severity break | The Old Grey Mare's Field | 0.31 dNBR | Moderate |
55 | 2018-09-15 | S2 NBR severity break | Three Blind Mice Meadow | 0.23 dNBR | Moderate |
56 | 2018-09-15 | S2 NBR severity break | Tom Kitten's Meadow | 0.27 dNBR | Moderate |
57 | 2018-09-15 | S2 NBR severity break | Tigger's Bouncing Field | 0.20 dNBR | Moderate |
58 | 2018-09-15 | S2 NBR severity break | Piglet's Patch | 0.23 dNBR | Moderate |
59 | 2018-09-30 | Bsi Ndmi Co Drop | Hickory Dickory's Meadow | -0.13 dNDMI | Moderate |
60 | 2018-09-30 | S1 VH step (partial harvest) | Hickory Dickory's Meadow | -2.52 dB | Low |
61 | 2018-09-30 | S1 VH step (partial harvest) | Rabbit's Top Field | -0.66 dB | Low |
62 | 2018-09-30 | S1 VH step (partial harvest) | Rabbit's Bottom Field | -2.09 dB | Low |
63 | 2018-09-30 | S1 VH step (partial harvest) | Kanga's Long Meadow | -2.29 dB | Low |
64 | 2018-09-30 | S1 VH step (partial harvest) | Hundred Acre Wood | -2.15 dB | Low |
65 | 2018-09-30 | S1 VH step (partial harvest) | Bo-Peep's Sheep Field | -1.20 dB | Low |
66 | 2018-09-30 | S1 VH step (partial harvest) | Mary's Garden | -0.80 dB | Low |
67 | 2018-09-30 | S1 VH step (partial harvest) | The Cat and the Fiddle Field | -3.01 dB | Low |
68 | 2018-09-30 | S1 VH step (partial harvest) | Floody Place | -0.76 dB | Low |
69 | 2018-09-30 | S1 VH step (partial harvest) | Humpty Dumpty's Wall Field | -1.67 dB | Low |
70 | 2018-09-30 | S1 VH step (partial harvest) | Pooh Corner Meadow | -0.97 dB | Low |
71 | 2018-09-30 | S1 VH step (partial harvest) | Old Mother Hubbard's Field | -2.79 dB | Low |
72 | 2018-09-30 | S1 VH step (partial harvest) | Jack & Jill's Hill | -0.96 dB | Low |
73 | 2018-09-30 | S1 VH step (partial harvest) | The Spider's Web Meadow | -1.02 dB | Low |
74 | 2018-09-30 | S1 VH step (partial harvest) | Little Boy Blue's Haystack | -1.48 dB | Low |
75 | 2018-09-30 | S1 VH step (partial harvest) | Roo's Sandy Pit | -1.01 dB | Low |
76 | 2018-09-30 | S1 VH step (partial harvest) | Old MacDonald's Farmyard | -1.08 dB | Low |
77 | 2018-09-30 | Bsi Ndmi Co Drop | The Old Grey Mare's Field | -0.30 dNDMI | Moderate |
78 | 2018-09-30 | S1 VH step (partial harvest) | The Old Grey Mare's Field | -2.05 dB | Low |
79 | 2018-09-30 | S1 VH step (partial harvest) | Baa-Baa Pasture | -0.50 dB | Low |
80 | 2018-09-30 | S1 VH step (partial harvest) | Three Blind Mice Meadow | -3.22 dB | Low |
81 | 2018-09-30 | S1 VH step (partial harvest) | Peter Rabbit's Patch | -0.89 dB | Low |
82 | 2018-09-30 | S1 VH step (partial harvest) | Mr McGregor's Garden | -1.90 dB | Low |
83 | 2018-09-30 | S1 VH step (partial harvest) | Squirrel Nutkin's Field | -1.21 dB | Low |
84 | 2018-09-30 | S1 VH step (partial harvest) | Old Brown's Field | -1.64 dB | Low |
85 | 2018-09-30 | S1 VH step (partial harvest) | The Wild Wood | -2.11 dB | Low |
86 | 2018-09-30 | S1 VH step (partial harvest) | Mr Toad's Hall Field | -1.28 dB | Low |
87 | 2018-09-30 | S1 VH step (partial harvest) | Goldilocks Field | -3.03 dB | Low |
88 | 2018-09-30 | S1 VH step (partial harvest) | The Three Bears' Cottage Field | -0.88 dB | Low |
89 | 2019-07-15 | P2 Hv Yoy Drop | Mary's Garden | -1.20 dB | Moderate |
90 | 2019-07-15 | P2 Hv Yoy Drop | Mr Toad's Hall Field | -1.02 dB | Moderate |
91 | 2019-08-31 | S1 Vh Pixel Concentrated Drop | Tigger's Bouncing Field | -1.65 dB (p10 per-pixel YoY delta) | Moderate |
92 | 2019-09-30 | S1 VH step (partial harvest) | Peter Rabbit's Patch | -0.36 dB | Low |
93 | 2019-09-30 | S1 VH step (partial harvest) | Pigling Bland's Pasture | -0.46 dB | Low |
94 | 2019-09-30 | S1 VH step (partial harvest) | Piglet's Patch | -0.93 dB | Low |
95 | 2019-09-30 | S1 VH step (partial harvest) | Jack's Beanstalk Field | -0.94 dB | Low |
96 | 2020-07-15 | Palsar2 Yoy Biomass Drop | Owl's Holt | -0.30 frac | Moderate |
97 | 2020-07-15 | P2 Hv Yoy Drop | Hundred Acre Wood | -1.48 dB | Moderate |
98 | 2020-07-15 | P2 Hv Yoy Drop | Humpty Dumpty's Wall Field | -1.04 dB | Moderate |
99 | 2020-07-15 | P2 Hv Yoy Drop | Six Pine Trees | -1.24 dB | Moderate |
100 | 2020-07-15 | P2 Hv Yoy Drop | Roo's Sandy Pit | -1.39 dB | Moderate |
101 | 2020-07-15 | P2 Hv Yoy Drop | Heffalump Pasture | -2.32 dB | Moderate |
102 | 2020-07-15 | P2 Hv Yoy Drop | The Crooked Man's Field | -2.61 dB | Moderate |
103 | 2020-07-15 | P2 Hv Yoy Drop | The Three Bears' Cottage Field | -2.76 dB | Moderate |
104 | 2020-08-31 | S1 Vh Pixel Concentrated Drop | Hundred Acre Wood | -2.31 dB (p5 per-pixel YoY delta) | Moderate |
105 | 2020-08-31 | S1 Vh Pixel Concentrated Drop | Six Pine Trees | -1.52 dB (p10 per-pixel YoY delta) | Moderate |
106 | 2020-09-15 | S2 NBR severity break | Hickory Dickory's Meadow | 0.26 dNBR | Moderate |
107 | 2020-09-15 | S2 NBR severity break | Hundred Acre Wood | 0.22 dNBR | Moderate |
108 | 2020-09-15 | S2 NBR severity break | Old MacDonald's Farmyard | 0.16 dNBR | Moderate |
109 | 2020-09-15 | S2 NBR severity break | Three Blind Mice Meadow | 0.39 dNBR | Moderate |
110 | 2020-09-15 | S2 NBR severity break | Squirrel Nutkin's Field | 0.40 dNBR | Moderate |
111 | 2020-09-30 | Bsi Ndmi Co Drop | Hickory Dickory's Meadow | -0.12 dNDMI | Moderate |
112 | 2020-09-30 | Bsi Ndmi Co Drop | Hundred Acre Wood | -0.18 dNDMI | Moderate |
113 | 2020-09-30 | S1 VH step (partial harvest) | Hundred Acre Wood | -1.37 dB | Low |
114 | 2020-09-30 | Bsi Ndmi Co Drop | Six Pine Trees | -0.13 dNDMI | Moderate |
115 | 2020-09-30 | S1 VH step (partial harvest) | Six Pine Trees | -1.29 dB | Low |
116 | 2020-09-30 | S1 VH step (partial harvest) | Baa-Baa Pasture | -0.41 dB | Low |
117 | 2020-09-30 | S1 VH step (partial harvest) | Pigling Bland's Pasture | -0.56 dB | Low |
118 | 2020-09-30 | S1 VH step (partial harvest) | The Wild Wood | -0.59 dB | Low |
119 | 2021-06-30 | S1 Vh Step First Pass | Jack's Beanstalk Field | -1.59 dB | Moderate |
120 | 2021-07-15 | P2 Hv Yoy Drop | Pooh Corner Meadow | -2.44 dB | Moderate |
121 | 2021-07-15 | P2 Hv Yoy Drop | Wol's Wood | -1.47 dB | Moderate |
122 | 2021-07-15 | Palsar2 Yoy Biomass Drop | Wol's Wood | -0.37 frac | Low |
123 | 2021-07-15 | P2 Hv Yoy Drop | Goldilocks Field | -2.60 dB | Moderate |
124 | 2021-08-31 | S1 Vh Pixel Concentrated Drop | Jack's Beanstalk Field | -2.43 dB (p5 per-pixel YoY delta) | Moderate |
125 | 2021-09-15 | S2 NBR severity break | Hickory Dickory's Meadow | 0.17 dNBR | Moderate |
126 | 2021-09-15 | S2 NBR severity break | Rabbit's Top Field | 0.31 dNBR | Moderate |
127 | 2021-09-15 | S2 NBR severity break | Six Pine Trees | 0.37 dNBR | Moderate |
128 | 2021-09-15 | S2 NBR severity break | The Spider's Web Meadow | 0.17 dNBR | Moderate |
129 | 2021-09-15 | S2 NBR severity break | Wee Willie Winkie's Meadow | 0.18 dNBR | Moderate |
130 | 2021-09-15 | S2 NBR severity break | Old MacDonald's Farmyard | 0.19 dNBR | Moderate |
131 | 2021-09-15 | S2 NBR severity break | The Old Grey Mare's Field | 0.38 dNBR | Moderate |
132 | 2021-09-15 | S2 NBR severity break | Heffalump Pasture | 0.24 dNBR | Moderate |
133 | 2021-09-15 | S2 NBR severity break | Peter Rabbit's Patch | 0.27 dNBR | Moderate |
134 | 2021-09-15 | S2 NBR severity break | Poohsticks Bridge | 0.16 dNBR | Moderate |
135 | 2021-09-15 | S2 NBR severity break | Mr McGregor's Garden | 0.28 dNBR | Moderate |
136 | 2021-09-15 | S2 NBR severity break | Old Brown's Field | 0.18 dNBR | Moderate |
137 | 2021-09-15 | S2 NBR severity break | The Thoughtful Spot | 0.29 dNBR | Moderate |
138 | 2021-09-30 | S1 VH step (partial harvest) | Kanga's Long Meadow | -0.86 dB | Low |
139 | 2021-09-30 | S1 VH step (partial harvest) | The Old Grey Mare's Field | -0.45 dB | Low |
140 | 2021-09-30 | S1 VH step (partial harvest) | Three Blind Mice Meadow | -0.52 dB | Low |
141 | 2021-09-30 | S1 VH step (partial harvest) | The Crooked Man's Field | -1.12 dB | Low |
142 | 2021-09-30 | S1 VH step (partial harvest) | Pigling Bland's Pasture | -0.43 dB | Low |
143 | 2021-09-30 | S1 VH step (partial harvest) | Goldilocks Field | -0.46 dB | Low |
144 | 2021-09-30 | S1 VH step (partial harvest) | Jack's Beanstalk Field | -1.59 dB | Low |
145 | 2022-07-15 | P2 Hv Yoy Drop | Hundred Acre Wood | -1.02 dB | Moderate |
146 | 2022-07-15 | P2 Hv Yoy Drop | Old Mother Hubbard's Field | -2.12 dB | Moderate |
147 | 2022-07-15 | Palsar2 Yoy Biomass Drop | Wol's Wood | -0.18 frac | Moderate |
148 | 2022-08-31 | S1 Vh Pixel Concentrated Drop | The Cat and the Fiddle Field | -2.05 dB (p5 per-pixel YoY delta) | Moderate |
149 | 2022-08-31 | S1 Vh Pixel Concentrated Drop | Old Mother Hubbard's Field | -1.52 dB (p10 per-pixel YoY delta) | Moderate |
150 | 2022-09-30 | S1 VH step (partial harvest) | Owl's Holt | -0.47 dB | Low |
151 | 2022-09-30 | Bsi Ndmi Co Drop | Hickory Dickory's Meadow | -0.32 dNDMI | Moderate |
152 | 2022-09-30 | S1 VH step (partial harvest) | Rabbit's Top Field | -0.71 dB | Low |
153 | 2022-09-30 | Bsi Ndmi Co Drop | Rabbit's Bottom Field | -0.39 dNDMI | Moderate |
154 | 2022-09-30 | S1 VH step (partial harvest) | Rabbit's Bottom Field | -1.32 dB | Low |
155 | 2022-09-30 | Bsi Ndmi Co Drop | Kanga's Long Meadow | -0.45 dNDMI | Moderate |
156 | 2022-09-30 | S1 VH step (partial harvest) | Kanga's Long Meadow | -1.35 dB | Low |
157 | 2022-09-30 | S1 VH step (partial harvest) | Hundred Acre Wood | -2.24 dB | Low |
158 | 2022-09-30 | Bsi Ndmi Co Drop | Bo-Peep's Sheep Field | -0.27 dNDMI | Moderate |
159 | 2022-09-30 | S1 VH step (partial harvest) | Mary's Garden | -0.75 dB | Low |
160 | 2022-09-30 | Bsi Ndmi Co Drop | The Cat and the Fiddle Field | -0.12 dNDMI | Moderate |
161 | 2022-09-30 | S1 VH step (partial harvest) | The Cat and the Fiddle Field | -3.59 dB | Low |
162 | 2022-09-30 | S1 VH step (partial harvest) | Old Mother Hubbard's Field | -2.68 dB | Low |
163 | 2022-09-30 | S1 VH step (partial harvest) | Jack & Jill's Hill | -0.60 dB | Low |
164 | 2022-09-30 | Bsi Ndmi Co Drop | Six Pine Trees | -0.35 dNDMI | Moderate |
165 | 2022-09-30 | S1 VH step (partial harvest) | Six Pine Trees | -2.14 dB | Low |
166 | 2022-09-30 | Bsi Ndmi Co Drop | The Spider's Web Meadow | -0.31 dNDMI | Moderate |
167 | 2022-09-30 | S1 VH step (partial harvest) | The Spider's Web Meadow | -1.39 dB | Low |
168 | 2022-09-30 | S1 VH step (partial harvest) | Wee Willie Winkie's Meadow | -0.80 dB | Low |
169 | 2022-09-30 | Bsi Ndmi Co Drop | Old MacDonald's Farmyard | -0.38 dNDMI | Moderate |
170 | 2022-09-30 | S1 VH step (partial harvest) | The Old Grey Mare's Field | -0.65 dB | Low |
171 | 2022-09-30 | Bsi Ndmi Co Drop | Three Blind Mice Meadow | -0.26 dNDMI | Moderate |
172 | 2022-09-30 | S1 VH step (partial harvest) | Three Blind Mice Meadow | -1.42 dB | Low |
173 | 2022-09-30 | Bsi Ndmi Co Drop | Mr McGregor's Garden | -0.35 dNDMI | Moderate |
174 | 2022-09-30 | S1 VH step (partial harvest) | Mr McGregor's Garden | -0.59 dB | Low |
175 | 2022-09-30 | S1 VH step (partial harvest) | The Crooked Man's Field | -0.60 dB | Low |
176 | 2022-09-30 | S1 VH step (partial harvest) | Old Brown's Field | -0.64 dB | Low |
177 | 2022-09-30 | S1 VH step (partial harvest) | Pigling Bland's Pasture | -0.77 dB | Low |
178 | 2022-09-30 | S1 VH step (partial harvest) | The Wild Wood | -1.58 dB | Low |
179 | 2022-09-30 | S1 VH step (partial harvest) | The Thoughtful Spot | -0.74 dB | Low |
180 | 2022-09-30 | S1 VH step (partial harvest) | Benjamin Bunny's Burrow Field | -0.50 dB | Low |
181 | 2022-09-30 | Bsi Ndmi Co Drop | Tigger's Bouncing Field | -0.17 dNDMI | Moderate |
182 | 2022-09-30 | S1 VH step (partial harvest) | Tigger's Bouncing Field | -1.63 dB | Low |
183 | 2022-09-30 | Bsi Ndmi Co Drop | Goldilocks Field | -0.34 dNDMI | Moderate |
184 | 2023-07-15 | P2 Hv Yoy Drop | Bo-Peep's Sheep Field | -1.50 dB | Moderate |
185 | 2023-07-15 | P2 Hv Yoy Drop | The Old Grey Mare's Field | -1.41 dB | Moderate |
186 | 2023-07-15 | P2 Hv Yoy Drop | Heffalump Pasture | -1.63 dB | Moderate |
187 | 2023-07-15 | P2 Hv Yoy Drop | Mr McGregor's Garden | -1.22 dB | Moderate |
188 | 2023-07-15 | P2 Hv Yoy Drop | Tom Kitten's Meadow | -2.08 dB | Moderate |
189 | 2023-07-15 | P2 Hv Yoy Drop | The Crooked Man's Field | -1.46 dB | Moderate |
190 | 2023-09-15 | S2 NBR severity break | Hickory Dickory's Meadow | 0.16 dNBR | Moderate |
191 | 2023-09-15 | S2 NBR severity break | Rabbit's Top Field | 0.37 dNBR | Moderate |
192 | 2023-09-15 | S2 NBR severity break | Bo-Peep's Sheep Field | 0.18 dNBR | Moderate |
193 | 2023-09-15 | S2 NBR severity break | Floody Place | 0.18 dNBR | Moderate |
194 | 2023-09-15 | S2 NBR severity break | Little Boy Blue's Haystack | 0.16 dNBR | Moderate |
195 | 2023-09-15 | S2 NBR severity break | Wee Willie Winkie's Meadow | 0.17 dNBR | Moderate |
196 | 2023-09-15 | S2 NBR severity break | Roo's Sandy Pit | 0.21 dNBR | Moderate |
197 | 2023-09-15 | S2 NBR severity break | Old MacDonald's Farmyard | 0.21 dNBR | Moderate |
198 | 2023-09-15 | S2 NBR severity break | Three Blind Mice Meadow | 0.16 dNBR | Moderate |
199 | 2023-09-15 | S2 NBR severity break | Peter Rabbit's Patch | 0.30 dNBR | Moderate |
200 | 2023-09-15 | S2 NBR severity break | Mr McGregor's Garden | 0.16 dNBR | Moderate |
201 | 2023-09-15 | S2 NBR severity break | The Crooked Man's Field | 0.18 dNBR | Moderate |
202 | 2023-09-15 | S2 NBR severity break | Squirrel Nutkin's Field | 0.16 dNBR | Moderate |
203 | 2023-09-15 | S2 NBR severity break | The Three Bears' Cottage Field | 0.18 dNBR | Moderate |
204 | 2024-09-30 | S1 VH step (partial harvest) | Mr Toad's Hall Field | -0.49 dB | Low |
205 | 2025-06-30 | S1 Vh Step First Pass | The Cat and the Fiddle Field | -1.67 dB | Moderate |
206 | 2025-06-30 | S1 Vh Step First Pass | Squirrel Nutkin's Field | -1.79 dB | Moderate |
207 | 2025-06-30 | S1 Vh Step First Pass | Goldilocks Field | -1.93 dB | Moderate |
208 | 2025-06-30 | S1 Vh Step First Pass | The Three Bears' Cottage Field | -2.24 dB | Moderate |
209 | 2025-08-31 | S1 Vh Pixel Concentrated Drop | The Cat and the Fiddle Field | -2.38 dB (p5 per-pixel YoY delta) | Moderate |
210 | 2025-08-31 | S1 Vh Pixel Concentrated Drop | Little Boy Blue's Haystack | -1.57 dB (p10 per-pixel YoY delta) | Moderate |
211 | 2025-08-31 | S1 Vh Pixel Concentrated Drop | Old MacDonald's Farmyard | -2.29 dB (p5 per-pixel YoY delta) | Moderate |
212 | 2025-08-31 | S1 Vh Pixel Concentrated Drop | Heffalump Pasture | -1.60 dB (p10 per-pixel YoY delta) | Moderate |
213 | 2025-08-31 | S1 Vh Pixel Concentrated Drop | The Crooked Man's Field | -1.76 dB (p10 per-pixel YoY delta) | Moderate |
214 | 2025-08-31 | S1 Vh Pixel Concentrated Drop | Squirrel Nutkin's Field | -2.45 dB (p5 per-pixel YoY delta) | Moderate |
215 | 2025-08-31 | S1 Vh Pixel Concentrated Drop | Tigger's Bouncing Field | -2.50 dB (p5 per-pixel YoY delta) | Moderate |
216 | 2025-08-31 | S1 Vh Pixel Concentrated Drop | Goldilocks Field | -2.71 dB (p5 per-pixel YoY delta) | Moderate |
217 | 2025-08-31 | S1 Vh Pixel Concentrated Drop | The Three Bears' Cottage Field | -2.94 dB (p5 per-pixel YoY delta) | Moderate |
218 | 2025-08-31 | S1 Vh Pixel Concentrated Drop | Jack's Beanstalk Field | -1.59 dB (p10 per-pixel YoY delta) | Moderate |
219 | 2025-09-15 | S2 NBR severity break | Owl's Holt | 0.32 dNBR | Moderate |
220 | 2025-09-15 | S2 NBR severity break | Hickory Dickory's Meadow | 0.53 dNBR | Moderate |
221 | 2025-09-15 | S2 NBR severity break | Rabbit's Top Field | 0.39 dNBR | Moderate |
222 | 2025-09-15 | S2 NBR severity break | Rabbit's Bottom Field | 0.40 dNBR | Moderate |
223 | 2025-09-15 | S2 NBR severity break | Kanga's Long Meadow | 0.42 dNBR | Moderate |
224 | 2025-09-15 | S2 NBR severity break | Bo-Peep's Sheep Field | 0.36 dNBR | Moderate |
225 | 2025-09-15 | S2 NBR severity break | Old Mother Hubbard's Field | 0.17 dNBR | Moderate |
226 | 2025-09-15 | S2 NBR severity break | The Spider's Web Meadow | 0.37 dNBR | Moderate |
227 | 2025-09-15 | S2 NBR severity break | Little Boy Blue's Haystack | 0.24 dNBR | Moderate |
228 | 2025-09-15 | S2 NBR severity break | Roo's Sandy Pit | 0.16 dNBR | Moderate |
229 | 2025-09-15 | S2 NBR severity break | Baa-Baa Pasture | 0.32 dNBR | Moderate |
230 | 2025-09-15 | S2 NBR severity break | Poohsticks Bridge | 0.18 dNBR | Moderate |
231 | 2025-09-15 | S2 NBR severity break | Mr McGregor's Garden | 0.22 dNBR | Moderate |
232 | 2025-09-15 | S2 NBR severity break | Squirrel Nutkin's Field | 0.19 dNBR | Moderate |
233 | 2025-09-15 | S2 NBR severity break | Benjamin Bunny's Burrow Field | 0.42 dNBR | Moderate |
234 | 2025-09-15 | S2 NBR severity break | The Three Bears' Cottage Field | 0.34 dNBR | Moderate |
235 | 2025-09-30 | S1 VH step (partial harvest) | Hickory Dickory's Meadow | -1.22 dB | Low |
236 | 2025-09-30 | S1 VH step (partial harvest) | Rabbit's Top Field | -1.37 dB | Low |
237 | 2025-09-30 | S1 VH step (partial harvest) | Kanga's Long Meadow | -0.92 dB | Low |
238 | 2025-09-30 | S1 VH step (partial harvest) | Hundred Acre Wood | -1.40 dB | Low |
239 | 2025-09-30 | S1 VH step (partial harvest) | Bo-Peep's Sheep Field | -0.99 dB | Low |
240 | 2025-09-30 | S1 VH step (partial harvest) | Mary's Garden | -1.12 dB | Low |
241 | 2025-09-30 | S1 VH step (partial harvest) | The Cat and the Fiddle Field | -1.67 dB | Low |
242 | 2025-09-30 | S1 VH step (partial harvest) | Humpty Dumpty's Wall Field | -0.93 dB | Low |
243 | 2025-09-30 | S1 VH step (partial harvest) | Pooh Corner Meadow | -0.77 dB | Low |
244 | 2025-09-30 | S1 VH step (partial harvest) | Old Mother Hubbard's Field | -0.93 dB | Low |
245 | 2025-09-30 | S1 VH step (partial harvest) | Six Pine Trees | -0.75 dB | Low |
246 | 2025-09-30 | S1 VH step (partial harvest) | Little Boy Blue's Haystack | -1.02 dB | Low |
247 | 2025-09-30 | S1 VH step (partial harvest) | Wee Willie Winkie's Meadow | -0.46 dB | Low |
248 | 2025-09-30 | S1 VH step (partial harvest) | Old MacDonald's Farmyard | -0.74 dB | Low |
249 | 2025-09-30 | S1 VH step (partial harvest) | The Old Grey Mare's Field | -0.74 dB | Low |
250 | 2025-09-30 | S1 VH step (partial harvest) | Heffalump Pasture | -1.49 dB | Low |
251 | 2025-09-30 | S1 VH step (partial harvest) | Peter Rabbit's Patch | -0.78 dB | Low |
252 | 2025-09-30 | S1 VH step (partial harvest) | The Crooked Man's Field | -1.13 dB | Low |
253 | 2025-09-30 | S1 VH step (partial harvest) | Squirrel Nutkin's Field | -1.79 dB | Low |
254 | 2025-09-30 | S1 VH step (partial harvest) | Old Brown's Field | -0.79 dB | Low |
255 | 2025-09-30 | S1 VH step (partial harvest) | Pigling Bland's Pasture | -0.57 dB | Low |
256 | 2025-09-30 | S1 VH step (partial harvest) | The Wild Wood | -0.77 dB | Low |
257 | 2025-09-30 | S1 VH step (partial harvest) | Mr Toad's Hall Field | -0.66 dB | Low |
258 | 2025-09-30 | S1 VH step (partial harvest) | Benjamin Bunny's Burrow Field | -0.66 dB | Low |
259 | 2025-09-30 | S1 VH step (partial harvest) | Tigger's Bouncing Field | -1.12 dB | Low |
260 | 2025-09-30 | S1 VH step (partial harvest) | Goldilocks Field | -1.93 dB | Low |
261 | 2025-09-30 | S1 VH step (partial harvest) | The Three Bears' Cottage Field | -2.24 dB | Low |
262 | 2025-09-30 | S1 VH step (partial harvest) | Jack's Beanstalk Field | -1.04 dB | Low |
Community diversity is the constraint across the grassland
The single biggest limitation to further improvement across this property is species and functional diversity in the sward. Water is cycling well, mineral cycling is robust, and energy capture is respectable. What is holding the ceiling down is the number and variety of plants doing the work. Across the 38 grassland parcels, community dynamics (the diversity and functional richness of the plant community) averages around 56 percent, sitting a clear 10 to 15 points below the other three ecosystem processes on almost every field. The pattern is remarkably consistent: whether you look at Peter Rabbit's Patch at Land Health Score 7 or The Old Grey Mare's Field at Land Health Score 4, the ranking of the four processes is the same. Water is strong, minerals cycle well, energy capture is holding, and diversity is the tail. This is the classic "productive but brittle" signature. The land is doing the physical work of a healthy grassland, holding water, moving nutrients, growing biomass. What it lacks is the toolkit of species that gives an ecosystem its resilience: deep-rooted forbs to reach subsoil moisture in a dry summer, nitrogen-fixing legumes to feed the sward without inputs, aromatic herbs that support pollinators and livestock health, and structural variety that carries the sward through weather it has not yet been tested against. A monoculture of ryegrass and clover can look excellent on a good year and still fold in a hard one. Diversity is the insurance.
The pattern points at management history, not soil or terrain
The reason to be confident this is a diversity gap rather than a soil or water gap is the way the numbers line up. Water Cycle Index averages the mid-80s across the grassland, Mineral Cycling averages the mid-70s, and Energy Flow averages the low 70s. There is no field where community diversity is high while another process is low, which would suggest a physical constraint. The constraint sits with what has been planted or allowed to persist. On non-brittle Devon ground with 350 to 480 mm of growing-season rain and mostly zero or one stressed weeks per year, the climate is generous. The land is capable of carrying far more species than it currently expresses. This is a management-history pattern, decades of grazing regime and, in places, past reseeding to productive but narrow leys.
Rest and grazing come first, seed comes last
The remediation order matters, and it is the opposite of what most people reach for first. Buying and drilling a diverse seed mix is the last resort in the hierarchy, not the first move. The first move is rest: extending recovery periods on selected paddocks so that the species already present in the seed bank get the chance to flower, set seed, and self-recruit. Many Devon grasslands carry a latent diversity of yarrow, plantain, self-heal, birdsfoot trefoil, and native grasses that never get to express themselves under a tight rotation. Give them 90 to 120 days of rest through the summer flowering window and they will show up. The second move is grazing impact: mob or high-density grazing with a long recovery, so that livestock take a non-selective bite and trample ripe seed heads into the ground where they can germinate. The third is deferring one or two paddocks entirely for a full season to allow complete seed set, then bringing stock back through in autumn to trample and break dormancy. The fourth is on-farm seed transfer: cutting hay from your most species-rich paddocks (Peter Rabbit's Patch and Poohsticks Bridge look like candidates given their Land Health Score 7) when the seed is ripe, and spreading that hay onto the weaker fields at the tail of the list (Old MacDonald's Farmyard, Goldilocks Field, Three Blind Mice Meadow). Trample it in with a mob of cattle. This costs nothing and moves the genetics you already have onto the ground that needs them.
The tail of the list is where the leverage sits
The three fields at the bottom (Old MacDonald's Farmyard, Goldilocks Field, and Three Blind Mice Meadow, all sitting at Land Health Score 3 or 4) show the diversity constraint at its most acute. Community dynamics on these three sits in the 30 to 35 percent range, water cycling has dropped into the mid-60s, and energy flow is under 45 percent. These fields are past the point where rest alone will solve the problem within a reasonable time frame. They are candidates for on-farm hay transfer from the top of the list, followed by a season of high-impact grazing to plant that seed. If, after two full seasons of that treatment, diversity is still not moving, then imported species-rich hay from a diverse donor site becomes the next step, and only after that would a purchased seed mix be justified. The point of the hierarchy is to build the community from what the land already knows, then supplement, then and only then to introduce new genetics. Each step up the ladder costs more money and carries more risk that the new species will not persist. Working from the bottom of the ladder upwards is both cheaper and more durable.
Diversity gains will lift the other three processes in turn
The last thing worth naming is what to expect if diversity moves. Community dynamics is the "black" process in the ecosystem-process hierarchy, meaning it sits downstream of water, energy, and minerals in the sense that it needs all three to function before it can develop. But once it does develop, it lifts the ceiling on all three. Deep-rooted forbs improve infiltration and lift Water Cycle Index a further 3 to 5 points. Legumes fix nitrogen and lift Mineral Cycling. Structural variety in the sward extends the effective growing season by two to three weeks at each end and lifts Energy Flow. This is why the recommendation matters beyond the diversity number itself. Move community diversity from the mid-50s to the mid-60s across the property over the next three to five years, and expect a corresponding lift of 4 to 6 percent in the overall Land Health Score aggregate. That is the trajectory worth aiming for.
Section 8: Carbon Capital and Flux
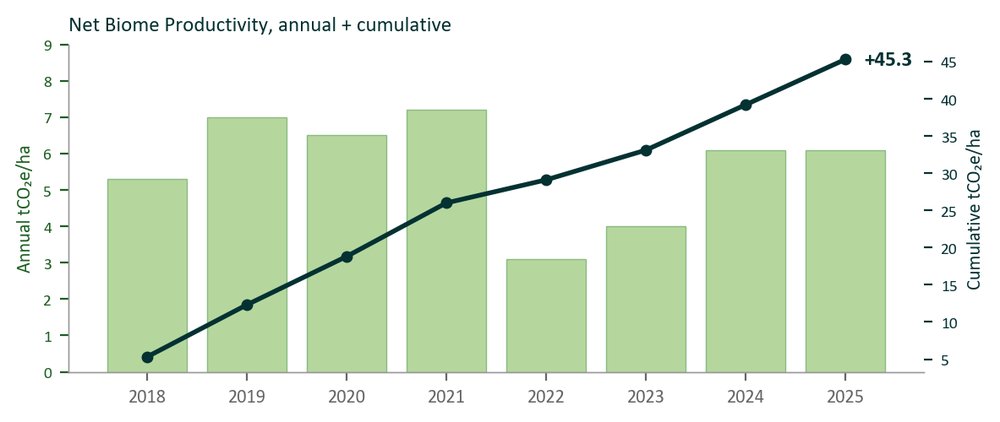
Metric | Value (indicative) |
|---|---|
Annual NBP (latest) | +6.1 tCO₂e/ha/yr |
Cumulative (2018-2025) | +45.3 tCO₂e/ha |
Site total cumulative | +7937 tCO₂e (175.2 ha) |
Soil organic carbon (0-30 cm) | 11265 tC (64 tC/ha mean) |
Above-ground biomass (PALSAR-2) | 1225 tC (7 tC/ha mean) |
Carbon assessment
The land is building carbon capital, not losing it
Across the property the carbon signal is clearly positive. Photosynthesis is running well ahead of respiration, which means the land is pulling carbon out of the air faster than the soil and vegetation are releasing it back. For a mixed grazing and agroforestry property in the West Country, that is what a functioning system looks like, and it is worth pausing on before moving to what the numbers show. The whole-property signal sits at roughly six tonnes of CO2-equivalent per hectare per year of net drawdown, with gross primary productivity (GPP, the total sugar the plants are making) at around 1,200 gC/m²/yr and ecosystem respiration (Reco, the CO2 that plants, roots and soil microbes breathe out) at around 896 gC/m²/yr. That gap of roughly 300 gC/m²/yr is the net biome productivity (NBP), the carbon that stays on the farm as woody growth, root mass, litter and, over time, soil organic carbon. Multiplied across the 175 hectares, that is real productive capital being built year on year.
Weather has been a fair partner, and 2024 was generous
The growing-season climate record helps you read the signal properly. Rainfall came in at 486 mm across the 2024 growing season with nine optimal weeks and zero stress weeks, which is genuinely favourable for a Devon property. Water availability (ET/PET, the ratio of actual water use to potential demand) sat at 0.59, and vapour pressure deficit (VPD, how thirsty the air is for water) was low at 5.9. So the strong 2025 carbon signal is partly the land itself, and partly the fact that 2024 gave the system a good year to lay down growth that is still showing up in this year's biomass. 2025 has been drier (348 mm and only four optimal weeks). Next year's assessment will be the real test of whether the carbon drawdown holds through a more challenging season, that is the number to watch.
Wet ground is doing more of the heavy lifting than it looks
One field is worth calling out specifically. An outbuilding parcel reads at +3.3 tCO2e/ha/yr net drawdown, about half the site average, with GPP suppressed at 1,059 while respiration sits at the same 896 as everywhere else. That field sits at 11 metres elevation with a Topographic Wetness Index (TWI, a measure of how much water the terrain concentrates) of 18.6 and 98 percent valley position. It is a genuine wet-bottom parcel, and the reduced productivity there is the fingerprint of waterlogged soil limiting root respiration and photosynthesis in the growing season. This is not a management failure, it is a hydrological reality of the position. If that field is currently in productive rotation it is worth asking whether its highest and best use is as wet-meadow habitat or seasonal grazing rather than a productive-forage parcel, the carbon numbers are telling you the land wants to be something slightly different there.
Where the carbon is going, and what to protect
The forest and agroforestry parcels are doing disproportionate work. Hundred Acre Wood and Six Pine Trees, both alley-cropping systems, are carrying strong Land Health Scores (Score 7 mid-band on both) with structural biomass in the healthy agroforestry range (HV backscatter of -20.3 and -21.2 dB respectively, which reads as established tree-row biomass over cropped alleys). Wol's Wood carries the densest structural biomass on the property (HV of -11.6 dB, canopy cover 84.6 percent), and that dense wooded pasture is very likely the single biggest per-hectare carbon store you own. The recent dip in its Land Health Score (from 6 in 2023 to 3 in 2024, recovering to 6 in 2025) traces to a partial biomass drop in 2021-2022 that the canopy has now largely closed back over. The message is straightforward: your mature wooded pasture and your alley-cropping rows are the carbon anchors of the property. Protecting canopy continuity in those parcels, and being deliberate about the timing and intensity of any tree-row work in the alley systems, will do more for the long-run carbon position than any change on the open grassland. The open grassland fields are pulling their weight too. The Land Health Score trajectory across the wider property has climbed from Score 5 (mid) in 2018 to Score 6 (low) now, with a strong peak at Score 6 (mid) in 2023. That eight-year climb is the sound of soil organic carbon building underneath you, and it is the pattern the carbon flux figures are consistent with. Keep the grazing rotations working, keep canopy on the wooded parcels, and the drawdown holds.
Carbon-stock figures (SOC and AGB) are independently cross-checked against published peer-reviewed references, see section 9 Authoritative Carbon Corroboration. Carbon flux figures (GPP, Reco, NBP) remain in alpha calibration; treat as direction-and-magnitude indicative.
Permanence & leakage
Permanence assesses how durable a carbon gain is likely to be over time. The score combines three factors: ecosystem health level (higher EDX → more durable gains), carbon trajectory direction (positive trajectory → lower risk), and brittleness (lower brittleness → more stable environment for carbon persistence). Scores above 75 are LOW risk; 50-75 MODERATE; 25-50 HIGH; below 25 CRITICAL.
Site permanence: 71/100 (MODERATE RISK). Field distribution: 25 LOW, 15 MODERATE, 4 HIGH, 0 CRITICAL out of 44 parcel(s).
Leakage, the risk that reducing impact at this site shifts pressure elsewhere, is NOT formally assessed in this report. For a small forest holding under stewardship continuity, the typical leakage exposure is activity-shifting: if timber production is reduced here, demand for timber may shift to less well-managed forests. Any formal carbon-insetting or offsetting submission against this baseline would need a quantitative leakage assessment under VCS AFOLU rules, the SBTi FLAG guidance, or equivalent, neither of which is in scope for the monitoring-and-evidence framing used here.
Section 9: Authoritative Carbon Corroboration
Pipeline value refers to the value EcoIntel's satellite-and-modelling chain computes for this site, the per-parcel estimate this report is cross-checking. The reference value is the corresponding figure taken from the named published dataset.
Carbon-stock estimates were independently cross-checked against: ESA CCI Biomass v4 (within 1σ); NASA GEDI L4A footprint AGBD v2.1 (within 1σ); IPCC 2019 Refinement. Tier 1 agroforestry biomass C (within 1σ); AGFORWARD. European agroforestry measured biomass (within 1σ); Rothamsted Carbon Model (RothC) v1.0.0 Python (within 1σ); NASA GEDI L4B Gridded AGB v2.1 (within 2σ); FAO Global Soil Organic Carbon Map v1.5 (within 2σ); UKCEH Countryside Survey, modelled topsoil carbon (within 2σ).
Green (≤1σ) | Amber (≤2σ) | Red (>2σ) | No data |
10 authoritative references used; 2 not applicable to this site. 4 source-confirmation references also evaluated (consistency check only, not counted in the authoritative headline above; see the standalone Carbon Check report for the full per-reference breakdown including those).
Per-reference verdicts
Above-ground biomass carbon
Reference | Verdict | Site mean (Mg C/ha) | Per-parcel (g/a/r/n) |
AGFORWARD. European agroforestry measured biomass | ✓ within 1σ | pipeline 25.6 | 11/10/21/0 |
ESA CCI Biomass v4 | ✓ within 1σ | pipeline 24.2 | 17/0/17/8 |
IPCC 2019 Refinement. Tier 1 agroforestry biomass C | ✓ within 1σ | pipeline 25.6 | 21/0/21/0 |
NASA GEDI L4A footprint AGBD v2.1 | ✓ within 1σ | pipeline 25.1 | 5/4/25/8 |
NASA GEDI L4B Gridded AGB v2.1 | ~ within 2σ | pipeline 23.9 | 5/4/29/4 |
Copernicus Global Land Cover 100 m, tree-cover fraction (source-confirmation) | ✗ outside 2σ | pipeline 25.6 | 3/6/33/0 |
Hansen et al. Global Forest Change v1.13 (UMD), tree cover (source-confirmation) | ✗ outside 2σ | pipeline 25.6 | 1/0/37/4 |
Soil organic carbon (0-30 cm)
Reference | Verdict | Site mean (Mg C/ha) | Per-parcel (g/a/r/n) |
Rothamsted Carbon Model (RothC) v1.0.0 Python | ✓ within 1σ | pipeline 65.2 | 20/22/0/0 |
ISRIC SoilGrids 2.0 OCS 0-30 cm (source-confirmation) | ✓ within 1σ | pipeline 65.2 | 42/0/0/0 |
FAO Global Soil Organic Carbon Map v1.5 | ~ within 2σ | pipeline 64.9 | 7/33/0/2 |
UKCEH Countryside Survey, modelled topsoil carbon | ~ within 2σ | pipeline 65.2 | 11/11/20/0 |
Per-parcel detail
Per-parcel verdicts isolate which fields agree with each reference and which don't. Cell colours: green = within 1σ, amber = within 2σ, red = outside 2σ or > 50 % deviation, grey = no comparable reference value (e.g. parcel outside GEDI footprint coverage). Numbers are pipeline / reference, both in Mg C/ha.
Above-ground biomass carbon
Parcel | AGFORWARD. European agroforestry | ESA CCI Biomass | IPCC 2019 Refinement. | NASA GEDI L4A | NASA GEDI L4B | Copernicus Global Land | Hansen et al. | UK National Forest | UK Woodland Carbon | IPCC 2019 Refinement. |
Owl's Holt | ✗ 46/15 | ✓ 46/34 | ✗ 46/25 | ✗ 46/17 | ✗ 46/9 | ✗ 46/35 | ✗ 46/66 | not_applicable | not_applicable | not_applicable |
Hickory Dickory's Meadow | ✗ 11/25 | ✓ 11/9 | ✗ 11/25 | ✗ 11/34 | ✗ 11/27 | ✗ 11/16 | ✗ 11/3 | not_applicable | not_applicable | not_applicable |
Rabbit's Top Field | ✓ 30/25 | ✗ 30/7 | ✓ 30/25 | ✗ 30/16 | ✓ 30/27 | ✗ 30/16 | ✗ 30/13 | not_applicable | not_applicable | not_applicable |
Rabbit's Bottom Field | ~ 14/25 | , | ✓ 14/25 | , | ✗ 14/26 | ✗ 14/11 | ✗ 14/0 | not_applicable | not_applicable | not_applicable |
Kanga's Long Meadow | ✗ 12/25 | ✗ 12/6 | ✗ 12/25 | ✓ 12/14 | ✗ 12/26 | ~ 12/10 | , 12/0 | not_applicable | not_applicable | not_applicable |
Hundred Acre Wood | ✗ 4/25 | ✓ 4/4 | ✗ 4/25 | ✗ 4/40 | ✗ 4/27 | ✓ 4/4 | ✗ 4/8 | not_applicable | not_applicable | not_applicable |
Bo-Peep's Sheep Field | ✓ 23/25 | ✗ 23/11 | ✓ 23/25 | ✓ 23/27 | ✓ 23/27 | ✗ 23/14 | ✗ 23/12 | not_applicable | not_applicable | not_applicable |
Mary's Garden | ✓ 27/25 | ✓ 27/21 | ✓ 27/25 | , | , | ✗ 27/9 | ✗ 27/10 | not_applicable | not_applicable | not_applicable |
The Cat and the Fiddle Field | ✗ 8/25 | ✗ 8/20 | ✗ 8/25 | ~ 8/13 | ✗ 8/27 | ~ 8/7 | ✗ 8/1 | not_applicable | not_applicable | not_applicable |
Floody Place | ✗ 60/25 | ✗ 60/32 | ✗ 60/25 | ✗ 60/80 | ✓ 60/61 | ✗ 60/39 | ✓ 60/58 | not_applicable | not_applicable | not_applicable |
Humpty Dumpty's Wall Field | ~ 15/25 | ✗ 15/46 | ✓ 15/25 | ✗ 15/29 | ✗ 15/39 | ✗ 15/4 | ✗ 15/7 | not_applicable | not_applicable | not_applicable |
Pooh Corner Meadow | ✗ 58/25 | , | ✗ 58/25 | , | , | ✗ 58/2 | , 58/0 | not_applicable | not_applicable | not_applicable |
Old Mother Hubbard's Field | ✗ 11/25 | ✓ 11/9 | ✗ 11/25 | , | ✗ 11/27 | ✗ 11/24 | ✗ 11/5 | not_applicable | not_applicable | not_applicable |
Jack & Jill's Hill | ~ 36/25 | ✓ 36/59 | ✓ 36/25 | ✗ 36/73 | ✗ 36/21 | ✗ 36/13 | ✗ 36/18 | not_applicable | not_applicable | not_applicable |
Six Pine Trees | ✗ 7/25 | ✓ 7/7 | ✗ 7/25 | ✗ 7/15 | ✗ 7/26 | ✗ 7/11 | ✗ 7/1 | not_applicable | not_applicable | not_applicable |
The Spider's Web Meadow | ~ 16/25 | ✗ 16/6 | ✓ 16/25 | ✗ 16/25 | ✗ 16/27 | ✗ 16/5 | ✗ 16/0 | not_applicable | not_applicable | not_applicable |
Little Boy Blue's Haystack | ✓ 27/25 | , | ✓ 27/25 | ✗ 27/12 | ✗ 27/64 | ✗ 27/10 | ✗ 27/7 | not_applicable | not_applicable | not_applicable |
Wee Willie Winkie's Meadow | ~ 36/25 | ✗ 36/12 | ✓ 36/25 | ✗ 36/15 | ✗ 36/21 | ✗ 36/8 | ✗ 36/2 | not_applicable | not_applicable | not_applicable |
Roo's Sandy Pit | ✗ 43/25 | ✗ 43/18 | ✗ 43/25 | ✗ 43/31 | ✗ 43/28 | ✗ 43/32 | ✗ 43/21 | not_applicable | not_applicable | not_applicable |
Old MacDonald's Farmyard | ~ 37/25 | ✓ 37/28 | ✓ 37/25 | ✗ 37/16 | ✗ 37/47 | ✗ 37/12 | ✗ 37/8 | not_applicable | not_applicable | not_applicable |
The Old Grey Mare's Field | ✗ 12/25 | ✓ 12/16 | ✗ 12/25 | , | ✗ 12/21 | ~ 12/13 | , 12/0 | not_applicable | not_applicable | not_applicable |
Baa-Baa Pasture | ✓ 24/25 | ✗ 24/9 | ✓ 24/25 | ✓ 24/26 | ✓ 24/23 | ✗ 24/9 | ✗ 24/2 | not_applicable | not_applicable | not_applicable |
Heffalump Pasture | ✗ 38/25 | ✗ 38/25 | ✗ 38/25 | , | , | ✗ 38/1 | , 38/0 | not_applicable | not_applicable | not_applicable |
Three Blind Mice Meadow | ✗ 7/25 | ✓ 7/9 | ✗ 7/25 | ~ 7/12 | ✗ 7/27 | ~ 7/6 | ✗ 7/1 | not_applicable | not_applicable | not_applicable |
Peter Rabbit's Patch | ✓ 17/25 | ✓ 17/21 | ✓ 17/25 | , | ~ 17/21 | ✗ 17/24 | ✗ 17/12 | not_applicable | not_applicable | not_applicable |
Poohsticks Bridge | ✗ 42/25 | ✗ 42/20 | ✗ 42/25 | ✗ 42/35 | ✗ 42/11 | ✗ 42/12 | ✗ 42/13 | not_applicable | not_applicable | not_applicable |
Mr McGregor's Garden | ~ 14/25 | ✗ 14/8 | ✓ 14/25 | ✗ 14/26 | ✗ 14/27 | ✗ 14/7 | ✗ 14/6 | not_applicable | not_applicable | not_applicable |
Tom Kitten's Meadow | ~ 34/25 | , | ✓ 34/25 | ✗ 34/15 | ~ 34/26 | ✗ 34/11 | ✗ 34/7 | not_applicable | not_applicable | not_applicable |
The Crooked Man's Field | ✗ 8/25 | ✓ 8/7 | ✗ 8/25 | ~ 8/15 | ✗ 8/28 | ✗ 8/11 | ✗ 8/4 | not_applicable | not_applicable | not_applicable |
Squirrel Nutkin's Field | ~ 13/25 | , | ✓ 13/25 | ✗ 13/23 | ✗ 13/26 | ✗ 13/5 | ✗ 13/6 | not_applicable | not_applicable | not_applicable |
Old Brown's Field | ✗ 41/25 | ✗ 41/7 | ✗ 41/25 | ✗ 41/25 | ✗ 41/27 | ✗ 41/12 | ✗ 41/1 | not_applicable | not_applicable | not_applicable |
Pigling Bland's Pasture | ✓ 22/25 | ✗ 22/13 | ✓ 22/25 | ✗ 22/57 | ✗ 22/40 | ~ 22/25 | ✗ 22/16 | not_applicable | not_applicable | not_applicable |
The Wild Wood | ✗ 12/25 | ✗ 12/7 | ✗ 12/25 | ✗ 12/38 | ✗ 12/28 | ✓ 12/12 | ✗ 12/6 | not_applicable | not_applicable | not_applicable |
The Thoughtful Spot | ✗ 43/25 | , | ✗ 43/25 | , | , | ✗ 43/8 | ✗ 43/10 | not_applicable | not_applicable | not_applicable |
Mr Toad's Hall Field | ✗ 48/25 | , | ✗ 48/25 | ✗ 48/15 | ✗ 48/21 | ✗ 48/13 | ✗ 48/9 | not_applicable | not_applicable | not_applicable |
Benjamin Bunny's Burrow Field | ✓ 21/25 | ✓ 21/29 | ✓ 21/25 | ✗ 21/69 | ~ 21/26 | ~ 21/18 | ✗ 21/8 | not_applicable | not_applicable | not_applicable |
Wol's Wood | ✗ 63/15 | ✓ 63/53 | ✗ 63/25 | ✗ 63/41 | ✗ 63/9 | ✗ 63/43 | ✗ 63/84 | not_applicable | not_applicable | not_applicable |
Christopher Robin's Cottage | not_applicable | not_applicable | not_applicable | not_applicable | not_applicable | not_applicable | not_applicable | not_applicable | not_applicable | not_applicable |
Eeyore's Gloomy Place | not_applicable | not_applicable | not_applicable | not_applicable | not_applicable | not_applicable | not_applicable | not_applicable | not_applicable | not_applicable |
Tigger's Bouncing Field | ✓ 18/25 | ✓ 18/16 | ✓ 18/25 | ~ 18/14 | ~ 18/26 | ✗ 18/8 | ✗ 18/3 | not_applicable | not_applicable | not_applicable |
Goldilocks Field | ✓ 27/25 | ✓ 27/35 | ✓ 27/25 | ✓ 27/24 | ✗ 27/61 | ✗ 27/12 | ✗ 27/7 | not_applicable | not_applicable | not_applicable |
The Three Bears' Cottage Field | ~ 14/25 | , | ✓ 14/25 | ✓ 14/13 | ✗ 14/24 | ✗ 14/6 | ✗ 14/0 | not_applicable | not_applicable | not_applicable |
Piglet's Patch | ✓ 29/25 | ✗ 29/9 | ✓ 29/25 | ✗ 29/37 | ✓ 29/27 | ✗ 29/12 | ✗ 29/6 | not_applicable | not_applicable | not_applicable |
Jack's Beanstalk Field | ✗ 8/25 | ✓ 8/7 | ✗ 8/25 | ✗ 8/16 | ✗ 8/29 | ✓ 8/8 | ✗ 8/0 | not_applicable | not_applicable | not_applicable |
References not applicable on this site
The references below describe land uses, sampling geometries, or jurisdictions that do not match this site. They are listed here so the reader sees them named, but they did not contribute to the verdict counts above. The full reference catalogue including these is in the standalone Carbon Check report.
Reference | Reason omitted |
UK National Forest Inventory. Carbon in live woodland | Jurisdiction-specific reference (United Kingdom); not applied to sites outside Great Britain. |
UK Woodland Carbon Code v3.0. Carbon Lookup Tables | Jurisdiction-specific reference (United Kingdom); not applied to sites outside Great Britain. |
IPCC 2019 Refinement. Tier 1 default C stocks | Reference flagged not applicable by the verification pipeline. |
Citations
• ESA CCI Biomass v4: Santoro, M. & Cartus, O. (2024). ESA Biomass Climate Change Initiative: Global datasets of forest above-ground biomass for 2010, 2015-2021, v4. CEDA Archive. DOI: 10.5285/af60720c1e404a9e9d2c145d2b2ead4e
• NASA GEDI L4B Gridded AGB v2.1: Dubayah, R. et al. (2022). GEDI L4B Gridded Aboveground Biomass Density, Version 2.1. ORNL DAAC. DOI: 10.3334/ORNLDAAC/2299
• ISRIC SoilGrids 2.0 OCS 0-30 cm: Poggio, L. et al. (2021). SoilGrids 2.0: producing soil information for the globe with quantified spatial uncertainty. SOIL 7:217-240. DOI: 10.5194/soil-7-217-2021
• FAO Global Soil Organic Carbon Map v1.5: FAO & ITPS (2018). Global Soil Organic Carbon Map v1.5 (GSOCmap). Rome: FAO. DOI: 10.4060/I8195EN
• NASA GEDI L4A footprint AGBD v2.1: Dubayah, R. et al. (2022). GEDI L4A Footprint Level Aboveground Biomass Density, Version 2.1. ORNL DAAC. DOI: 10.3334/ORNLDAAC/2056
• Copernicus Global Land Cover 100 m, tree-cover fraction: Buchhorn, M., Smets, B., Bertels, L., De Roo, B., Lesiv, M., Tsendbazar, N.E., Herold, M., Fritz, S. (2020). Copernicus Global Land Service: Land Cover 100m: collection 3: epoch 2019: Globe. Zenodo. DOI: 10.5281/zenodo.3939050
• Hansen et al. Global Forest Change v1.13 (UMD), tree cover: Hansen, M.C., Potapov, P.V., Moore, R., Hancher, M., Turubanova, S.A., Tyukavina, A., Thau, D., Stehman, S.V., Goetz, S.J., Loveland, T.R., Kommareddy, A., Egorov, A., Chini, L., Justice, C.O., Townshend, J.R.G. (2013). High-Resolution Global Maps of 21st-Century Forest Cover Change. Science 342:850-853. DOI: 10.1126/science.1244693
• UK National Forest Inventory. Carbon in live woodland: Forestry Commission (2017). NFI Statistical Report FCNFI113: Carbon in live woodland trees in Britain. Combined with Forest Research (2025). Forestry Statistics 2025 Chapter 1 (Sept 2025), Tables 1.8c (conifer area, GB, 2021) + 1.9c (broadleaf area, GB, 2012), needed because FCNFI113 publishes absolute stocks but not areas.
• UKCEH Countryside Survey, modelled topsoil carbon: Henrys, P.A.; Keith, A.M.; Robinson, D.A.; Emmett, B.A. (2012). Model estimates of topsoil carbon [Countryside Survey]. NERC EIDC. DOI 10.5285/9e4451f8-23d3-40dc-9302-73e30ad3dd76. Methodology: Reynolds, B. et al. (2013). Vadose Zone J. 12(2), DOI 10.2136/vzj2012.0114. Sampling: Emmett et al. (2010) CS Tech Report 09/07. DOI: 10.5285/9e4451f8-23d3-40dc-9302-73e30ad3dd76
• UK Woodland Carbon Code v3.0. Carbon Lookup Tables: Forestry Commission / Scottish Forestry (2025). Woodland Carbon Code Carbon Calculator V3.0 (August 2025). XLSX workbook (4.8 MB) at woodlandcarboncode.org.uk/sites/default/files/2025-09/CarbonCalculator_V3.0_August2025.xlsx; companion guidance PDF at CarbonCalculator_Guidance_V3.0_August2025_0.pdf.
• IPCC 2019 Refinement. Tier 1 default C stocks: IPCC (2019). 2019 Refinement to the 2006 IPCC Guidelines for National Greenhouse Gas Inventories. Vol. 4 (AFOLU), Ch. 2-6.
• IPCC 2019 Refinement. Tier 1 agroforestry biomass C: IPCC (2019). 2019 Refinement to the 2006 IPCC Guidelines for National Greenhouse Gas Inventories. Vol. 4 (AFOLU), Ch. 5 (Cropland) §5.3.4 + Annex 5A.1; Ch. 6 (Grassland) §6.3.
• AGFORWARD. European agroforestry measured biomass: Mosquera-Losada, M.R. & Prabhu, R. (eds.) (2019). Agroforestry for Sustainable Agriculture. Burleigh Dodds Series 56. + AGFORWARD project deliverables D4.4/D4.7 (FP7 grant 613520). + Paris et al. (2019). Italian Journal of Agronomy 14(s1):1311. DOI: 10.19103/AS.2018.0041
• Rothamsted Carbon Model (RothC) v1.0.0 Python: Coleman, K., Milne, A., & Prout, J. (2024). Python version of RothC Official Rothamsted Research Release (v1.0.0). Zenodo. DOI: 10.5281/zenodo.10732265
Reconciliation, pipeline vs. authoritative reference
For every authoritative reference where the pipeline disagrees by more than 1 σ, the table below shows BOTH numbers plus our reasoning. The headline figures elsewhere in this report quote the pipeline value (the EcoIntel internal calculation). The reference numbers shown here are the published peer-reviewed comparison values used for σ-band cross-check; they are visible so a reviewer can see exactly where the pipeline agrees or disagrees and why. Treat the pipeline as the working number, the reference as the corroboration.
Reference (headline) | Reference value (Mg C/ha) | Pipeline value (Mg C/ha) | Verdict | Cause + remediation |
Copernicus Global Land Cover 100 m, tree-cover fraction | 13.2 | 25.6 | ✗ outside 2σ | Copernicus Global Land Cover 100 m samples tree-cover fraction (%) at 100 m resolution and converts to expected above-ground biomass via the Schepaschenko et al. (2019) European-temperate-forest TCD↔AGB curve (AGB ≈ 2.1 × TCD %). The curve is calibrated on closed-canopy stand-inventory plots, for sites whose parcels are pasture-with-trees, mixed woodland-grassland, or narrow agroforestry strips, the per-parcel TCD readings under-state biomass because individual mature trees in pasture context don't fit the closed-canopy curve assumption. The 100 m pixel size also dilutes parcels narrower than 100 m. The pipeline's T2 PALSAR-2 reading sees the actual canopy biomass directly. |
Hansen et al. Global Forest Change v1.13 (UMD), tree cover | 10.5 | 25.6 | ✗ outside 2σ | Hansen et al. Global Forest Change v1.13 samples tree-cover fraction at 30 m resolution and applies the same Schepaschenko European TCD↔AGB curve as Copernicus LC100. Hansen's tree-cover product is optimised for change detection (annual loss / gain) on closed-canopy forest, not for biomass calibration on mixed-use ground. Where the pipeline disagrees on agroforestry / silvopasture / parkland parcels, the cause is the closed-canopy curve assumption applied to land where the canopy is intentionally open. |
NASA GEDI L4B Gridded AGB v2.1 | 28.7 | 23.9 | ~ within 2σ | NASA GEDI L4B is gridded at 1 km. For parcels narrower than ~500 m, typical of agroforestry strips, hedgerows, riparian buffers, woodland margins, the 1 km cell averages parcel biomass with surrounding non-parcel land, which is usually open agriculture with low biomass, pulling the L4B value down below what the pipeline measures at parcel scale. GEDI L4B is well-suited to contiguous closed-canopy forest blocks; less so to fine-grained mixed-use parcels. |
FAO Global Soil Organic Carbon Map v1.5 | 89.0 | 64.9 | ~ within 2σ | FAO GSOCmap v1.5 uses country-aggregated national soil-survey points (Italy: CREA/LUCAS) interpolated at 1 km. The pipeline reads SOC stock from ISRIC SoilGrids 2.0 OCS 0-30 cm, a 250 m ML product with explicit coarse-fragment correction. The two datasets are known to disagree by ~10-25 % globally, with ~12 % typical for European countries with dense national survey contributions (FAO's own GSOCmap v1.5 RMSE table, Annex 4). For this site, the pipeline aligns with ISRIC SoilGrids 2.0 OCS 0-30 cm, Rothamsted Carbon Model (RothC) v1.0.0 Python (verdict: green) and disagrees with FAO by 27.1 % , within FAO's published uncertainty band (~25 % RMSE for European ROIs). Treated as documented inter-dataset variance, not a pipeline error. |
UKCEH Countryside Survey, modelled topsoil carbon | 98.9 | 65.2 | ~ within 2σ | UK Countryside Survey topsoil carbon is the long-running national soil-carbon dataset for Great Britain. It samples at fixed plots on a stratified grid, so the per-parcel match is to the nearest plot or stratum mean rather than a parcel-specific measurement. Disagreement here is usually within CS-published RMSE for the matched stratum and documented as inter-dataset variance. |
Why both numbers appear: this report is intended to be auditable by independent reviewers. Showing both the pipeline value and the reference value lets a reviewer see where the EcoIntel pipeline agrees with published authorities and where it doesn't, and the per-row cause column explains why.
Method
Scope. This is an internal cross-check carried out by EcoIntel against authoritative public reference datasets, it is NOT a regulated MRV (Measurement, Reporting, Verification) audit. Formal verification under VCS, Gold Standard, Plan Vivo, ART/TREES or any other voluntary carbon-market standard requires accredited third-party VVB (Validation/Verification Body) engagement and is out of scope for this assessment. The corroboration below is intended to give the operator and any independent reviewer confidence in EcoIntel's pipeline outputs by showing they agree, within published uncertainty bands, with the best-available authoritative public references. It does not constitute a verified carbon claim.
Above-ground biomass and soil organic carbon estimates from the EcoIntel pipeline were independently sampled against the listed reference datasets at each parcel polygon via Google Earth Engine, and compared against an Italian national-inventory lookup (INFC2015) for IT sites. Verdicts use a sigma-band: green = within 1σ of the reference, amber = within 2σ, red = outside 2σ or > 50 % absolute deviation. Per-parcel and site-mean summaries are written to ReportOutput/<SITE>/verification/verification_summary.json. The full reference catalogue is at Documentation/ReportBuilder/Verification_References.md.
Reference σ source, disclosed per reference because each dataset publishes its uncertainty differently:
• ESA CCI Biomass v4 publishes a per-pixel standard-deviation layer; we sample it directly. (sd_source = "published_band").
• FAO GSOCmap v1.5 does NOT publish per-pixel uncertainty and its 1 km resolution makes intra-parcel spatial stdev unreliable for parcels under ~10 ha. The verifier substitutes FAO's published global RMSE (≈25 % for European countries with dense national soil-survey contributions, per the GSOCmap v1.5 technical report Annex 4). (sd_source = "published_pct").
• ISRIC SoilGrids 2.0 OCS, within-parcel spatial stdev. The pipeline reads SOC stocks from this dataset directly, so the verdict is reported as a SOURCE-CONFIRMATION cross-check (not an independent reference) and is excluded from the "authoritative refs" headline count even when it returns green.
• INFC2015 (Italian National Forest Inventory), verbatim regional × forest-category mean carbon stock from INFC's published Q1.17 tables (trees + small trees + shrubs above-ground carbon). Per-parcel σ is derived as a 30 % coefficient of variation, which represents the population spread across plots within a (region × category) stratum (CV documented in Gasparini et al. 2022 and Italy's UNFCCC NIR submissions for live AGB carbon). The published "ES (%)" column. INFC's standard error of the regional MEAN, typically 1-15 %, is preserved alongside but NOT used as σ because it would represent regional-mean precision rather than per-parcel variability and would produce overly strict verdicts. Per-stratum plot counts (which would let us derive an empirical population SD via SE × √n) are not published in INFC's Q1.17 series; if added, the CV-based approximation can be replaced. (sd_source = "lookup_csv", with the methodology documented in ProcessingTools/asset_generators/_data/infc_carbon_by_region_category.csv).
Pipeline vs. reference, visual summary
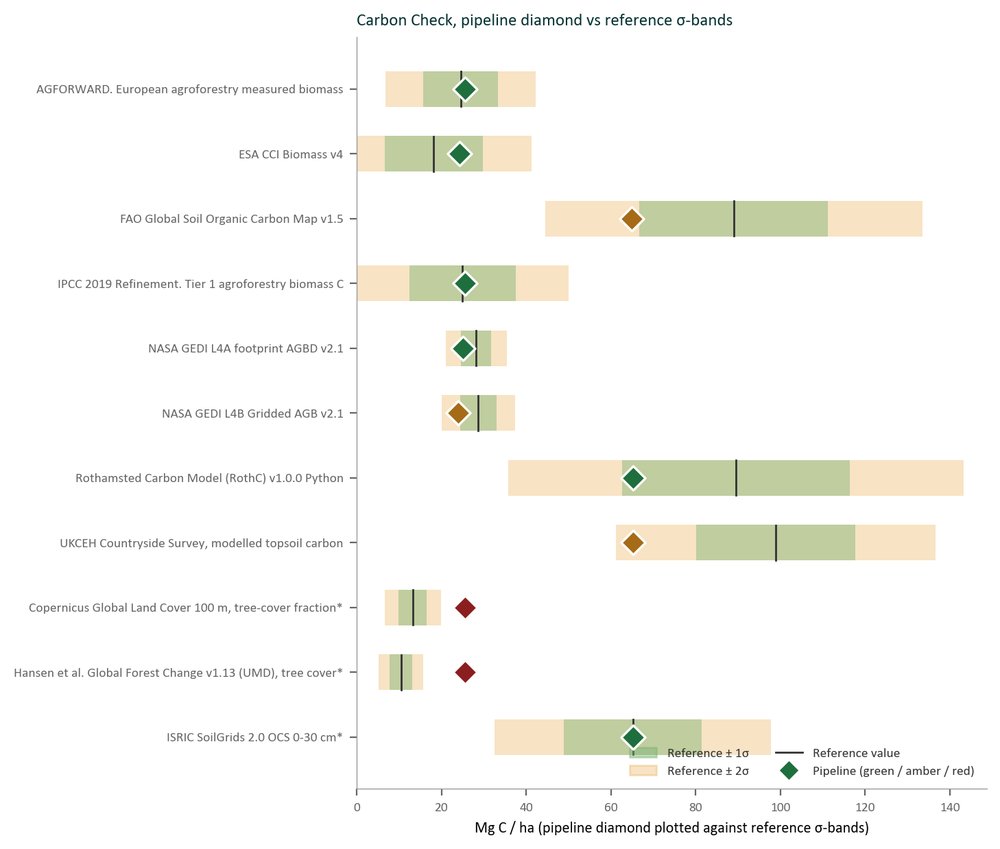
Section 10: Framework Mapping
Disclosure framework matrix
The table leads with the satellite-derived evidence in this report and maps it to the disclosure frameworks it supports. It is a reference guide, not a compliance certification.
This report is indicative, decision-support information, informed by the TNFD, CSRD/ESRS E4, GRI 101, SBTN, ISSB/IFRS S1, the carbon group (GHG Protocol Land Sector, ISO 14064-2, IFRS S2), ESRS E1 and EUDR frameworks. It is not a statement of compliance, not assurance, and does not constitute an explicit and unreserved statement of compliance under IFRS S1. EcoIntel is not a verifier (VVB) and is not affiliated with, endorsed by, or certified by any framework body.
Framework | What EcoIntel evidences | Maps to | Status | Assurance ceiling |
TNFD · LEAP + core metrics | LEAP locate, evaluate and assess run end to end; the four-process Land Health Score is the ecosystem-condition read and the parcel geometry gives extent | Maps to: TNFD LEAP, TNFD ecosystem-condition core metric, TNFD ecosystem-extent core metric | Evidenced | Limited (indicators); indicative, not VVB-verified |
CSRD · ESRS E4 | ecosystem extent and condition mapped at site scale; the multi-year condition trajectory seeds the target baseline | Maps to: ESRS E4-5, ESRS E4-4 | Evidenced | Limited (indicator) datapoints; a VVB verifies |
GRI 101 · Biodiversity (2024) | locations and the state of nature reported at site scale from the four-process condition read | Maps to: GRI 101-5, GRI 101-6, GRI 101-7 | Evidenced | Management-reported, EcoIntel-evidenced; not VVB-verified |
SBTN · Targets for Nature | Steps 1 to 2 baseline built from ecosystem condition and 8-year land-use change | Maps to: SBTN Step 1, SBTN Step 2 | Baseline | Steps 1 to 2 baseline; client sets and SBTN validates the target |
ISSB · IFRS S1 (+ nature guidance) | nature-related risks and dependencies positioned against S1 governance, strategy and risk-management via TNFD | Maps to: IFRS S1 | Positioned | Positioned for narrative via TNFD; quantitative metrics + assurance pending |
Carbon · GHG LSR / ISO 14064 / ISSB S2 | land-sector carbon balance with soil organic carbon and above-ground biomass stocks; flux cross-checked across reference layers | Maps to: GHG Protocol LSR, ISO 14064-2, IFRS S2 | Baseline | Monitoring only, a VVB verifies; indicative, not VVB-verified |
CSRD · ESRS E1 | climate trends, vapour-pressure deficit and drought indicators from the climate record | Maps to: ESRS E1 | Baseline | Indicative climate trends; a VVB verifies; not VVB-verified |
EUDR · deforestation-free (Dec 2026) | geolocation polygons for the parcels; the disturbance layer supports no-conversion screening where available | Maps to: EUDR geolocation | Baseline | Evidence layer; the client files the due-diligence statement |
EOV (Savory) is referenced as a calibration basis, not a disclosure framework row.
ESRS E4 detail
ESRS E4 requirement | Evidence / source | Status |
E4-4: Satellite baseline (ecosystem condition) | section 6 Evidence | Evidenced |
E4-4: Land condition trajectory | section 6 Evidence; EDX trajectory chart in section 4 | Evidenced |
E4-5: Process scores (WCI / EFI / MCI / CDI) | section 6 Evidence; process kite | Evidenced |
E4-5: Biodiversity proxy (CDI) | section 6 Evidence | Positioned |
E4-1: Transition plan | Client to provide | Client data required |
E4-2: Policies | Client to provide | Client data required |
E4-3: Actions & resources | Client to provide | Client data required |
E4-6: Financial effects | section 11 Risk; client to extend | Cross-reference |
Lifting E4-1, E4-2, E4-3 from Baseline to Documented (operator-attested) requires a brief description of the entity's transition plan, policies, and actions. A template is available on request. Operator-attested rows are Documented, never Evidenced (which is reserved for satellite-proven findings).
TNFD LEAP detail
TNFD LEAP step / indicator | Evidence | Status |
Locate | Site mapped, satellite monitoring active | Evidenced (indicative) |
Evaluate | 8-year multi-sensor assessment | Evidenced (indicative) |
Assess | Process constraints, trends, climate risk assessed | Evidenced (indicative) |
Prepare | Report metrics generated; disclosure-readiness dashboard | Positioned |
Brittleness | 3.5/10 (Non-brittle) | Cross-reference |
Latest weather classification | NORMAL | Cross-reference |
Section 11: Risk and Opportunity Snapshot
Risk
Parcel | Likelihood | Impact | Rationale |
|---|---|---|---|
Hundred Acre Wood | Low | Medium | Healthy condition (EDX7, 70% EHI); declining trend; recent disturbance (1 detection); 6.5 ha |
Six Pine Trees | Low | High | Healthy condition (EDX7, 72% EHI); declining trend; recent disturbance (1 detection); 12.5 ha |
The Three Bears' Cottage Field | Medium | High | Transitional / recovering (EDX5, 57% EHI); stable trend; recent disturbance (4 detections); 8.4 ha |
Humpty Dumpty's Wall Field | Medium | High | Transitional / recovering (EDX5, 56% EHI); stable trend; recent disturbance (1 detection); 6.5 ha |
Goldilocks Field | Medium | High | Stressed condition (EDX3, 44% EHI); stable trend; recent disturbance (3 detections); 7.5 ha |
Hickory Dickory's Meadow | Medium | High | Transitional / recovering (EDX5, 56% EHI); stable trend; recent disturbance (2 detections); 5.2 ha |
Jack's Beanstalk Field | Medium | High | Transitional / recovering (EDX5, 56% EHI); rising trend; recent disturbance (2 detections); 6.1 ha |
The Crooked Man's Field | Medium | High | Stressed condition (EDX4, 53% EHI); stable trend; recent disturbance (2 detections); 6.8 ha |
Three Blind Mice Meadow | Medium | High | Stressed condition (EDX3, 43% EHI); declining trend; 8.4 ha |
Old Mother Hubbard's Field | Low | Medium | Transitional / recovering (EDX6, 63% EHI); stable trend; recent disturbance (2 detections); 3.0 ha |
The Spider's Web Meadow | Low | Medium | Transitional / recovering (EDX6, 64% EHI); rising trend; recent disturbance (1 detection); 4.1 ha |
The Cat and the Fiddle Field | Medium | High | Stressed condition (EDX4, 50% EHI); stable trend; recent disturbance (3 detections); 5.7 ha |
The Wild Wood | Medium | High | Transitional / recovering (EDX5, 59% EHI); stable trend; recent disturbance (1 detection); 6.4 ha |
Mr Toad's Hall Field | Medium | Medium | Transitional / recovering (EDX5, 55% EHI); stable trend; recent disturbance (1 detection); 2.0 ha |
Heffalump Pasture | Low | Low | Transitional / recovering (EDX5, 60% EHI); rising trend; recent disturbance (2 detections); 0.2 ha |
Pooh Corner Meadow | Low | Low | Transitional / recovering (EDX5, 61% EHI); stable trend; recent disturbance (1 detection); 0.2 ha |
Tigger's Bouncing Field | Medium | Medium | Transitional / recovering (EDX5, 59% EHI); rising trend; recent disturbance (2 detections); 3.9 ha |
The Old Grey Mare's Field | Medium | Medium | Stressed condition (EDX4, 52% EHI); stable trend; recent disturbance (1 detection); 3.0 ha |
Little Boy Blue's Haystack | Low | High | Transitional / recovering (EDX6, 63% EHI); stable trend; recent disturbance (3 detections); 7.1 ha |
Squirrel Nutkin's Field | Medium | High | Transitional / recovering (EDX5, 56% EHI); stable trend; recent disturbance (4 detections); 6.3 ha |
Old MacDonald's Farmyard | Medium | High | Stressed condition (EDX3, 45% EHI); stable trend; recent disturbance (2 detections); 7.7 ha |
Rabbit's Bottom Field | Low | Medium | Transitional / recovering (EDX6, 63% EHI); rising trend; recent disturbance (1 detection); 2.7 ha |
Kanga's Long Meadow | Medium | Medium | Transitional / recovering (EDX5, 57% EHI); stable trend; recent disturbance (2 detections); 3.3 ha |
Peter Rabbit's Patch | Low | Low | Healthy condition (EDX7, 69% EHI); stable trend; recent disturbance (1 detection); 0.9 ha |
Baa-Baa Pasture | Medium | Medium | Transitional / recovering (EDX5, 60% EHI); stable trend; recent disturbance (1 detection); 2.2 ha |
Old Brown's Field | Low | Low | Transitional / recovering (EDX6, 64% EHI); stable trend; recent disturbance (1 detection); 1.2 ha |
Mr McGregor's Garden | Low | Medium | Transitional / recovering (EDX6, 62% EHI); stable trend; recent disturbance (1 detection); 3.1 ha |
Tom Kitten's Meadow | Low | Medium | Transitional / recovering (EDX6, 62% EHI); stable trend; 3.9 ha |
Mary's Garden | Low | Medium | Transitional / recovering (EDX6, 66% EHI); stable trend; recent disturbance (1 detection); 1.4 ha |
Jack & Jill's Hill | Low | Medium | Transitional / recovering (EDX6, 66% EHI); stable trend; 1.8 ha |
Wee Willie Winkie's Meadow | Low | Medium | Transitional / recovering (EDX6, 66% EHI); stable trend; recent disturbance (1 detection); 1.5 ha |
Bo-Peep's Sheep Field | Low | Medium | Transitional / recovering (EDX6, 63% EHI); rising trend; recent disturbance (2 detections); 3.2 ha |
Floody Place | Low | Medium | Transitional / recovering (EDX6, 66% EHI); stable trend; 2.7 ha |
Roo's Sandy Pit | Low | High | Transitional / recovering (EDX6, 66% EHI); stable trend; recent disturbance (1 detection); 6.3 ha |
Rabbit's Top Field | Low | Medium | Transitional / recovering (EDX6, 63% EHI); stable trend; recent disturbance (2 detections); 4.8 ha |
Piglet's Patch | Low | Medium | Transitional / recovering (EDX5, 60% EHI); stable trend; 1.9 ha |
Poohsticks Bridge | Low | High | Transitional / recovering (EDX6, 67% EHI); stable trend; recent disturbance (1 detection); 6.1 ha |
The Thoughtful Spot | Medium | Low | Transitional / recovering (EDX5, 58% EHI); stable trend; 0.5 ha |
Pigling Bland's Pasture | Low | Medium | Transitional / recovering (EDX6, 64% EHI); rising trend; recent disturbance (1 detection); 3.3 ha |
Benjamin Bunny's Burrow Field | Low | Medium | Transitional / recovering (EDX5, 61% EHI); stable trend; recent disturbance (2 detections); 3.0 ha |
Owl's Holt | Medium | Medium | Stressed condition (EDX3, 42% EHI); declining trend; recent disturbance (1 detection); 1.7 ha |
Wol's Wood | Low | Low | Transitional / recovering (EDX6, 61% EHI); stable trend; 0.4 ha |
On-average across parcels: medium likelihood, medium impact
Drought exposure on shallow-soil ridges is the headline risk
The biggest thing that could go wrong on this property is a genuine summer drought landing on the ridge-top pastures at the same time as a stocking peak. Devon has been forgiving so far. The last eight growing seasons have all sat inside the normal band for a non-brittle site (rainfall between 314 and 486 mm across the growing season, with 2024 being unusually generous). But the pattern to notice is that stress weeks and optimal weeks are both climbing over time, which is the signature of a climate that is becoming more variable rather than drier on average. A property that has never really been tested by drought does not yet know where its weak points are. The ridge-top fields are where a dry summer would show first. Old Brown's Field sits on a ridge (95 percent ridge, south-facing, Land Health Score 6 mid), The Spider's Web Meadow (76 percent ridge, east-facing) and Old Mother Hubbard (63 percent ridge) are the next most exposed. These fields already read a little drier in the water cycling data than the valley-floor fields, with Water Cycle Index in the mid-80s rather than the low-90s. That is still healthy, but the gap tells you which fields will lose ground first in a dry July. The management response is not complicated: rotate livestock off the ridges in a dry spell and onto the valley fields (Peter Rabbit's Patch, Poohsticks Bridge, Rabbit's Bottom Field) which will hold moisture two to three weeks longer.
The Cat and the Fiddle, Old MacDonald's Farmyard, Goldilocks and Three Blind Mice need attention this year
Four grassland parcels are running well below the site average and represent the concentrated risk on the property. The Cat and the Fiddle is at Land Health Score 4 (low) with mineral cycling reading 38 percent, which is genuinely weak. Old MacDonald's Farmyard, Goldilocks Field and Three Blind Mice Meadow are all at Score 3 with all four ecosystem processes in the 30 to 45 percent range. Nothing else on the property is anywhere near this band. These four fields are a combined risk to the site headline and, more practically, they are the fields most likely to fail in a stressed year because they have the least ecological buffer. The pattern across these four is uniform-low weakness rather than one dominant process failure, which points at systemic causes: possibly compaction, possibly a legacy of heavy set-stocking, possibly a soil chemistry issue. Worth walking these four with a spade this spring. If the top 15 cm shows a compaction pan, a single aeration pass followed by extended rest and mob grazing will reset the trajectory faster than any other intervention.
Owl's Holt is the forest-track risk to watch
On the forest parcels the picture is broadly good, but Owl's Holt is the exception and needs naming clearly. The parcel reads at Land Health Score 3 (mid) with energy flow at 20 percent, which is a collapsed reading against the wooded-pasture reference. The trajectory tells the story: this parcel ran at Score 5 to 6 from 2018 to 2021, dropped to Score 4 in 2022 and 2023, hit Score 2 in 2024, and is now recovering at Score 3. The disturbance record shows four separate biomass signals between 2018 and 2025, including a partial harvest signal in 2022 and a spectral break in September 2025. Canopy cover currently reads 66.7 percent, down 2.2 percentage points year-on-year. This is a parcel in active recovery from repeated interventions. The risk here is management-driven rather than climate-driven: any further biomass removal in the next two to three years will delay recovery significantly. The other three forest parcels (Hundred Acre Wood, Six Pine Trees, Wol's Wood) all sit at Score 6 or 7 and are functioning well. Wol's Wood shows a 4.7 percentage point canopy drop year-on-year and is worth checking on the ground, but the composite score has actually recovered from Score 3 in 2024 to Score 6 this year, so the parcel is healing.
Community diversity is the property-wide vulnerability that is invisible from the ground
The subtler risk, and the one that a walking inspection will not catch, is that community dynamics is the weakest of the four ecosystem processes across the whole grassland estate. Read down the CDI column and the numbers cluster in the 50s and 60s on the good fields, and drop into the 30s and 40s on the weaker ones. Water, energy and minerals are all working well; species diversity is the thin layer. On a non-brittle site like Devon this is the classic signature of long rest under a limited species pool: the grasses that are there grow vigorously, but the sward is not diversifying on its own. This matters because diversity is the insurance policy for the climate variability signal we already see in the weather record. A five-species sward on Peter Rabbit's Patch will hold biomass through a stress week that a fifteen-species sward would barely notice. The right response is emphatically not to buy in seed. Start with extended rest and let existing species flower and set seed, then cut hay from your most diverse paddocks (Peter Rabbit's Patch and Poohsticks Bridge are the candidates, with the highest CDI on the property) and spread it green onto the weaker fields with livestock trampling it in. A three-year on-farm seed transfer programme, done in that order, will move the CDI numbers more reliably than any purchased mix and at a fraction of the cost.
What to prepare for
In priority order: first, the four low-scoring grassland fields need a spade check and a management decision this spring. Second, Owl's Holt needs a moratorium on further biomass removal for two to three years. Third, build a drought playbook now, before you need it, that identifies which fields livestock come off first and which fields they move onto. Fourth, start the on-farm seed transfer work on the weakest ten fields, using your own diverse paddocks as the donor. None of these are emerg
See the Risk Report companion document for the ecological / financial / compliance triage matrix and per-field detail.
Opportunity
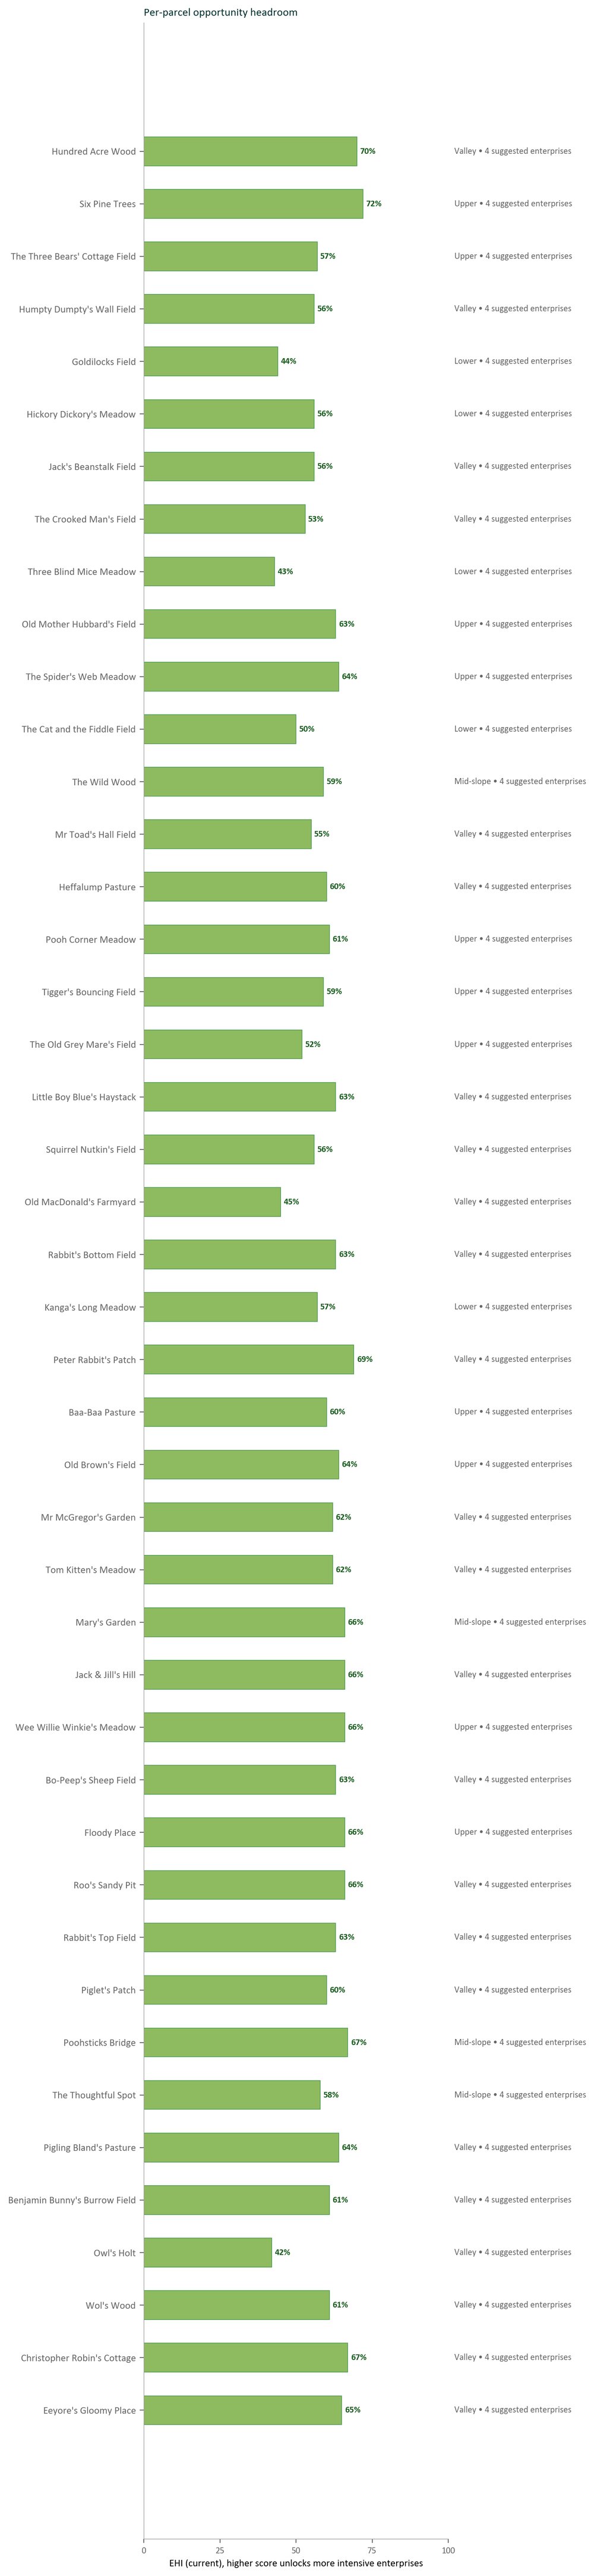
The highest-impact move is closing the diversity gap on the weakest third of the grassland
The single largest upside on this property sits in roughly a dozen grassland parcels where community dynamics is the drag on everything else. Water and mineral cycling on these fields are working well, the biology just does not yet have the species toolkit to convert that into peak production and resilience. Fix that and the whole property lifts. The pattern is clear in the numbers. Three Blind Mice Meadow reads at Land Health Score 3 (mid) with community diversity at 30 percent, Goldilocks Field at Land Health Score 3 (low) with diversity at 33 percent, and Old MacDonald's Farmyard at Land Health Score 3 (low) with diversity at 35 percent. In every one of these cases the water cycle is functioning at 64 to 68 percent and the mineral cycle at 39 to 42 percent, so the machinery for growth is present. What is missing is the range of plants that would let the sward respond to variable weather, cycle nutrients efficiently, and hold ground under grazing pressure. Lift community diversity on these fields from the low-30s into the 50s and the composite Score moves from band 3 to band 5 without any other intervention. The realistic upside on the weakest twelve parcels is roughly 10 to 15 Score points over three to four seasons. The route to that upside follows the standard recovery hierarchy, and the good news is that it costs almost nothing. Start with rest, extend recovery periods on Three Blind Mice, Goldilocks and Old MacDonald's Farmyard so the existing seed bank can express, flower and self-seed. Follow with mob grazing to trample seed into the surface and break any thatch layer. Defer one or two paddocks per season for full seed set, then cut hay with ripe seed heads from the strongest diversity paddocks on the property (Peter Rabbit's Patch, Poohsticks Bridge, Wee Willie Winkie's Meadow) and spread it onto the weaker fields with livestock to trample it in. Purchased seed is the last resort, and on this property with 38 grassland parcels the on-farm donor material is abundant, there is no need to buy anything in for two to three years.
Owl's Holt is the second-highest-leverage opportunity, and it is a forest question, not a grassland one
The wooded pasture at Owl's Holt is the one parcel where the trajectory has genuinely weakened, moving from Land Health Score 6 in 2019 and 2020 down to Land Health Score 3 (low) in 2025. The disturbance signals across 2018 to 2025 show a sequence of biomass drops, a partial harvest signature in 2022, and a burn-ratio break in 2025, with canopy cover now at roughly 67 percent and dropping. Energy flow reads at 20 percent, which is the limiting process by a wide margin. Mineral cycling and water cycling on the parcel are still functioning at 80 percent, so the soil and hydrology are intact. What has weakened is the canopy itself and the productive tree layer that drives everything else in a wooded pasture system. The opportunity here is to decide what Owl's Holt is meant to be over the next decade and manage accordingly. If it is intended as wooded pasture, active canopy recovery through underplanting, browse control and a rest period from stock during establishment will lift the parcel back toward Land Health Score 6 within three to five years. If the intention is a different regime altogether (more open silvopasture, or conversion toward alley-cropping alongside the neighbouring Hundred Acre Wood and Six Pine Trees), that is a strategic decision worth taking deliberately rather than by drift. Either way, this is the parcel where a specific intervention plan will pay back most visibly in the next assessment cycle.
The alley-cropping parcels are the property's flagship and they can be pushed further
Hundred Acre Wood at Land Health Score 7 (mid) and Six Pine Trees at Land Health Score 7 (mid) are already reading in the healthy range for their reference state. Water cycling is at 92 and 100 percent, mineral cycling in the mid-60s, community diversity at 69 percent on both. The limiting process on each is energy flow, sitting at 60 and 67 percent, which is characteristic of alley-cropping systems where the tree rows are still building canopy volume alongside the crop alleys. The eight-year record shows both parcels have held Score 7 to 9 consistently, with the small dip to Score 7 in 2025 tracking a late-season row work signature rather than any underlying decline. The upside on these two parcels is more modest in Score points (perhaps 2 to 3 points, into band 8) but it is worth pursuing because it demonstrates what the property can be. The lever is tree row biomass: as the rows mature and canopy volume rebuilds between harvest cycles, energy flow will climb into the 70s and pull the composite Score with it. The management question is whether the current row-work rotation (visible in the 2018, 2020, 2022 and 2025 disturbance signals) allows enough recovery time between interventions. Stretching the interval by a year or two, or staggering the work so that at any given time three-quarters of the rows are in full canopy, would let the energy flow score settle at its higher band.
The realistic five-year picture
Taken together, the grassland diversity work, the Owl's Holt canopy decision, and the alley-cropping refinement give the property a coherent five-year improvement plan. On the grassland side, the weakest twelve fields lift from band 3 and 4 into band 5 and 6, and the strong fields in band 6 and 7 hold or tick up as the whole rotation gets more forage-diverse. Wol's Wood, currently at Land Health Score 6 (mid) after a 2021 to 2022 biomass drop, will continue its natural recovery without intervention (it has already climbed from Score 3 in 2024 back to Score 6). The forest track parcels stabilise at Score 7 to 8, and the site-wide grassland aggregate moves from its current
See the Opportunities Report companion document for per-field opportunity cards and a wider ecosystem-service indicator set.
Section 12: Methodology and Confidence
Data sources, the sensor stack
Every metric in this report is computed from public satellite data and reanalysis products. Twelve platforms contribute to the assessment, integrated through ecoregion- and regime-aware scoring models calibrated against EcoIntel’s in-field ground-truth dataset.
Platform | Resolution | What it contributes to this report |
|---|---|---|
Sentinel-2 MSI | 10 m optical | Spectral indices (NDVI, NDMI, NBR, NDWI, BSI, SAVI), green-season duration, photosynthetic phenology |
Sentinel-1 SAR | 10 m C-band radar | Surface roughness, canopy structure (VV/VH), disturbance detection (annual VH steps) |
PALSAR-2 ScanSAR | 25 m L-band radar | Above-ground biomass (HV backscatter allometry), woody-cover volume, structural complexity |
MODIS Terra/Aqua | 500 m optical/thermal | Gross primary productivity (MOD17), land-surface temperature, thermal anomaly detection |
ERA5-Land | 0.1° climate reanalysis | Precipitation, air temperature, vapour pressure deficit, evapotranspiration ratio, weekly classification |
ISRIC SoilGrids 2.0 | 250 m soil predictions | Soil organic carbon stock 0-30 cm, soil texture, bulk density (used for SOC tC/ha) |
FAO GSOCmap v1.5 | 1 km soil carbon | Independent soil-carbon reference for cross-check (authoritative reference in section 9) |
ESA CCI Biomass v4 | 100 m forest biomass | Above-ground biomass authoritative reference, with per-pixel standard-deviation layer for σ-banding |
NASA GEDI L4A / L4B | spaceborne lidar | Above-ground biomass density (footprint and gridded) , closed-canopy forest reference |
Hansen Global Forest Change v1.13 | 30 m annual | Forest-cover loss detection, year-end disturbance flags |
Copernicus Global Land Cover | 100 m annual | Tree-cover fraction, dynamic land-cover classification |
Dynamic World v1 | 10 m near-real-time | Land-cover transitions year-on-year (Trees / Grass / Shrub / Crops / Bare / Water / Built / Snow / Flooded vegetation) |
Scoring models
Ecosystem health is scored by an eight-model ensemble combining spectral, temporal, radar, topographic, and climate predictors. Two model variants (G and H) incorporate growing-season stress weeks and evapotranspiration ratio so weather-driven noise is separated from underlying ecosystem-health signal. Cross-validated performance against in-field ground-truth: R²=0.55, MAE=11 points, r=0.79.
Forest-track parcels, closed forest, woodland, silvopasture, agroforestry, orchard, use a regime-specific reference state rather than the grassland ensemble. Reference cells are keyed on (regime × ecoregion × brittleness), so a wood-pasture or agroforestry parcel in Atlantic Central (ATC) at non-brittle conditions is benchmarked against the appropriate forest reference rather than against the grassland ensemble.
Halo correction
Both satellite and field assessors are influenced by weather conditions on the day of observation. EcoIntel applies climate-aware scoring on the satellite side, and on the in-field side replaces three slow-changing indicators (microfauna, cool-season grass composition, rare desirable species) with their multi-year averages. The result is an EHI~ score that represents what the land IS, not what the weather made it look like on the day.
What remote sensing can and cannot detect
Satellite indicators capture canopy density, vegetation moisture, thermal regulation, structural biomass, and seasonal growth pattern across every parcel every week of the assessment window. They cannot identify individual species, downstream water quality or sediment load, soil compaction below the rooting zone, sub-pixel features (hedges < 10 m, ponds < 100 m²), or subsurface management interventions. Where these are material, the report flags them and recommends ground-based investigation.
Hansen GFC magnitude, interpretation guidance
Hansen Global Forest Change v1.13 reports forest-loss events as a binary pixel-level flag (30 m resolution, year-end calendar granularity). When the disturbance signal list (section 7) shows a Hansen magnitude in "% of parcel", that is the FRACTION OF THE PARCEL AREA WHERE HANSEN'S PIXEL ALGORITHM FIRED. NOT the fraction of canopy lost. On steep mountainous mixed-pixel terrain (slopes > 15°, parcels < 10 ha) Hansen routinely flags whole-parcel coverage on partial harvests because adjacent pixel signal propagates and the loss-detection threshold is low. The report cross-checks against two independent signals whenever Hansen fires above 50 % of parcel: (i) the year-on-year delta in `canopy_cover_pct` from forest_observations (actual canopy change in percentage points); (ii) where available, an operator VISUAL ESTIMATE of canopy fraction removed, made by comparing high-resolution Google Earth before-and-after imagery. The operator visual estimate is a sanity check from imagery comparison. NOT a ground survey, NOT formally verified, and NOT a measurement. It is included because at the magnitudes typical of partial harvest (10-40 % canopy loss on a small parcel) Hansen's pixel-area flag and the satellite-derived canopy-cover delta both have systematic uncertainties of the same order, and a visual eye-check against the imagery is an inexpensive third reference. The Harvest intensity panel in section 7 surfaces all three side by side. Always read Hansen "% of parcel" as a detection-area flag, never as a canopy-loss measure.
Confidence
Assessment period: 8 years (2018-2025). Confidence: HIGH. Longer records capture inter-annual variability and distinguish genuine trends from weather-driven noise; the 8-year record here gives a high confidence classification under EcoIntel’s scoring framework.
Framework mapping note
This report maps satellite-derived indicators against framework information requirements. “Indicative of” language is used throughout to reflect that the data is satellite-derived and not independently verified. Where a framework requires client-specific disclosures (transition plans, policies, actions), placeholders indicate what additional information is needed to lift those rows from Baseline to Documented (operator-attested). A management representation can move a row to Documented, never to Evidenced.
Section 13: Glossary
Water Cycle Index (WCI)
| Level | Range | What this level means |
|---|---|---|
| 9Flourishing | 95-100% | The landscape acts as a sponge, rainfall infiltrates fully and soils hold steady through extreme events. |
| 8Thriving | 90-95% | Excellent infiltration with rare runoff. The water cycle is doing its job through normal storms. |
| 7Healthy | 85-90% | Good infiltration with only occasional runoff in heavy rain. Soils are mostly stable. |
| 6Recovering | 80-85% | The water cycle is working but with some runoff during storms. Foundations are sound and the room to improve is in capture and retention. |
| 5Transitional | 70-80% | A transitional water cycle, working in places, weakening in others. Targeted landscape design (keyline, swales, ponds) would unlock real gains. |
| 4Stressed | 60-70% | The water cycle is weakening across the system, frequent sheet flow and pedestals around plants signal active soil loss. |
| 3Degraded | 50-60% | Significant dysfunction in the water cycle, rills and runoff are common across the landscape. |
| 2Depleted | 40-50% | Severe weakening of the water cycle; most rainfall is lost to runoff and the soil surface is widely capped. |
| 1Collapsed | 0-40% | The water cycle has effectively collapsed, rainfall runs off immediately and erosion is severe. |
Energy Flow Index (EFI)
| Level | Range | What this level means |
|---|---|---|
| 9Flourishing | 95-100% | Peak photosynthetic capacity throughout the year, the system captures all available solar energy. |
| 8Thriving | 85-95% | Strong biomass production with a stable canopy through normal disturbance. |
| 7Healthy | 75-85% | Healthy canopy growth with only brief stress-related dips. |
| 6Recovering | 60-75% | The canopy is doing real work, with seasonal stress dips that recovery has not yet smoothed out. Energy capture is on the right side of the curve. |
| 5Transitional | 40-60% | Energy capture is uneven across the year, strong in spring, weakening in summer. Recovery management would lift this further. |
| 4Stressed | 30-40% | A thin canopy with patchy litter; the system is producing biomass but slowly and unreliably. |
| 3Degraded | 20-30% | Low photosynthetic capacity even in growing season; canopy is sparse and slow to respond. |
| 2Depleted | 10-20% | Very low photosynthesis; the canopy is nearly absent for much of the year. |
| 1Collapsed | 0-10% | Canopy has collapsed or is dominated by standing dead material. |
Mineral Cycle Index (MCI)
| Level | Range | What this level means |
|---|---|---|
| 9Flourishing | 90-100% | Rapid, complete nutrient cycling, the soil builds organic matter continuously. |
| 8Thriving | 80-90% | Strong mineral cycling with fast litter incorporation and high microbial activity. |
| 7Healthy | 70-80% | Good mineral turnover with only occasional seasonal slow-down. |
| 6Recovering | 60-70% | Mineral cycling is working but slows in dry or cold periods. The biological engine is in place, the next step is to keep it warm year-round. |
| 5Transitional | 50-60% | Litter is starting to accumulate without breaking down; cycling is uneven across the site. |
| 4Stressed | 40-50% | Poor litter incorporation, nutrients are locked in undecomposed material on the surface. |
| 3Degraded | 30-40% | Mineral cycle largely broken; bare ground and compacted surfaces are common. |
| 2Depleted | 20-30% | Active erosion is stripping soil and nutrients; cycling has effectively collapsed. |
| 1Collapsed | 0-20% | Soil mineral cycle is non-functional and nutrient cycling has effectively collapsed. |
Community Dynamics Index (CDI)
| Level | Range | What this level means |
|---|---|---|
| 9Flourishing | 85-100% | Rich functional diversity across all groups; rare species thrive. |
| 8Thriving | 75-85% | Well-structured communities with low presence of undesirable species. |
| 7Healthy | 65-75% | Healthy functional groups; rare species appear occasionally. |
| 6Recovering | 55-65% | Diversity is recovering, the foundation species are in place and the rarer functional groups are working their way back in. |
| 5Transitional | 45-55% | Some functional groups are uneven, and undesirable species are starting to gain ground. Extended recovery periods are the lever here. |
| 4Stressed | 35-45% | Key functional groups are noticeably weakening; diversity is declining. |
| 3Degraded | 25-35% | Undesirable species are common; rare species rarely seen. |
| 2Depleted | 15-25% | Functional groups are actively failing and diversity is sharply reduced. |
| 1Collapsed | 0-15% | The community has collapsed to a handful of stress-tolerant species. |
- Land Health Score
- The headline metric, a property's overall ecological condition, given as a level from 1 (Collapsed) to 9 (Flourishing) with its band label.
- Band
- The name attached to each level: Collapsed, Depleted, Degraded, Stressed, Transitional, Recovering, Healthy, Thriving, Flourishing. Each band has one fixed colour.
- EDX, Ecological Diagnostic Index
- The underlying 0-100% index from which the Land Health Score level is derived. Used in methodology only.
- EHI, Ecological Health Index
- The composite that combines the four ecosystem-process scores into the EDX value.
- Ecosystem processes
- The four functional lenses assessed on the same nine-level scale: Water Cycle, Energy Flow, Mineral Cycle and Community Dynamics.
- Evidenced · Positioned · Baseline · Documented
- Confidence language for each finding, from multiple corroborating signals (Evidenced) through to recorded but not yet corroborated (Documented). This report never uses pass / fail.
- VVB, Validation & Verification Body
- An accredited third party that verifies carbon or biodiversity claims for market use.
EDX Land Health Score
The Land Health Score classifies each property into one of nine bands. EDX is the technical name for the band number, so “EDX8 Thriving” is the same as “Land Health Score Level 8”. Each band corresponds to a percentage range of reference-state function for the site’s regime, ecoregion, and brittleness. The nine entries below describe each band in detail: the characteristic signatures in vegetation, soil, water function, and biological diversity, and the typical process score ranges. For an at-a-glance comparison across all nine bands see the per-year EDX classification maps in Section 6; for this site’s current band and assessment see Sections 2 and 6.
EDX9. Flourishing
Ecosystems not only resilient but actively improved by disturbance, with highly efficient water infiltration, negligible erosion, vigorous canopy with strong solar energy capture, and diverse communities where rare species thrive. Water cycles effectively with minimal runoff, soils remain stable under stress, and functional groups are vigorous across the full diversity spectrum. This represents the pinnacle of ecological health where the system builds capacity through interaction with its environment.
Process | Range | Characteristics |
|---|---|---|
Water Cycle (WCI) | 85-95% | Infiltration efficient; minimal runoff |
Energy Flow (EFI) | 90-98% | High live canopy; strong capture/conversion |
Mineral Cycle (MCI) | 85-95% | Soil surface stable; negligible erosion |
Community Dynamics (CDI) | 80-95% | Diverse; desirable functional groups vigorous; rares present |
Path to improvement: EDX9 represents optimal function. Maintain through adaptive management that responds to system feedback, protect rare species habitat, continue monitoring for early warning signals, and share knowledge with broader community to support regional ecosystem health.
EDX8. Thriving
Ecosystem processes are efficient and mutually reinforcing, creating robust ecological health that recovers quickly from disturbance. Good water infiltration with rare erosion events, stable soils showing no active degradation, high photosynthetic biomass production, and well-structured communities with low undesirable species presence. Systems at this level maintain function through normal climate variability and disturbance events.
Process | Range | Characteristics |
|---|---|---|
Water Cycle (WCI) | 80-90% | Good infiltration; rare rills |
Energy Flow (EFI) | 85-95% | High photosynthetic mass |
Mineral Cycle (MCI) | 80-90% | Stable; no active pedestals |
Community Dynamics (CDI) | 75-90% | Good structure; low undesirables |
Path to improvement: To reach EDX9: Enhance habitat complexity for rare species, eliminate remaining stress points in seasonal dips, fine-tune intervention timing to phenological and moisture cycles, increase functional group diversity in weak areas, and build deeper soil organic matter reserves through strategic carbon inputs.
EDX7. Healthy
Good infiltration, stable soils, strong canopy growth, and healthy community dynamics characterize this band, representing solid ecosystem function suitable for sustained productivity. Water cycles are mostly effective with occasional limitations, soils are predominantly stable, photosynthesis is robust with only short stress-related dips, and functional groups are healthy with rare species appearing occasionally. This is the threshold where regenerative management typically aims to maintain or exceed.
Process | Range | Characteristics |
|---|---|---|
Water Cycle (WCI) | 75-88% | Mostly effective; occasional limits |
Energy Flow (EFI) | 80-92% | Robust growth; short stress dips |
Mineral Cycle (MCI) | 72-88% | Mostly stable |
Community Dynamics (CDI) | 70-88% | Functional groups healthy; rares occasional |
Path to improvement: To reach EDX8: Address seasonal stress periods with better recovery management, increase litter cover uniformity across landscape, strengthen water infiltration in limited areas, boost functional diversity in weaker zones, and refine disturbance timing to match plant vigor cycles for faster recovery.
EDX6. Recovering
Ecosystem cycles are mostly working but with limited resilience and patchy diversity, indicating improvement from lower states but not yet fully functional. Some runoff events occur during heavy rainfall, minor soil instability is beginning to show, canopy exhibits evident seasonal stress dips, and some functional groups show weakness or patchiness. Land in this band is on a positive trajectory but requires continued management attention.
Process | Range | Characteristics |
|---|---|---|
Water Cycle (WCI) | 65-80% | Some runoff events |
Energy Flow (EFI) | 70-85% | Seasonal dips evident |
Mineral Cycle (MCI) | 60-78% | Minor instability showing |
Community Dynamics (CDI) | 60-80% | Some functional-group weakness or patchiness |
Path to improvement: To reach EDX7: Reduce bare ground exposure through improved canopy cover and understorey density, extend non-intervention periods between operations, address weak functional groups through enrichment planting or habitat creation, improve water distribution to eliminate dry spots, and build soil organic matter through increased litter retention and reduced soil disturbance.
EDX5. Transitional
Some ecosystem processes are holding while others are weakening, creating uneven canopy cover and diversity across the landscape. Runoff is frequent during storms, localized erosion and soil capping appear in vulnerable areas, canopy is uneven with variable vigor, and undesirable species are beginning to increase. This band represents a critical threshold where management decisions will determine whether the system improves toward EDX6 or weakens toward EDX4.
Process | Range | Characteristics |
|---|---|---|
Water Cycle (WCI) | 55-72% | Runoff frequent in storms |
Energy Flow (EFI) | 60-80% | Uneven canopy |
Mineral Cycle (MCI) | 50-70% | Localised erosion and capping |
Community Dynamics (CDI) | 50-72% | Undesirables creeping in |
Path to improvement: To reach EDX6: Urgent need to stop degradation trend. Immediately reduce soil disturbance, dramatically increase ground cover through enrichment planting and assisted natural regeneration, address erosion hotspots with targeted interventions, extend non-intervention periods significantly, and reduce harvesting pressure to allow ecosystem recovery. This is the last easy intervention point before major restoration becomes necessary.
EDX4. Stressed
Patchy vegetation cover, stuttering ecosystem cycles, and weakening functional group integrity characterize this vulnerable state. Water infiltration is poor with frequent sheet flow across the surface, pedestals begin to appear around plant bases indicating active soil loss, canopy is thin with patchy litter distribution, and key functional groups are noticeably weakening. Systems in this band are highly vulnerable to further degradation without significant management intervention.
Process | Range | Characteristics |
|---|---|---|
Water Cycle (WCI) | 45-62% | Poor soak; frequent sheet flow |
Energy Flow (EFI) | 50-70% | Canopy thin; litter patchy |
Mineral Cycle (MCI) | 40-60% | Pedestals appear |
Community Dynamics (CDI) | 40-60% | Key functional groups weakening |
Path to improvement: To reach EDX5: Major management redesign required. Cease all extractive operations and implement canopy retention, establish emergency ground cover through pioneer nurse species, address all visible erosion with mechanical and biological fixes, implement non-intervention zones for worst areas, introduce missing functional groups through assisted natural regeneration, and develop long-term soil rebuilding strategy. Expect 3-5 year recovery timeline with intensive inputs.
EDX3. Degraded
Poor water infiltration, visible erosion signals, low photosynthetic capacity, and rising dominance of undesirable species indicate significant ecosystem dysfunction. Regular runoff and rill formation occur, erosion indicators are common across the landscape, biomass production is low with slow recovery from disturbance, and undesirable species are becoming common while rare species are rarely seen. Land in this band requires comprehensive management redesign to prevent further decline.
Process | Range | Characteristics |
|---|---|---|
Water Cycle (WCI) | 35-55% | Regular runoff; rills |
Energy Flow (EFI) | 40-60% | Low biomass; slow recovery |
Mineral Cycle (MCI) | 30-50% | Erosion signals common |
Community Dynamics (CDI) | 30-55% | Undesirables common; rares rare |
Path to improvement: To reach EDX4: Comprehensive restoration program essential. Halt all extraction immediately, implement mechanical erosion control structures, establish pioneer nurse species for canopy rebuilding and soil stabilisation urgently, protect remaining seed trees as mycorrhizal refugia, consider importing topsoil for worst areas, develop 5-10 year restoration plan with staged interventions, seek expert guidance and potentially external funding. Economic returns unlikely for many years - focus must be on stopping collapse.
EDX2. Depleted
Severe weakening of water and mineral cycles, weak canopy, and failing diversity indicate land on the edge of collapse requiring urgent intervention. Little water infiltrates with most rainfall lost to runoff, active erosion with widespread soil surface capping, low photosynthetic activity producing minimal biomass, and functional groups actively failing with sharply reduced diversity. Without immediate management changes, systems in this band are likely to collapse to EDX1.
Process | Range | Characteristics |
|---|---|---|
Water Cycle (WCI) | 25-45% | Little infiltration |
Energy Flow (EFI) | 30-50% | Low photosynthesis |
Mineral Cycle (MCI) | 20-40% | Active erosion; capping widespread |
Community Dynamics (CDI) | 20-45% | Functional groups failing; low diversity |
Path to improvement: To reach EDX3: Emergency restoration required. Total cessation of all disturbance mandatory, intensive mechanical stabilisation of erosion features, emergency planting of nurse species and pioneer trees with mycorrhizal inoculation where networks have been destroyed, potential need for irrigation support in establishment phase, soil amendment programs to restart biological activity, professional restoration expertise essential. Timeline 10+ years, significant investment required. Consider whether restoration is economically viable or if alternative land use needed.
EDX1. Collapsed
Water runs off immediately, severe soil erosion is active, canopy is nearly absent or dominated by standing dead material, and ecological communities have collapsed toward a handful of stress-tolerant species. Flashy water loss occurs with every rainfall event, erosion is severe and ongoing, bare ground or dead vegetation dominate the landscape, and biological diversity has effectively collapsed. This represents complete ecosystem dysfunction requiring intensive, long-term restoration intervention.
Process | Range | Characteristics |
|---|---|---|
Water Cycle (WCI) | 0-35% | Flashy water loss |
Energy Flow (EFI) | 0-40% | Bare ground or standing dead dominate |
Mineral Cycle (MCI) | 0-30% | Severe erosion |
Community Dynamics (CDI) | 0-35% | Collapse toward a few stress-tolerant species |
Path to improvement: To reach EDX2: Requires intensive, long-term restoration commitment. Engineering solutions essential for hydrological stabilisation - terracing, check dams, retention structures. Imported soil substrate and mycorrhizal inoculum likely necessary. Phased assisted regeneration with pioneer nurse species and intensive irrigation for establishment. May require 15-20+ years and investment exceeding land value. Alternative consideration: managed retreat to less intensive land use, conservation easement, or habitat restoration with public funding support. Traditional productivity may not be recoverable.
Other Terms
Alphabetical reference for every acronym, dataset, and technical term used in the report body. The four ecosystem processes (WCI, EFI, MCI, CDI) are listed here as one-line entries; their full per-band ranges are in the EDX Land Health Score table above.
Term | Definition |
|---|---|
AGB | Above-Ground Biomass, standing plant biomass above the soil surface, estimated from PALSAR-2 L-band radar (tC/ha). |
BSI | Bare Soil Index, spectral measure of exposed soil. |
Catena | Soil sequence from ridge to valley. |
CDI, Community Dynamics Index | Structural diversity and vegetation complexity inferred from radar canopy volume, woody-biomass structure, and spectral edge density. Indicative of habitat condition; not a species-level census. |
CIred | Chlorophyll Index Red-edge, canopy chlorophyll concentration derived from Sentinel-2 red-edge bands. |
CV | Coefficient of Variation, standard deviation divided by mean. A measure of relative variability. |
DEM | Digital Elevation Model, gridded terrain height data (UK LIDAR 2m used in this report). |
Dynamic World | Google Dynamic World, near-real-time 10 m land-cover classification from Sentinel-2. |
ECOSTRESS | ECOsystem Spaceborne Thermal Radiometer on the International Space Station, high-resolution thermal imaging. |
EDX, EcoDynamic Index | 9-level classification of ecosystem health (1 Collapsed to 9 Flourishing) derived from the four ecosystem processes. Full per-band reference above. |
EFI, Energy Flow Index | Photosynthetic capacity across the growing season. Measures canopy density, leaf-area index, and converted solar energy. On forest-track parcels, EFI is benchmarked against the closed-canopy reference; recent canopy disturbance temporarily depresses the score even where the residual stand is healthy. |
EHI, Ecosystem Health Index | Composite score 0 to 100 percent representing the site’s position within its EDX band. Expressed as percent of reference-state function for the regime, ecoregion and brittleness combination. |
EHI~ (EHI tilde) | Halo-corrected version of EHI, the underlying ecosystem health signal with weather-driven scorer-perception noise removed. Three slow-changing indicators (microfauna, cool-season grass composition, rare desirable species) are replaced with their multi-year averages. Represents what the land IS rather than what the weather made it look like on the day. |
EOV, Ecological Outcome Verification | Savory Institute field-assessment protocol for measuring ecological outcomes. Cross-referenced in the framework matrix; not directly assessed in this report. |
ERA5 | ECMWF Reanalysis v5, global climate dataset. |
ESRS | European Sustainability Reporting Standards, EU mandatory disclosure framework (E1 = climate, E4 = biodiversity). |
ET / PET | Actual / Potential Evapotranspiration ratio. Higher ratios indicate moisture-sufficient conditions; lower ratios indicate water-stressed conditions. |
EVI | Enhanced Vegetation Index, improved greenness measure that reduces atmospheric and soil background effects. |
FAVOURABLE / NORMAL / STRESSED | Climate classification for the growing season. FAVOURABLE means optimal weeks are more than twice the stress weeks; STRESSED means stress weeks exceed 40 percent of the growing season; NORMAL is anything between. |
GHG Protocol | Greenhouse Gas Protocol, international corporate standard for greenhouse gas accounting. |
GPP / Reco / NEE | Gross Primary Productivity (carbon captured by photosynthesis), ecosystem respiration (carbon released by all biological activity), and Net Ecosystem Exchange (GPP minus Reco). NBP equals NEE minus disturbance plus harvested biomass exports. |
GS | Growing Season, the period of active vegetation growth. |
GT, GT* | GT = Ground Truth (in-field ecological assessment score). GT* is weather-corrected ground truth, removing assessor bias caused by weather conditions on the day of assessment. |
Halo correction | Both satellite and field assessors are influenced by weather on the day of observation. EcoIntel applies climate-aware scoring on the satellite side and replaces a small set of slow-changing in-field indicators with their multi-year averages. The result is the EHI~ tilde score. |
Hansen GFC "% of parcel" | In the disturbance table (section 7), Hansen Global Forest Change reports magnitude as the fraction of the parcel AREA where its 30 m pixel-level loss algorithm fired. This is NOT a measurement of how much canopy was lost. On steep mountainous mixed-pixel terrain Hansen routinely flags whole-parcel coverage even when actual canopy loss is far smaller. The harvest-intensity panel in section 7 shows the operator’s visual estimate of canopy fraction lost (from comparing Google Earth before-and-after imagery) alongside the Hansen flag. |
HV / VH / VV | Radar polarisation modes. VH is vertical-horizontal (Sentinel-1, biomass proxy). HV is horizontal-vertical (PALSAR-2, woody biomass). VV is vertical-vertical (Sentinel-1, moisture and roughness). |
ISO 14064-2 | International standard for quantification and reporting of greenhouse gas emission reductions at project level. |
LST | Land Surface Temperature, satellite-derived surface thermal emission, used for thermal-environment characterisation. |
MCI, Mineral Cycle Index | Nutrient turnover through litter decomposition, organic-matter incorporation, and vegetation nutrition. High scores indicate closed nutrient loops with minimal lock-up in standing dead material. |
MOD17A2H | MODIS Gross Primary Productivity product, 8-day GPP estimates used for carbon-flux calibration. |
MRV | Measurement, Reporting, Verification, the regulated audit pipeline required by voluntary carbon-market standards (VCS, Gold Standard, Plan Vivo, ART/TREES). This report is NOT an MRV submission and does not claim to be. |
MTCI | MERIS Terrestrial Chlorophyll Index, canopy chlorophyll content from Sentinel-2 red-edge reflectance. |
NBP, Net Biome Productivity | Net carbon flux including disturbance losses and harvested biomass exports. Positive means net sink (accumulating carbon); negative means net source. |
NDMI | Normalised Difference Moisture Index, canopy and soil water content from Sentinel-2 shortwave infrared. |
NDVI | Normalised Difference Vegetation Index, greenness measure. |
NEE | Net Ecosystem Exchange. GPP minus respiration. |
PALSAR-2 | JAXA ALOS-2 PALSAR-2, L-band Synthetic Aperture Radar satellite for woody biomass and structural estimation. |
Process kite | Four-axis radar chart showing the four ecosystem-process scores (WCI, EFI, MCI, CDI) on a 0 to 100 percent scale. A balanced kite reaching the outer edge is the target; an inwards pinch identifies the limiting process. |
Reco | Ecosystem Respiration, carbon released through biological activity. |
RS | Remote Sensing, satellite-derived ecosystem scores, as distinct from ground-truth (GT) field assessments. |
Shannon H | Shannon Diversity Index, information-theoretic measure of spectral class diversity across the landscape. |
Sigma-band verdicts | Used in the Authoritative Carbon Corroboration section. Green means within 1 sigma of the published reference value; amber means within 2 sigma; red means outside 2 sigma or greater than 50 percent absolute deviation; grey means no comparable reference value at this site. |
SMAP | NASA Soil Moisture Active Passive, satellite-derived surface soil-moisture estimates. |
SOC | Soil Organic Carbon, carbon stored in soil organic matter (tC/ha). Reported here as the top-30 cm stock from SoilGrids 250 m. |
SoilGrids | ISRIC SoilGrids 250 m, global gridded database of soil properties including organic carbon, bulk density, and texture. |
Spectral indices (NDVI, NDMI, NBR, NDWI, BSI, SAVI) | Sentinel-2 optical band combinations. NDVI is canopy greenness; NDMI is canopy moisture; NBR is the burn-ratio (used for severity detection); NDWI is surface water; BSI is the bare-soil index; SAVI is the soil-adjusted vegetation index. |
TNFD | Taskforce on Nature-related Financial Disclosures, framework for organisations to report nature-related risks and opportunities. |
TPI | Topographic Position Index, landscape position (ridge / valley / flat). |
TWI, Topographic Wetness Index | A landform-derived index of where water tends to accumulate in a landscape (high TWI means convergent or wet positions; low TWI means divergent or dry positions). |
VPD, Vapour Pressure Deficit | Atmospheric dryness stress indicator, the difference between the moisture air can hold and the moisture it currently holds. High VPD drives transpiration and water stress; low VPD eases canopy demand. |
VVB | Validation / Verification Body, the accredited third-party auditor that signs off MRV submissions. EcoIntel is not a VVB. |
WCI, Water Cycle Index | How effectively rainfall is captured, infiltrated, and retained. Combines vegetation cover, soil-moisture retention, bare-soil exposure, and litter cover. |
Brittleness
Understanding Brittleness
All terrestrial environments fall somewhere along a continuum from non-brittle to very brittle. Environments are classified along this continuum by how well humidity is distributed across the year and how quickly dead vegetation breaks down. Rapidly through biological decay in non-brittle environments, or slowly through weathering and physical breakdown in brittle ones. The distinction is fundamental because it determines which management tools will be effective and which will cause harm.
In non-brittle environments (score 1 to 4 on the scale), reliable moisture supports continuous biological decomposition. Dead plant material breaks down rapidly through fungal and invertebrate activity. Rest, the absence of disturbance, is a powerful regeneration tool because biological processes operate continuously. In brittle environments (score 6 to 10), moisture is erratic and unreliable. Dead material accumulates rather than decomposing, creating fuel loads. Rest alone cannot regenerate these landscapes. Planned disturbance (including animal impact) is required to cycle nutrients. Semi-brittle environments (score 4 to 6) sit between the two.
Key management principle
One way to think about regeneration is as cycles of impact and rest. The impact must deliver a well-timed disturbance that creates maximum positive stress. The right period of recovery and rest can then work with the consequence of the impact, plant life and soil life will now lean in.
Very non-brittle (1 to 2)
Rainfall is highly reliable and biological decomposition runs continuously through the year. The risk sits at the opposite extreme to brittle land: undisturbed rest combined with high productivity can produce rank growth and litter mats, so the management lever is selective disturbance and species diversity rather than rest.
Non-brittle (2 to 4)
Biological processes work continuously to build soil health. The balance tips toward rest. Longer recovery periods between disturbances let fungi, invertebrates, and mycorrhizal networks do the heavy lifting of decomposition and nutrient cycling.
Semi-brittle (4 to 6)
The balance between impact and rest shifts. Seasonal moisture patterns mean biological processes slow during dry periods. Time disturbances to coincide with reliable moisture windows so recovery can begin immediately.
Brittle (6 to 8)
Rest alone cannot regenerate the land. Without disturbance, dead material accumulates rather than decomposing, creating fuel loads. Planned impact (including animal impact) is required to cycle nutrients and break down standing dead material.
Very brittle (8 to 10)
Active intervention is essential. Passive restoration cannot reverse degradation. Water harvesting, nurse species, and soil rehabilitation are required. All interventions are opportunistic. Pre-position for deployment when rains arrive.
How the score is calculated
EcoIntel computes brittleness from reanalysis climate data. The precipitation coefficient of variation (CV) measures month-to-month rainfall variability across all assessment years. A low CV means rainfall is evenly distributed; a high CV means it arrives in bursts separated by dry periods.
The precipitation CV is converted to a raw brittleness score using a piecewise mapping, then adjusted for ecoregion. The zone baseline reflects the regional climate norm. The final score blends the precipitation-derived value (70 percent) with the zone baseline (30 percent).
The brittleness score and the precipitation CV are related but distinct measures. The CV is a pure statistical measure of rainfall variability. The brittleness score incorporates the CV but also adjusts for regional context. A CV of 0.5 in Atlantic Britain (where the baseline expectation is reliable rainfall) has different ecological implications than the same CV in the Mediterranean (where seasonal drought is the norm). The score reflects the ecological meaning of the variability, not the variability itself.
Precip CV (raw) | Brittleness (raw) | Category | Characteristics |
|---|---|---|---|
Less than 0.30 | 1 to 2 | Very Non-Brittle | Even rainfall, year-round growth, humid decomposition. |
0.30 to 0.50 | 2 to 4 | Non-Brittle | Rainfall well spread, short dry season. |
0.50 to 0.70 | 4 to 6 | Semi-Brittle | Rainfall patchy, longer dry spells. |
0.70 to 1.00 | 6 to 8 | Brittle | Long dry season; rainfall arrives in bursts. |
Greater than 1.0 | 8 to 10 | Very Brittle | Rainfall erratic; ecosystem inactive for long periods. |
How to read this table alongside the headline score: the table shows the RAW brittleness score derived from CV alone. The score reported in the property profile is the FINAL ecoregion-adjusted score, blending the raw value (70 percent) with the regional zone baseline (30 percent). A site whose raw value lands in one band can be reported in an adjacent band once the regional context is applied; the headline category in the property profile is always the final classification.